
North America Hydrophobic Coatings Market
Market Size in USD Million
 USD
96.18 Million
USD
156.80 Million
2025
2033
USD
96.18 Million
USD
156.80 Million
2025
2033
| 2026 - 2033 | |
| USD 96.18 Million | |
| USD 156.80 Million | |
| % | |
|
North America Hydrophobic Coatings Market Size
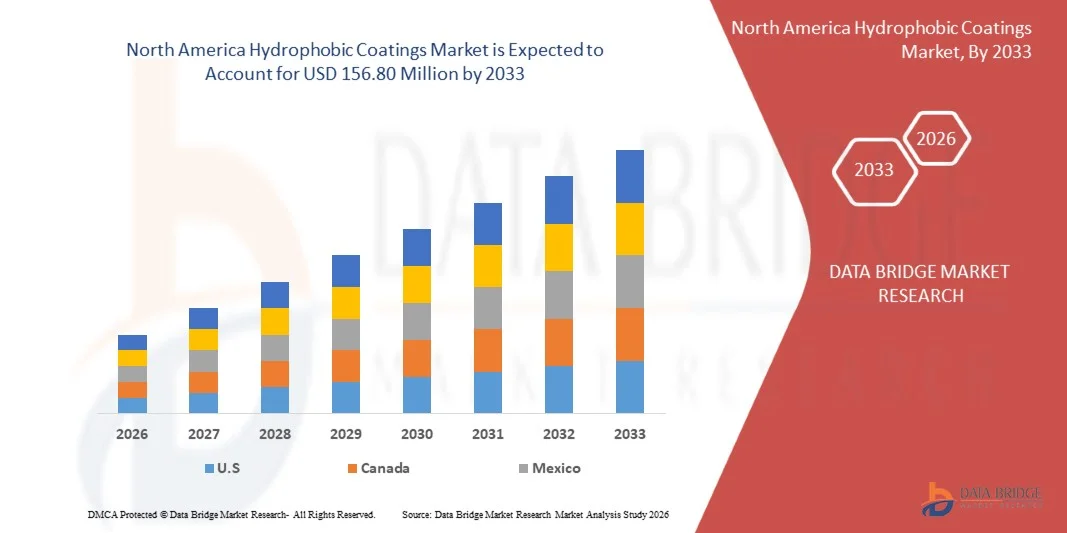
- The North America Hydrophobic Coatings Market size was valued at USD 96.18 million in 2025 and is expected to reach USD 156.80 million by 2033, at a CAGR of 6.3% during the forecast period
- The market growth is largely fueled by the increasing demand for protective coatings across industries such as automotive, electronics, construction, and aerospace, where surfaces require water repellency, corrosion resistance, and enhanced durability
- Furthermore, rising consumer and industrial focus on sustainability, hygiene, and low-maintenance surfaces is driving the adoption of advanced hydrophobic coatings, establishing them as essential solutions for high-performance and environmentally conscious applications. These converging factors are accelerating the uptake of hydrophobic coatings, thereby significantly boosting the market’s growth
North America Hydrophobic Coatings Market Analysis
- Hydrophobic coatings, providing water repellency, self-cleaning, anti-corrosion, and antimicrobial properties, are increasingly critical in enhancing the longevity, safety, and functionality of surfaces across multiple industrial and commercial applications
- The escalating demand for hydrophobic coatings is primarily fueled by technological advancements in coating materials, growing regulatory and environmental compliance requirements, and the rising need for multifunctional, low-maintenance, and high-performance surface treatments
- U.S. dominated the North America Hydrophobic Coatings Market in 2025, due to rising adoption of corrosion- and water-resistant coatings across automotive, electronics, aerospace, and construction sectors
- Canada is expected to be the fastest growing country in the North America Hydrophobic Coatings Market during the forecast period due to growing industrial modernization, expansion of automotive and electronics manufacturing, and increasing adoption of multifunctional protective coatings
- Polysiloxanes segment dominated the market with a market share of over 40% in 2025, due to their excellent water-repellent properties, chemical resistance, and adaptability across various substrates. These coatings are widely preferred in automotive, electronics, and construction applications for their long-term durability and ability to maintain surface aesthetics. Polysiloxanes also offer easy application and compatibility with multiple coating methods, enhancing operational efficiency. Their versatility in forming thin, transparent layers without altering the substrate’s appearance adds to their market preference. The segment’s established supply chains and wide industrial adoption further consolidate its dominance
Report Scope and North America Hydrophobic Coatings Market Segmentation
|
Attributes |
Hydrophobic Coatings Key Market Insights |
|
Segments Covered |
|
|
Countries Covered |
North America
|
|
Key Market Players |
|
|
Market Opportunities |
|
|
Value Added Data Infosets |
In addition to the insights on market scenarios such as market value, growth rate, segmentation, geographical coverage, and major players, the market reports curated by the Data Bridge Market Research also include import export analysis, production capacity overview, production consumption analysis, price trend analysis, climate change scenario, supply chain analysis, value chain analysis, raw material/consumables overview, vendor selection criteria, PESTLE Analysis, Porter Analysis, and regulatory framework. |
North America Hydrophobic Coatings Market Trends
“Growing Use of Self-Cleaning and Multifunctional Coatings”
- A significant trend in the North America Hydrophobic Coatings Market is the increasing application of self-cleaning and multifunctional coatings across industries, driven by the need for surfaces that resist water, dust, and contaminants while improving product durability. These coatings are enhancing performance in sectors such as automotive, electronics, and construction by reducing maintenance requirements and extending asset life
- For instance, companies such as P2i and 3M provide advanced hydrophobic coatings for consumer electronics and medical devices that prevent water ingress and surface fouling. Such solutions improve device longevity and user convenience in environments exposed to moisture and particulate matter
- The adoption of hydrophobic coatings in the automotive sector is accelerating as coatings applied to windshields, sensors, and body panels enhance visibility, safety, and corrosion resistance. This positions these coatings as essential for modern vehicle performance and passenger protection
- In electronics and wearable devices, hydrophobic coatings are being used to safeguard sensitive components from water and sweat damage. This trend is enabling manufacturers to deliver reliable, durable products that meet growing consumer expectations for ruggedized devices
- The construction and building materials sector is increasingly incorporating hydrophobic coatings on glass, concrete, and metal surfaces to prevent water damage and staining. This is shaping a preference for coatings that provide long-term protection while maintaining aesthetic appeal
- Industries focusing on energy and infrastructure are applying hydrophobic coatings to turbines, pipelines, and solar panels to improve efficiency and reduce maintenance costs. The rising incorporation of such coatings is reinforcing market growth and positioning them as critical enablers of operational longevity
North America Hydrophobic Coatings Market Dynamics
Driver
“Rising Demand for Corrosion- and Water-Resistant Coatings in Key Industries”
- The growing need for corrosion and water-resistant surfaces across automotive, electronics, and industrial equipment is driving the North America Hydrophobic Coatings Market. These coatings protect high-value assets from environmental degradation, extending operational life and reducing repair costs
- For instance, PPG Industries supplies specialized hydrophobic coatings for automotive and aerospace applications that enhance corrosion resistance under extreme conditions. These coatings enable manufacturers to deliver safer, longer-lasting products and meet stringent regulatory standards
- The electronics industry increasingly relies on hydrophobic coatings to prevent moisture-induced failures in sensitive devices such as smartphones, wearables, and medical equipment. This adoption is fostering innovation in nanocoatings and protective surface treatments
- Industrial machinery and heavy equipment benefit from hydrophobic coatings that reduce rust and surface wear, improving equipment uptime and productivity. This is driving adoption across sectors where operational continuity is critical
- The renewable energy sector is leveraging hydrophobic coatings for wind turbines, solar panels, and hydro equipment to improve efficiency and minimize water-related damage. The ongoing demand for resilient coatings is sustaining market expansion and positioning them as essential for asset protection
Restraint/Challenge
“High Cost and Complex Application of Advanced Coatings”
- The North America Hydrophobic Coatings Market faces challenges due to the high cost of advanced formulations and the intricate application processes required for optimal performance. These factors limit adoption, particularly in price-sensitive segments and small-scale industries
- For instance, companies such as P2i use precision vapor deposition techniques to apply nanocoatings on electronics, which require specialized equipment and skilled personnel. The complexity of these processes increases production expenses and restricts large-scale deployment
- Achieving uniform coating thickness and adhesion on diverse surfaces requires rigorous process control, further elevating operational costs and extending production timelines
- The reliance on high-purity chemicals and nanomaterials increases supply chain sensitivity and affects cost stability, creating challenges in maintaining competitive pricing
- Scaling hydrophobic coatings for industrial and consumer applications while ensuring consistent quality remains a key constraint. These challenges collectively compel manufacturers to invest in process optimization and cost reduction strategies to meet growing demand while maintaining performance standards
North America Hydrophobic Coatings Market Scope
The market is segmented on the basis of product, substrate type, coating layer, application method, function, grade, distribution channel, and end-user.
• By Product
On the basis of product, the North America Hydrophobic Coatings Market is segmented into polysiloxanes, fluoropolymers, fluoro-alkylsilanes, titanium dioxide, and others. The polysiloxanes segment dominated the market with the largest revenue share of over 40% in 2025, driven by their excellent water-repellent properties, chemical resistance, and adaptability across various substrates. These coatings are widely preferred in automotive, electronics, and construction applications for their long-term durability and ability to maintain surface aesthetics. Polysiloxanes also offer easy application and compatibility with multiple coating methods, enhancing operational efficiency. Their versatility in forming thin, transparent layers without altering the substrate’s appearance adds to their market preference. The segment’s established supply chains and wide industrial adoption further consolidate its dominance.
The fluoropolymers segment is expected to witness the fastest growth rate from 2026 to 2033, fueled by rising demand in advanced electronics, aerospace, and marine applications. For instance, Chemours has expanded its Teflon-based hydrophobic coatings portfolio to meet industrial requirements for high-performance, corrosion-resistant surfaces. Fluoropolymers provide superior chemical inertness and thermal stability, making them ideal for harsh environments. Their low surface energy properties enable effective anti-fouling and self-cleaning capabilities. Increasing investments in R&D for next-generation fluoropolymer coatings also drive rapid adoption. The segment benefits from a growing preference for high-end, long-lasting protective coatings across multiple industries.
• By Substrate Type
On the basis of substrate type, the North America Hydrophobic Coatings Market is segmented into metal, glass, polymer, ceramics, concrete, and textiles. The metal substrate segment dominated the market in 2025, owing to extensive use in automotive, aerospace, and construction industries requiring corrosion-resistant and water-repellent surfaces. Metal substrates benefit from enhanced durability and performance when coated with hydrophobic layers, prolonging the lifecycle of critical components. Industrial standards and regulations further favor metal coatings for protective applications. Their compatibility with various coating methods and ability to maintain structural integrity drive continued adoption. The segment’s established industrial presence contributes to its sustained market leadership.
The glass substrate segment is expected to witness the fastest growth rate from 2026 to 2033, driven by the rising adoption of smart windows, solar panels, and consumer electronics. For instance, PPG Industries has developed advanced hydrophobic coatings for architectural glass to enhance water repellency and self-cleaning properties. These coatings improve visibility and reduce maintenance costs in residential and commercial buildings. Glass substrates coated with hydrophobic layers also offer anti-fouling benefits for automotive windshields. Increased urbanization and smart building trends fuel demand for treated glass surfaces. The segment grows rapidly due to technological advancements and rising awareness of energy-efficient solutions.
• By Coating Layer
On the basis of coating layer, the North America Hydrophobic Coatings Market is segmented into single layer and multi-layer. The single-layer segment dominated the market in 2025, driven by cost-effectiveness, ease of application, and suitability for large-scale industrial deployment. Single-layer coatings are widely used in automotive, electronics, and building applications for surface protection without significantly altering substrate dimensions. Their simplicity ensures consistent performance and minimal production downtime. The segment benefits from established manufacturing practices and compatibility with conventional coating methods. Single-layer solutions also offer reliable hydrophobicity while reducing material waste. Their versatility across applications contributes to market dominance.
The multi-layer segment is expected to witness the fastest growth rate from 2026 to 2033, fueled by increasing demand for high-performance and multifunctional coatings. For instance, AkzoNobel has introduced multi-layer hydrophobic coatings for marine applications to combine anti-corrosion, anti-fouling, and self-cleaning functions. Multi-layer systems enhance durability, thermal resistance, and surface performance in challenging environments. The segment gains traction in aerospace, electronics, and industrial machinery sectors where advanced protection is essential. Rising R&D investments for multifunctional coatings accelerate adoption. Multi-layer solutions cater to the demand for high-end, engineered surface treatments.
• By Application Method
On the basis of application method, the North America Hydrophobic Coatings Market is segmented into dip coating, brushing, roll coating, spraying, and others. The spraying segment dominated the market in 2025, driven by its efficiency in coating complex geometries and large surfaces uniformly. Spraying offers precise control over coating thickness and reduces material wastage, making it suitable for automotive and construction applications. Industrial-scale adoption and mechanization enhance throughput and ensure consistent quality. Spraying methods also enable compatibility with multiple substrates and coating formulations. The segment’s established presence in commercial and industrial processes contributes to its market leadership.
The dip coating segment is expected to witness the fastest growth rate from 2026 to 2033, fueled by increasing use in small-scale manufacturing and specialized industrial applications. For instance, DuPont has leveraged dip coating techniques to apply hydrophobic layers on electronic components to enhance moisture resistance. Dip coating ensures uniform coverage and strong adhesion on intricate or irregularly shaped surfaces. The method is gaining popularity in textiles, electronics, and healthcare applications for its precision and efficiency. Rising demand for cost-effective and scalable coating processes supports growth. Dip coating also facilitates multifunctional coatings, driving faster adoption.
• By Function
On the basis of function, the North America Hydrophobic Coatings Market is segmented into anti-corrosion, anti-microbial, anti-fouling, anti-icing/wetting, self-cleaning, and others. The anti-corrosion segment dominated the market in 2025, driven by widespread industrial use in automotive, marine, oil & gas, and construction sectors requiring long-term protection against rust and degradation. Anti-corrosion coatings extend component lifespan and reduce maintenance costs, making them critical in infrastructure and industrial machinery. These coatings are preferred due to proven performance, regulatory compliance, and compatibility with diverse substrates. Anti-corrosion solutions also integrate well with other functional layers, enhancing overall surface protection. The segment’s established industrial relevance reinforces market dominance.
The self-cleaning segment is expected to witness the fastest growth rate from 2026 to 2033, fueled by rising adoption in architectural glass, solar panels, and consumer electronics. For instance, Saint-Gobain has developed self-cleaning hydrophobic coatings for building facades to reduce maintenance and water usage. These coatings leverage superhydrophobic properties to repel dirt and contaminants naturally. Rapid urbanization and smart building trends drive demand for low-maintenance surfaces. The segment also benefits from increasing awareness of sustainability and resource efficiency. Technological advancements in nano-coatings further accelerate market growth.
• By Grade
On the basis of grade, the North America Hydrophobic Coatings Market is segmented into food grade, industrial grade, and others. The industrial grade segment dominated the market in 2025, driven by extensive applications across automotive, aerospace, construction, and electronics industries requiring high-performance protective coatings. Industrial-grade hydrophobic coatings offer durability, thermal stability, and chemical resistance under harsh operating conditions. These coatings are widely preferred due to compliance with industrial standards and long-term operational benefits. The segment’s strong presence in manufacturing hubs and robust supply chains supports continued dominance. Industrial-grade coatings also enable integration with multifunctional layers, enhancing utility.
The food grade segment is expected to witness the fastest growth rate from 2026 to 2033, fueled by increasing demand in the food & beverage industry for hygienic, water-repellent surfaces. For instance, PPG has developed food-grade hydrophobic coatings to prevent bacterial growth and ease cleaning in processing equipment. These coatings comply with safety regulations and ensure product quality. Rising awareness of contamination control and hygiene standards in food processing drives adoption. The segment grows as manufacturers increasingly focus on efficiency and safety. Food-grade coatings also enhance equipment longevity while minimizing cleaning efforts.
• By Distribution Channel
On the basis of distribution channel, the North America Hydrophobic Coatings Market is segmented into offline and online. The offline segment dominated the market in 2025, driven by established supply chains, industrial procurement practices, and availability of technical support for coating products. Industrial buyers often prefer offline channels for bulk orders, consultation, and customized solutions. Offline distribution enables hands-on product evaluation and ensures adherence to quality standards. The segment benefits from strong relationships between manufacturers, distributors, and end-users across automotive, aerospace, and construction sectors. Offline channels continue to be a primary avenue for hydrophobic coatings due to trust and accessibility.
The online segment is expected to witness the fastest growth rate from 2026 to 2033, fueled by rising e-commerce adoption, B2B marketplaces, and digital procurement platforms. For instance, Alibaba has facilitated the online sale of specialty hydrophobic coatings for industrial and small-scale applications. Online channels provide convenience, wider reach, and comparative product insights for buyers. Increased digitalization and remote procurement drive adoption among SMEs and global buyers. The segment grows as manufacturers expand online visibility and direct-to-consumer initiatives. Online distribution enables faster market penetration and access to niche applications.
• By End-User
On the basis of end-user, the North America Hydrophobic Coatings Market is segmented into automotive, electronics, building & construction, marine, textiles, healthcare, aerospace, oil & gas, food & beverage, and others. The automotive segment dominated the market in 2025, driven by the rising demand for protective coatings on vehicles to enhance corrosion resistance, water repellency, and surface longevity. Hydrophobic coatings improve vehicle aesthetics, reduce maintenance, and support sustainable manufacturing practices. Automotive manufacturers increasingly integrate coatings into production processes for high-value components. The segment’s established industrial base and adoption across passenger, commercial, and electric vehicles reinforce dominance. Strong consumer preference for low-maintenance vehicles further supports the segment.
The electronics segment is expected to witness the fastest growth rate from 2026 to 2033, fueled by rising adoption of smartphones, wearables, and industrial electronics requiring moisture-resistant and self-cleaning surfaces. For instance, Samsung has incorporated hydrophobic coatings in mobile devices to enhance water resistance and reliability. The segment benefits from miniaturization trends, IoT adoption, and high-value electronic components requiring long-term durability. Increased consumer awareness of device protection drives rapid adoption. Electronics coatings also support energy-efficient and maintenance-free devices. The segment grows as manufacturers emphasize innovation and product differentiation.
North America Hydrophobic Coatings Market Regional Analysis
- U.S. dominated the North America Hydrophobic Coatings Market with the largest revenue share in 2025, driven by rising adoption of corrosion- and water-resistant coatings across automotive, electronics, aerospace, and construction sectors
- Increasing application of multifunctional and self-cleaning coatings, growing industrial modernization, and rapid adoption in high-value manufacturing and infrastructure projects support sustained market demand across commercial, residential, and industrial applications
- The strong presence of companies such as PPG Industries, Sherwin-Williams, and AkzoNobel, continuous investments in R&D for advanced nanocoatings, and strategic partnerships with OEMs reinforce the U.S. leadership position in the regional market. Rising focus on durability, operational efficiency, and sustainability initiatives is expected to maintain the country’s dominant role during the forecast period
Canada North America Hydrophobic Coatings Market Insight
Canada is projected to register the fastest CAGR in the North America Hydrophobic Coatings Market from 2026 to 2033, supported by growing industrial modernization, expansion of automotive and electronics manufacturing, and increasing adoption of multifunctional protective coatings. For instance, companies such as Sherwin-Williams and Axalta provide advanced hydrophobic coatings for industrial equipment, construction materials, and automotive components, while rising demand for corrosion- and water-resistant coatings in harsh weather conditions accelerates market growth. Expansion of industrial supply chains, integration with smart manufacturing platforms, and strong technology adoption rates enhance product accessibility, and increasing focus on sustainable coatings and high-performance surface protection positions Canada as the fastest-growing market in the region.
Mexico North America Hydrophobic Coatings Market Insight
Mexico is expected to grow steadily from 2026 to 2033, driven by rising industrial and commercial construction, expansion of the automotive and electronics sectors, and growing awareness of protective coatings. Companies such as PPG Industries and AkzoNobel strengthen domestic supply through technology localization, product customization, and partnerships with industrial manufacturers, while urbanization, industrial expansion, and foreign investment in infrastructure projects support consistent adoption of hydrophobic coatings. Alignment with North American performance standards, increasing application in water- and corrosion-prone environments, and gradual adoption in emerging industrial hubs contribute to stable market growth throughout the forecast period.
North America Hydrophobic Coatings Market Share
The hydrophobic coatings industry is primarily led by well-established companies, including:
- Nanofilm (U.S.)
- BASF SE (Germany)
- AccuCoat Inc. (U.S.)
- NeverWet, LLC (U.S.)
- Arkema (France)
- COTEC GmbH (Germany)
- P2i Ltd. (U.K.)
- PPG Industries, Inc. (U.S.)
- 3M (U.S.)
- Artekya Teknoloji (Turkey)
- The Sherwin-Williams Company (U.S.)
- Advanced Nanotech Lab (U.S.)
- AkzoNobel N.V. (Netherlands)
- Aculon Inc. (U.S.)
- UltraTech International, Inc. (U.S.)
- Nukote Coating Systems International (U.S.)
- Cytonix, LLC (U.S.)
Latest Developments in North America Hydrophobic Coatings Market
- In June 2024, NEI Corporation introduced NANOMYTE AM-100EC, a next-generation antimicrobial coating designed to offer superior protection against harmful microorganisms. This innovative product provides both antimicrobial functionality and easy-to-clean characteristics, making it highly suitable for applications in healthcare, food processing, and public hygiene environments. The AM-100EC coating is engineered to withstand rigorous cleaning protocols while maintaining its effectiveness, addressing the rising market demand for hygiene-focused and safe surfaces. The launch strengthens NEI’s position in the North America Hydrophobic Coatings Market by expanding offerings for antimicrobial and multi-functional coatings, reflecting the growing emphasis on public safety and regulatory compliance
- In March 2024, Mitsui Chemicals, Inc., in collaboration with German firm CADIS Engineering GmbH, introduced a digital printer designed to enhance advanced hydrophobic-coated automotive displays through its subsidiary COTEC GmbH. This innovation facilitates precise deposition of hydrophobic coatings on automotive electronic surfaces, improving water repellency, anti-fouling, and durability. The development is expected to accelerate adoption of hydrophobic coatings in automotive electronics, a fast-growing segment, by enabling more efficient and high-performance applications. It also reinforces the market trend toward integrating advanced coatings with digital manufacturing and smart vehicle technologies
- In February 2024, the Leibniz Institute for Plasma Science and Technology (INP) in Greifswald, Germany, developed a novel method for producing ultra-hydrophobic organosilicon polymer coatings. This approach provides an environmentally friendly alternative to per- and polyfluorinated compounds (PFAS), which are widely used but face increasing regulatory scrutiny. By reducing reliance on PFAS, this innovation addresses sustainability concerns in the North America Hydrophobic Coatings Market, promoting safer, eco-conscious solutions. The development supports market growth in industries prioritizing green coatings and positions organosilicon polymers as a key high-performance and regulatory-compliant solution
- In July 2023, BASF Automotive OEM Coatings achieved 100% renewable energy utilization across its China sites, a significant step toward the company’s net-zero transformation. Utilizing a combination of Renewable Direct Power Purchases, international renewable energy certificates, and other strategies, the initiative is projected to reduce carbon emissions by approximately 19,000 tons by the end of 2023. This milestone underscores BASF’s commitment to sustainability and resonates with the North America Hydrophobic Coatings Market, highlighting the growing expectation for environmentally responsible and low-carbon solutions. The initiative strengthens BASF’s competitive positioning by aligning product offerings with global sustainability trends
- In September 2022, BASF Coatings inaugurated a state-of-the-art research center for electrophoretic dip coating in Münster-Hiltrup, Germany, focused on enhancing hydrophobic coating technologies. The facility prioritizes safety, efficiency, and the simulation of customer-specific processes, advancing the company’s CathoGuard 800 e-coat technology. Known for protecting automotive surfaces against corrosion with low solvent content and reduced wastewater, this innovation offers both high performance and environmental benefits. The research center reinforces BASF’s market leadership in automotive hydrophobic coatings, enabling development of advanced, eco-friendly solutions that meet evolving industry standards and customer expectations
SKU-

- Interactive Data Analysis Dashboard
- Company Analysis Dashboard for high growth potential opportunities
- Research Analyst Access for customization & queries
- Competitor Analysis with Interactive dashboard
- Latest News, Updates & Trend analysis
- Harness the Power of Benchmark Analysis for Comprehensive Competitor Tracking
North America Hydrophobic Coatings Market, Supply Chain Analysis and Ecosystem Framework
To support market growth and help clients navigate the impact of geopolitical shifts, DBMR has integrated in-depth supply chain analysis into its North America Hydrophobic Coatings Market research reports. This addition empowers clients to respond effectively to global changes affecting their industries. The supply chain analysis section includes detailed insights such as North America Hydrophobic Coatings Market consumption and production by country, price trend analysis, the impact of tariffs and geopolitical developments, and import and export trends by country and HSN code. It also highlights major suppliers with data on production capacity and company profiles, as well as key importers and exporters. In addition to research, DBMR offers specialized supply chain consulting services backed by over a decade of experience, providing solutions like supplier discovery, supplier risk assessment, price trend analysis, impact evaluation of inflation and trade route changes, and comprehensive market trend analysis.
Data collection and base year analysis are done using data collection modules with large sample sizes. The stage includes obtaining market information or related data through various sources and strategies. It includes examining and planning all the data acquired from the past in advance. It likewise envelops the examination of information inconsistencies seen across different information sources. The market data is analysed and estimated using market statistical and coherent models. Also, market share analysis and key trend analysis are the major success factors in the market report. To know more, please request an analyst call or drop down your inquiry.
The key research methodology used by DBMR research team is data triangulation which involves data mining, analysis of the impact of data variables on the market and primary (industry expert) validation. Data models include Vendor Positioning Grid, Market Time Line Analysis, Market Overview and Guide, Company Positioning Grid, Patent Analysis, Pricing Analysis, Company Market Share Analysis, Standards of Measurement, Global versus Regional and Vendor Share Analysis. To know more about the research methodology, drop in an inquiry to speak to our industry experts.
Data Bridge Market Research is a leader in advanced formative research. We take pride in servicing our existing and new customers with data and analysis that match and suits their goal. The report can be customized to include price trend analysis of target brands understanding the market for additional countries (ask for the list of countries), clinical trial results data, literature review, refurbished market and product base analysis. Market analysis of target competitors can be analyzed from technology-based analysis to market portfolio strategies. We can add as many competitors that you require data about in the format and data style you are looking for. Our team of analysts can also provide you data in crude raw excel files pivot tables (Fact book) or can assist you in creating presentations from the data sets available in the report.


