
North America Industrial Machine Vision Market
Market Size in USD Billion
 USD
3.37 Billion
USD
7.01 Billion
2024
2032
USD
3.37 Billion
USD
7.01 Billion
2024
2032
| 2025 - 2032 | |
| USD 3.37 Billion | |
| USD 7.01 Billion | |
| % | |
|
Industrial Machine Vision Market Size
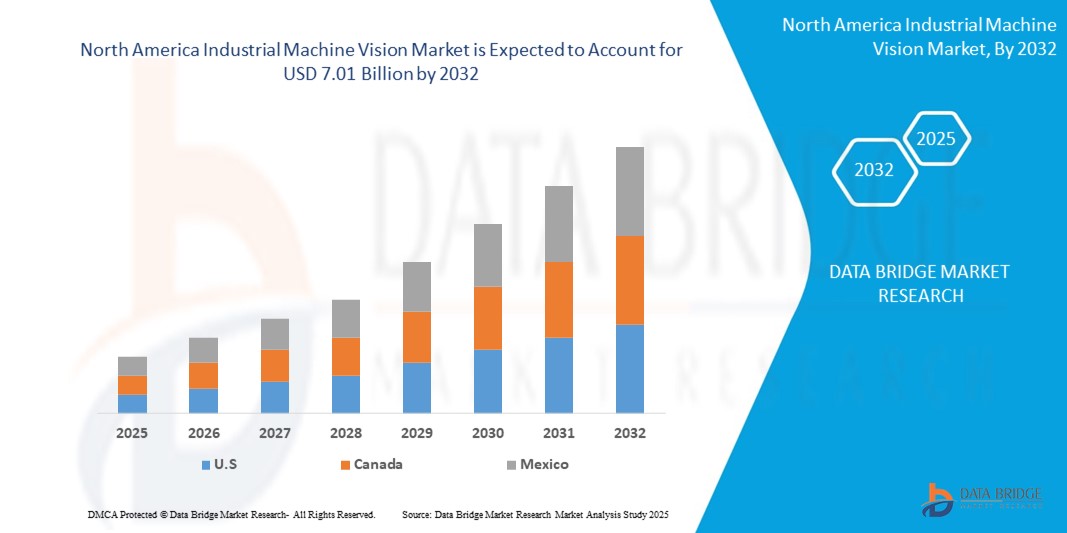
- The north america industrial machine vision market size was valued at USD 3.37 billion in 2024 and is expected to reach USD 7.01 billion by 2032, at a CAGR of 7.69% during the forecast period
- This growth is driven by factors such as the increasing adoption of automation across manufacturing industries, rising demand for quality inspection and defect detection, and technological advancements in machine learning and image processing
Industrial Machine Vision Market Analysis
- Industrial machine vision systems are critical technologies used in manufacturing environments for automated inspection, quality assurance, and robotic guidance, delivering precision and efficiency across various industries including automotive, electronics, pharmaceuticals, and food & beverage
- The demand for these systems is significantly driven by the rising need for automation, accuracy in defect detection, and advancements in AI-integrated imaging technologies
- The U.S. is the dominant country in the industrial machine vision market in North America, accounting for approximately 75% of the total regional market share. This dominance is attributed to the country's strong industrial base, early adoption of advanced manufacturing technologies, and significant investments in automation and AI-powered production lines
- Canada is the fastest-growing country in the industrial machine vision market. While it currently holds a smaller market share, estimated at around 20%, its growth is accelerating due to increased focus on advanced manufacturing, government initiatives to boost industrial productivity, and growing adoption of automation in the food processing and automotive sectors
- The automotive manufacturing segment is expected to dominate the industrial machine vision market with the largest share of 48.75% in 2025 due to its high demand for automation and quality control in production lines. As a critical component in modern automotive manufacturing, machine vision systems enhance precision in processes such as inspection, assembly, and part identification
Report Scope and Industrial Machine Vision Market Segmentation
|
Attributes |
Industrial Machine Vision Key Market Insights |
|
Segments Covered |
|
|
Countries Covered |
North America
Europe
Asia-Pacific
Middle East and Africa
South America
|
|
Key Market Players |
|
|
Market Opportunities |
|
|
Value Added Data Infosets |
In addition to the insights on market scenarios such as market value, growth rate, segmentation, geographical coverage, and major players, the market reports curated by the Data Bridge Market Research also include import export analysis, production capacity overview, production consumption analysis, price trend analysis, climate change scenario, supply chain analysis, value chain analysis, raw material/consumables overview, vendor selection criteria, PESTLE Analysis, Porter Analysis, and regulatory framework. |
Industrial Machine Vision Market Trends
“Integration of AI, Deep Learning and 3D Vision Systems in Industrial Automation”
- One prominent trend in the industrial machine vision market is the increasing integration of artificial intelligence (AI), deep learning algorithms, and 3D vision systems for real-time decision-making and precision automation in manufacturing processes
- These innovations significantly enhance machine vision performance by enabling systems to detect complex patterns, classify defects, and adapt to variable conditions that traditional rule-based systems may not handle effectively
- For instance, modern 3D vision technologies offer depth perception and volumetric analysis, enabling applications such as bin picking, robot guidance, and quality control of irregularly shaped objects with high accuracy
- These advancements are transforming the industrial automation landscape, reducing error rates, boosting production efficiency, and driving demand for smart vision systems in automotive, electronics, packaging, and logistics industries
Industrial Machine Vision Market Dynamics
Driver
“Growing Demand for Quality Inspection and Automation in Manufacturing”
- The rising emphasis on quality assurance, process optimization, and defect detection in modern manufacturing is significantly contributing to the increased demand for industrial machine vision systems
- As industries embrace automation, machine vision plays a critical role in enabling real-time inspection, precision measurement, and robotic guidance, ensuring consistency and reliability in production lines
- Industries such as automotive, electronics, pharmaceuticals, and food & beverage rely heavily on machine vision systems to meet stringent regulatory and quality standards
For instance,
- In October 2023, Cognex Corporation reported a surge in demand for vision systems in electronics and logistics sectors, driven by increasing consumer expectations for product reliability and fast order fulfillment
- As a result of this growing focus on automated quality control, there is a substantial increase in the adoption of industrial machine vision systems to enhance productivity, minimize errors, and reduce labor costs across global manufacturing ecosystems
Opportunity
“Advancing Industrial Machine Vision with Artificial Intelligence Integration”
- AI-powered industrial machine vision systems can enhance object detection, automation, and quality control in manufacturing processes, improving operational efficiency and precision
- AI algorithms can analyze real-time images to identify defects, monitor production lines, and track product quality, providing immediate feedback for manufacturers to address issues before they escalate
- AI-powered vision systems can also assist in predictive maintenance by analyzing equipment performance and identifying potential failures, reducing downtime and maintenance costs
For instance,
- In December 2024, a partnership between Siemens and an AI software company led to the integration of AI-powered industrial machine vision in Siemens’ manufacturing plants. The AI system provides real-time quality control by identifying defects on products and automatically adjusting production parameters to maintain consistent quality. This integration has resulted in a 15% increase in production efficiency and a 20% reduction in product defects
- The integration of AI in industrial machine vision systems can also lead to better resource utilization, faster production cycles, and reduced waste. By leveraging AI’s ability to analyze vast amounts of visual data, manufacturers can optimize production lines, reduce human error, and ensure better consistency in product quality
Restraint/Challenge
“High Equipment Costs Hindering Market Penetration”
- The high cost of industrial machine vision systems presents a significant barrier to their widespread adoption, particularly for small and medium-sized enterprises (SMEs) with limited budgets
- These advanced vision systems, which are essential for automating quality control and enhancing manufacturing processes, can range from tens of thousands to several hundred thousand dollars depending on the complexity and capabilities of the system
- The significant financial investment required for these systems can deter smaller companies from upgrading their equipment, leading to a reliance on manual inspection or outdated machine vision solutions
For instance,
- In October 2024, a report from the International Society of Automation (ISA) highlighted the challenge that small manufacturing companies face when considering the adoption of AI-powered industrial machine vision systems. The report emphasized that while large corporations can afford the high initial investment, many SMEs struggle with the cost of integrating AI-powered systems into their operations, slowing down the adoption rate across the sector
- As a result, this financial obstacle can lead to slower market growth and prevent broader adoption of advanced machine vision systems, particularly in cost-sensitive industries such as small-scale manufacturing or businesses in emerging markets
Industrial Machine Vision Market Scope
The market is segmented on the basis of component, product, type, deployment, applications, and end user.
|
Segmentation |
Sub-Segmentation |
|
By Component |
|
|
By Product |
|
|
By Type |
|
|
By Deployment |
|
|
By Applications |
|
|
By End-User |
|
In 2025, the automotive manufacturing segment is projected to dominate the market with the largest share in the end user segment
The automotive manufacturing segment is expected to dominate the industrial machine vision market with the largest share of 48.75% in 2025 due to its high demand for automation and quality control in production lines. As a critical component in modern automotive manufacturing, machine vision systems enhance precision in processes such as inspection, assembly, and part identification. The growing demand for vehicle safety features, coupled with advancements in machine vision technologies, drives the adoption of these systems in automotive production. Increased automation in automotive factories and the growing complexity of vehicle designs further contribute to the dominance of this segment in the industrial machine vision market.
The pattern recognition is expected to account for the largest share during the forecast period in application segments
In 2025, the pattern recognition segment is expected to dominate the industrial machine vision market with the largest market share of 50.62% due to its ability to enhance quality control, inspection, and automation in manufacturing processes. Pattern recognition systems are critical for identifying and classifying objects, defects, and anomalies in real-time, enabling manufacturers to maintain consistent product quality and optimize production efficiency. As industries demand higher levels of precision and speed, pattern recognition systems, especially in combination with AI and deep learning technologies, are driving market growth. The increasing complexity of products and the need for high-quality standards in sectors such as automotive, electronics, and pharmaceuticals further contribute to the dominance of pattern recognition-based machine vision systems in the market.
Industrial Machine Vision Market Regional Analysis
“U.S. Holds the Largest Share in the North America Industrial Machine Vision Market”
- The U.S. benefits from a strong industrial base and early adoption of smart manufacturing technologies, contributing to its dominance in the industrial machine vision market, holding approximately 75% of the North American market share
- The increasing deployment of automation and robotics in U.S. manufacturing facilities supports the integration of machine vision systems, enabling real-time quality control and operational efficiency
- The rising demand for high-speed and high-precision inspection in industries such as automotive, electronics, and pharmaceuticals drives significant adoption of IMV solutions in the U.S
- Robust investment in industrial R&D, along with strong presence of key market players and government support for advanced manufacturing initiatives, further strengthens the U.S.’s leadership in the industrial machine vision market
“Canada is Projected to Register the Highest CAGR in the North America Industrial Machine Vision Market”
- Canada’s increasing focus on industrial automation and smart manufacturing is driving the adoption of machine vision technologies, contributing to its expected market growth, with an estimated market share of 20% in North America
- Government-backed programs promoting the modernization of manufacturing infrastructure and the adoption of Industry 4.0 technologies are accelerating the integration of industrial machine vision systems in the country
- The growing demand for quality inspection, particularly in sectors like food processing, automotive, and pharmaceuticals, is fostering the deployment of machine vision solutions across Canada
- Continued investments by public and private sectors in automation technologies and advanced production systems are supporting the rapid expansion of industrial machine vision applications throughout Canada
Industrial Machine Vision Market Share
The market competitive landscape provides details by competitor. Details included are company overview, company financials, revenue generated, market potential, investment in research and development, new market initiatives, global presence, production sites and facilities, production capacities, company strengths and weaknesses, product launch, product width and breadth, application dominance. The above data points provided are only related to the companies' focus related to market.
The Major Market Leaders Operating in the Market Are:
- KEYENCE CORPORATION (Japan)
- OMRON Corporation (Japan)
- Sony Semiconductor Solutions Corporation (Japan)
- Cognex Corporation (U.S.)
- SICK AG (U.S.)
- Teledyne FLIR LLC (U.S.)
- NATIONAL INSTRUMENTS CORP. (U.S.)
- BASLER AG (Germany)
- ISRA VISION (Germany)
- Intel Corporation (U.S.)
- Texas Instruments Incorporated (U.S.)
- Cadence Design Systems, Inc. (U.S.)
- Automatic Identification Systems (UK) Limited (U.K.)
- MV ASIA Infomatrix Pte Ltd (Singapore)
- Ceva Inc. (U.S.)
- Soda Vision (Singapore),
- The Imaging Source, LLC (U.S.)
- Kalypso: A Rockwell Automation Business (U.S.)
- Qualitas Technologies (India)
- Integro Technologies Corp. (U.S.)
Latest Developments in North America Industrial Machine Vision Market
- In July 2024, OMRON Corporation introduced a software update for its FH Vision System and FHV7 Smart Camera, integrating Digimarc decoding technology to enhance digital product identification. This update enables high-speed packaging verification using digital watermarks, achieving over 2,000 parts per minute. The integration improves detection accuracy, processing speed, camera flexibility, redundancy, and inspection capabilities, reinforcing OMRON’s commitment to innovation in industrial automation. Designed for consumer goods manufacturers, this advancement enhances quality assurance and efficiency in production
- In On May 6, 2025, AMETEK announced its acquisition of FARO Technologies for approximately USD 920 million. FARO, a leader in 3D measurement and imaging solutions, recorded USD340 million in sales in 2024. This strategic move aims to expand AMETEK’s electronic instruments division, strengthening its presence in aerospace, medical, research, power, and industrial markets. The acquisition enhances AMETEK’s portfolio with precision manufacturing and digital reality solutions, complementing its existing Creaform business
- In April 2024, Cognex Corporation introduced the In-Sight L38 3D Vision System, the world’s first AI-powered 3D vision system designed for fast deployment and reliable inspections in manufacturing automation. This system integrates AI, 2D, and 3D vision technologies, generating unique projection images that simplify training and uncover features invisible to traditional 2D imaging. With embedded AI tools, it enhances inspection accuracy, measurement precision, and operational efficiency, setting new standards in industrial automation
- In May 2023, Teledyne DALSA began production of the Linea 2 4k Multispectral 5GigE line scan camera, a breakthrough in vision system technology. This advanced camera features a 5GigE interface, delivering five times the bandwidth of its predecessor, the Linea GigE camera. With high-resolution RGB and Near Infrared (NIR) multispectral imaging, it enhances defect detection, material grading, and optical sorting in industrial applications. The quadlinear CMOS sensor ensures minimal spectral crosstalk, improving inspection accuracy
SKU-

- Interactive Data Analysis Dashboard
- Company Analysis Dashboard for high growth potential opportunities
- Research Analyst Access for customization & queries
- Competitor Analysis with Interactive dashboard
- Latest News, Updates & Trend analysis
- Harness the Power of Benchmark Analysis for Comprehensive Competitor Tracking
North America Industrial Machine Vision Market, Supply Chain Analysis and Ecosystem Framework
To support market growth and help clients navigate the impact of geopolitical shifts, DBMR has integrated in-depth supply chain analysis into its North America Industrial Machine Vision Market research reports. This addition empowers clients to respond effectively to global changes affecting their industries. The supply chain analysis section includes detailed insights such as North America Industrial Machine Vision Market consumption and production by country, price trend analysis, the impact of tariffs and geopolitical developments, and import and export trends by country and HSN code. It also highlights major suppliers with data on production capacity and company profiles, as well as key importers and exporters. In addition to research, DBMR offers specialized supply chain consulting services backed by over a decade of experience, providing solutions like supplier discovery, supplier risk assessment, price trend analysis, impact evaluation of inflation and trade route changes, and comprehensive market trend analysis.
Data collection and base year analysis are done using data collection modules with large sample sizes. The stage includes obtaining market information or related data through various sources and strategies. It includes examining and planning all the data acquired from the past in advance. It likewise envelops the examination of information inconsistencies seen across different information sources. The market data is analysed and estimated using market statistical and coherent models. Also, market share analysis and key trend analysis are the major success factors in the market report. To know more, please request an analyst call or drop down your inquiry.
The key research methodology used by DBMR research team is data triangulation which involves data mining, analysis of the impact of data variables on the market and primary (industry expert) validation. Data models include Vendor Positioning Grid, Market Time Line Analysis, Market Overview and Guide, Company Positioning Grid, Patent Analysis, Pricing Analysis, Company Market Share Analysis, Standards of Measurement, Global versus Regional and Vendor Share Analysis. To know more about the research methodology, drop in an inquiry to speak to our industry experts.
Data Bridge Market Research is a leader in advanced formative research. We take pride in servicing our existing and new customers with data and analysis that match and suits their goal. The report can be customized to include price trend analysis of target brands understanding the market for additional countries (ask for the list of countries), clinical trial results data, literature review, refurbished market and product base analysis. Market analysis of target competitors can be analyzed from technology-based analysis to market portfolio strategies. We can add as many competitors that you require data about in the format and data style you are looking for. Our team of analysts can also provide you data in crude raw excel files pivot tables (Fact book) or can assist you in creating presentations from the data sets available in the report.


