
North America Japanese Restaurant Market
Market Size in USD Billion
 USD
5.11 Billion
USD
6.59 Billion
2024
2032
USD
5.11 Billion
USD
6.59 Billion
2024
2032
| 2025 - 2032 | |
| USD 5.11 Billion | |
| USD 6.59 Billion | |
| % | |
Japanese Restaurant Market Size
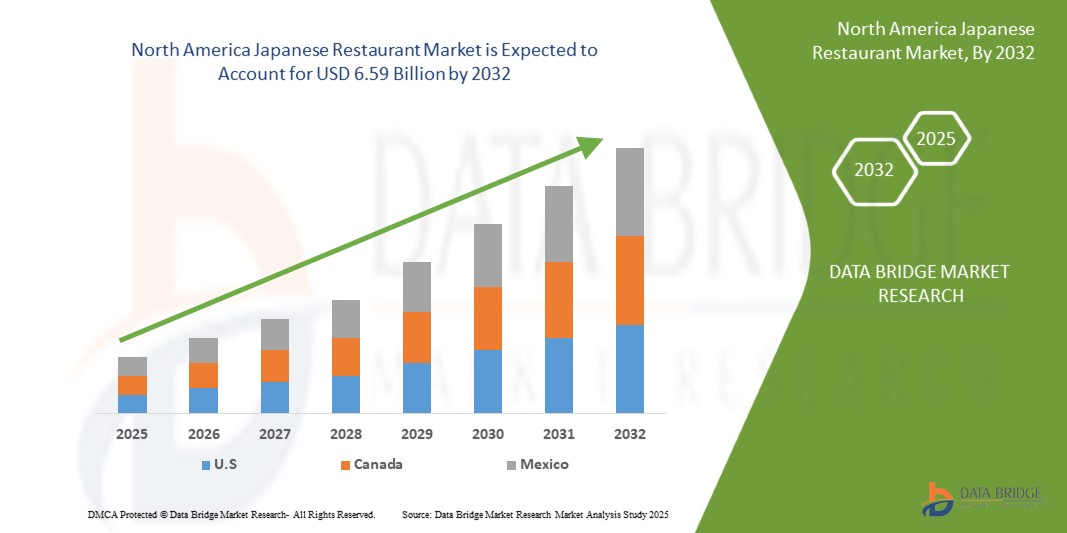
- The North America Japanese restaurant market was valued at USD 5.11 billion in 2024 and is expected to reach USD 6.59 billion by 2032
- During the forecast period of 2025 to 2032 the market is likely to grow at a CAGR of 3.28%, primarily driven by the increase in popularity of the dish sushi.
- This growth is driven by factors such as rising North America popularity of Japanese cuisine, health-conscious consumers, sushi demand, cultural influence, urbanization, convenience, innovation, and tourism.
Japanese Restaurant Market Analysis
- The Japanese restaurant market is growing globally, driven by increasing demand for sushi and traditional cuisine. Health-conscious consumers favor Japanese food for its fresh ingredients, lean proteins, and omega-3-rich seafood. Urbanization and fast-paced lifestyles boost demand for convenient, nutritious dining options
- Media exposure and fusion cuisine innovations further expand market appeal. However, challenges include high ingredient costs, market saturation, and balancing authenticity with localization
- The future remains promising, with growth fueled by digital food delivery, sustainability efforts, and evolving consumer preferences. Japanese restaurants continue to thrive, offering diverse dining experiences from quick-service sushi bars to high-end omakase
- The demand for these restaurants is significantly driven by the increasing awareness of health benefits related to Japanese food. Over half of the global demand is driven by the need for Japanese cuisine, recognized as a UNESCO intangible cultural heritage
- For instance, In 2024, World Metrics reported that the global sushi market has experienced substantial growth, with the industry valued at over USD 27 billion. This surge highlights the increasing popularity of sushi, driving a significant rise in the number of Japanese restaurants and contributing to the expansion of Japanese dining experiences worldwide
- Globally, Japanese cuisine ranks as the second most popular, following Italian cuisine. In terms of restaurant numbers, Chinese cuisine leads, with Italian and Indian cuisines following. However, Japan boasts the highest number of top-rated restaurants, with Tokyo having the most three-starred Michelin establishments worldwide
Report Scope and Japanese Restaurant Market Segmentation
|
Attributes |
Japanese Restaurant Key Market Insights |
|
Segments Covered |
|
|
Countries Covered |
North America
|
|
Key Market Players |
|
|
Market Opportunities |
|
|
Value Added Data Infosets |
In addition to the insights on market scenarios such as market value, growth rate, segmentation, geographical coverage, and major players, the market reports curated by the Data Bridge Market Research also include import export analysis, production capacity overview, production consumption analysis, price trend analysis, climate change scenario, supply chain analysis, value chain analysis, raw material/consumables overview, vendor selection criteria, PESTLE Analysis, Porter Analysis, and regulatory framework. |
Japanese Restaurant Market Trends
“Increasing Awareness Of Health Benefits”
- One prominent trend in the global Japanese restaurant market is the increasing awareness of health benefits
- The industry is experiencing significant growth, driven by the increasing awareness of the health benefits associated with Japanese cuisine. Renowned for its emphasis on fresh, high-quality ingredients and balanced nutrition, Japanese cuisine aligns well with the growing global focus on health and wellness
- For instance, In February 2019, Kobe Steakhouse highlighted that the Japanese diet’s health benefits—including reduced cancer risk, lower heart disease rates, and high protein content—are increasingly recognized. This growing awareness is driving global interest in Japanese cuisine, emphasizing its role in promoting longevity and overall well-being, and contributing to market expansion
- Traditional dishes such as sushi, sashimi, and miso soup are not only flavorful but also low in fat and high in essential nutrients
- The increasing awareness of the health benefits associated with Japanese cuisine is driving the global Japanese restaurant market by aligning with the growing consumer demand for nutritious and balanced dining options. This trend is fostering greater international interest in Japanese food, expanding the market across the globe, and enhancing the overall appeal of Japanese restaurants worldwide
Japanese Restaurant Market Dynamics
Driver
“The Increase In Popularity Of The Dish Sushi”
- The rising popularity of sushi significantly boosts the Japanese restaurant market. Its health benefits, including fresh ingredients and high protein content, appeal to health-conscious consumers seeking nutritious alternatives
- Sushi’s versatility, with options like vegetarian and gluten-free variations, enhances its global appeal
- Innovative rolls and fusion dishes attract diverse audiences, expanding market reach. Additionally, mainstream acceptance through media exposure and widespread availability in global cities has solidified sushi as a staple in modern food culture, driving demand for Japanese restaurants worldwide
For instance,
- In 2024, World Metrics reported that the global sushi market has experienced substantial growth, with the industry valued at over USD 27 billion. This surge highlights the increasing popularity of sushi, driving a significant rise in the number of Japanese restaurants and contributing to the expansion of Japanese dining experiences worldwide
- In 2024, a blog published on Elle India reported that the popularity of sushi in India has surged, with Japanese restaurants across major cities experiencing increased investment. The growing trend reflects a broader acceptance and enthusiasm for sushi in the Indian region
- In April 2024, an article published on Indian Retailer reported that sushi is gaining prominence in India as consumer tastes evolve and health-conscious dining trends rise. The increasing popularity of sushi in India is driving the growth of Japanese restaurants, with new establishments and sushi offerings becoming more prevalent across major cities like Mumbai, Delhi, Bengaluru, and others. This shift reflects a broader global trend where sushi's appeal as a fresh, nutritious option aligns with changing dietary preferences
- The surge in sushi’s popularity is a major driver for the global Japanese restaurant market. Its alignment with health trends, adaptability to diverse dietary needs, and mainstream acceptance contribute to its growing appeal. As consumers increasingly seek out nutritious, versatile, and trendy dining options, sushi continues to play a pivotal role in expanding the reach and success of Japanese dining establishments globally
Opportunity
“Innovation In Menu Offerings”
- Menu innovation presents a key growth opportunity for Japanese restaurants, allowing them to attract new customers and adapt to evolving dining trends. By modernizing traditional dishes, such as offering vegetarian sushi, fusion rolls, and sushi burritos, restaurants can cater to diverse dietary preferences
- In addition, integrating global culinary influences enhances creativity, blending flavors and techniques to create unique offerings. This adaptability helps Japanese restaurants differentiate themselves, expand market appeal, and meet the demands of contemporary consumers seeking innovative dining experiences
For instance,
- The Economic Times reported that the Japanese restaurant market saw significant innovation with the introduction of sushi doughnuts and sushi burritos. These novel creations, which blend traditional sushi ingredients with new formats, such as a doughnut-shaped sushi or a burrito-style wrap, reflect a growing trend towards inventive menu offerings
- According to Japan Travel, Narisawa in Tokyo exemplifies innovation in menu offerings within the Japanese restaurant market. Renowned for its unique approach to Japanese cuisine, Narisawa integrates cutting-edge culinary techniques and local, seasonal ingredients to create a dining experience that pushes the boundaries of traditional Japanese food
- Innovation in menu offerings provides substantial opportunities by adapting traditional dishes, integrating global trends, catering to health-conscious consumers, leveraging technology, and embracing sustainability. Japanese restaurants can enhance their appeal, differentiate themselves in a competitive market, and drive continued growth.
Restraint/Challenge
“High Costs Of Ingredients For Japanese Cuisine”
- Japanese cuisine relies on premium ingredients like sushi-grade fish and rare vegetables, which are costly and subject to price fluctuations
- These high costs impact restaurant pricing, potentially reducing consumer demand, especially for smaller establishments that struggle to absorb expenses
- Price volatility can lead to inconsistent menu pricing and availability, affecting customer perceptions of affordability. Rising costs may also limit menu diversity, reducing appeal to a broader audience
- As a result, maintaining quality while managing ingredient expenses is a key challenge for Japanese restaurants, influencing both operational sustainability and consumer behavior
For instance,
- In January 2024, an article published on SeafoodSource reported that the record-high price for the first bluefin tuna of the year, auctioned for a staggering USD 3.1 million, highlights the escalating costs of premium ingredients in Japanese cuisine. As bluefin tuna is a key ingredient in high-end sushi and sashimi, the increased cost underscores the financial challenges faced by restaurants that rely on such premium components to attract and retain customers
- In August 2023, a blog published on Hanaya FM reported that the high costs associated with sourcing premium ingredients, such as fresh seafood and high-quality rice, significantly impact the pricing of sushi and other Japanese dishes. The need for top-notch ingredients to ensure the authenticity and quality of Japanese cuisine results in elevated costs, which are often reflected in menu prices. This factor contributes to the overall expense of dining at Japanese restaurants, influencing both the consumer market and the operational strategies of Japanese eateries worldwide
- The high costs of ingredients pose a significant restraint by increasing operational expenses and affecting pricing strategies. The challenge of managing premium ingredient costs can particularly impact smaller establishments, lead to menu price fluctuations, and influence consumer perceptions
Japanese Restaurant Market Scope
The market is segmented on the basis of cuisine type, service type, restaurant category, restaurant model, and sales channel.
|
Segmentation |
Sub-Segmentation |
|
By Application |
|
|
|
|
By Restaurant Category |
|
|
By Restaurant Model
|
|
|
By Sales Channel |
|
Japanese Restaurant Market Regional Analysis
“U.S. is the Dominant Country in the Japanese Restaurant Market”
- U.S. dominates the Japanese restaurant market, driven by increasing awareness of health benefits related to Japanese food drives, and strong presence of key market players
- U.S. holds a significant share due to culinary authenticity, high-quality ingredients, strong domestic demand, tourism, and North America cultural influence.
- The high-quality ingredients, strong demand, tourism, skilled chefs, innovation, seafood supply, Michelin restaurants, and North America influence.
- In addition, the increasing culinary authenticity, premium ingredients, strong domestic demand, tourism, skilled chefs, innovation, Michelin-starred restaurants, seafood supply, government support, food technology, North America influence, rich heritage, efficient logistics, and dining culture is driving the market growth.
“U.S. is Projected to Register the Highest Growth Rate”
- U.S. is expected to witness the highest growth rate in the Japanese restaurant market, driven by the increase in popularity of the dish sushi
- U.S., dominates due to culinary authenticity, premium ingredients, strong domestic demand, tourism, Michelin-starred restaurants, skilled chefs, innovation, seafood supply, government support, advanced food technology, rich heritage, efficient logistics, high dining culture, and North America influence.
Japanese Restaurant Market Share
The market competitive landscape provides details by competitor. Details included are company overview, company financials, revenue generated, market potential, investment in research and development, new market initiatives, North America presence, production sites and facilities, production capacities, company strengths and weaknesses, product launch, product width and breadth, application dominance. The above data points provided are only related to the companies' focus related to market.
The Major Market Leaders Operating in the Market Are:
- KATSU-YA GROUP, INC (U.S.)
- Wokcano Asian Restaurant & Bar. (U.S.)
- 893 Ryōtei Berlin (Germany)
- Chiba Japanese Restaurant (U.S.)
- Tsujita Artisan Noodle. (Japan)
- Florilège (Japan)
- KAITEN ZUSHI (U.S.)
- Kura Sushi USA (U.S.)
- My Concierge Japan (Japan)
- NARISAWA (Japan)
- RE&S (Singapore)
- SAZENKA (Japan)
- SEZANNE (Japan)
- Sushi A Go Go (U.S.)
- Sushi Den (U.S.)
- Sushi Gen Enterprises. (U.S.)
- Sushi Nozawa Group (US.)
- Sushiya (India)
- Takami Sushi & Robata Restaurant (U.S.)
- Tatsu Ramen LLC. (U.S.)
- Yamashiro Hollywood (U.S.)
Latest Developments in North America Japanese Restaurant Market
- In May 2024, Sushi Den has announced the relaunch of its highly anticipated lunch service. In addition, OTOTO, a latest addition to the Sushi Den and Izakaya Den, has launched a delightful Sunday Brunch starting from 11:00 AM to 2:00 PM. The company look forward to sharing this new chapter with their customer’s and enjoying the season’s fresh offerings together
- In June 2024, Sézanne at Four Seasons Hotel Tokyo at Marunouchi has been ranked 15 in the World's 50 Best Restaurants 2024 and named Best Restaurant in Asia. Led by Chef Daniel Calvert, it showcases French culinary excellence with Japanese ingredients, offering an elegant, seasonally inspired dining experience in a sophisticated setting
- In May 2024, Southern Capital Group and RE&S Holdings Limited jointly announced the acquisition of the company through a Scheme of Arrangement. This strategic move is part of a planned reorganization that will see Southern Capital Group taking ownership of RE&S Holdings. The acquisition was agreed upon by both parties, and the Scheme of Arrangement will facilitate a smooth transition, ensuring that the company continues to operate efficiently under new ownership. This development marks a significant milestone for RE&S Holdings as it embarks on a new chapter under Southern Capital Group’s leadership
- In August 2024, Kura Sushi USA has teamed up with Toei Animation to celebrate “One Piece” with a special Bikkura Pon promotion from Aug. 2 to Sept. 30, 2024. The collaboration features exclusive One Piece prizes, including figurines and can badges, and limited-time menu items like Gum-Gum Fruit Ice Cream Monaka and Jumbo Spicy Roast Beef Roll. Guests can also purchase a themed bottle for USD 16.00 with free soft drink refills. Kura Sushi Rewards Members spending USD 80 or more from Aug. 2-8 will receive a One Piece Cooling Towel. All prizes come in eco-friendly, biodegradable capsules
- In May 2024, Kura Sushi USA launched a Dragon Ball Super-themed Bikkura Pon promotion from May 1 to June 30, 2024. The collaboration featured exclusive Dragon Ball Super prizes, including limited-edition acrylic stand keychains and enamel pins. A rare glow-in-the-dark Goku keychain was available in limited quantities. From June 5-9, Rewards Members received a Dragon Ball Super graphic tee with a USD 70 in-restaurant spend. A Dragon Ball Super Bottle Set with a straw and lanyard was available for USD 16.00 starting June 1. The Bikkura Pon Prize System rewarded diners with Dragon Ball Super-themed prizes for every 15 plates enjoyed
SKU-

- Interactive Data Analysis Dashboard
- Company Analysis Dashboard for high growth potential opportunities
- Research Analyst Access for customization & queries
- Competitor Analysis with Interactive dashboard
- Latest News, Updates & Trend analysis
- Harness the Power of Benchmark Analysis for Comprehensive Competitor Tracking
Table of Content
1 INTRODUCTION
1.1 OBJECTIVES OF THE STUDY
1.2 MARKET DEFINITION
1.3 OVERVIEW
1.4 LIMITATIONS
1.5 MARKETS COVERED
2 MARKET SEGMENTATION
2.1 MARKETS COVERED
2.2 GEOGRAPHICAL SCOPE
2.3 YEARS CONSIDERED FOR THE STUDY
2.4 CURRENCY AND PRICING
2.5 DBMR TRIPOD DATA VALIDATION MODEL
2.6 MULTIVARIATE MODELING
2.7 PRIMARY INTERVIEWS WITH KEY OPINION LEADERS
2.8 DBMR MARKET POSITION GRID
2.9 DBMR VENDOR SHARE ANALYSIS
2.1 SECONDARY SOURCES
2.11 ASSUMPTIONS
3 EXECUTIVE SUMMARY
4 PREMIUM INSIGHTS
4.1 SUPPLY CHAIN ANALYSIS
4.1.1 RAW MATERIAL SOURCING
4.1.2 PROCESSING & PACKAGING
4.1.3 LOGISTICS & DISTRIBUTION
4.1.4 RESTAURANT OPERATIONS
4.1.5 IMPORTANCE OF LOGISTICS SERVICE PROVIDERS FOR THE NORTH AMERICA JAPANESE RESTAURANT MARKET
4.2 VENDOR SELECTION CRITERIA
4.2.1 INGREDIENT QUALITY AND AUTHENTICITY
4.2.2 RELIABILITY AND SUPPLY CHAIN EFFICIENCY
4.2.3 COMPLIANCE WITH FOOD SAFETY AND REGULATORY STANDARDS
4.2.4 COST COMPETITIVENESS AND PRICING STABILITY
4.2.5 SUSTAINABILITY AND ETHICAL SOURCING PRACTICES
4.2.6 TECHNOLOGICAL INTEGRATION AND ORDERING EFFICIENCY
4.3 FACTORS INFLUENCING PURCHASING DECISION OF END USERS IN THE NORTH AMERICA JAPANESE RESTAURANT MARKET
4.3.1 AUTHENTICITY AND CULTURAL EXPERIENCE
4.3.2 QUALITY AND FRESHNESS OF INGREDIENTS
4.3.3 MENU VARIETY AND DIETARY PREFERENCES
4.3.4 PRICING AND VALUE FOR MONEY
4.3.5 AMBIENCE AND RESTAURANT DESIGN
4.3.6 BRAND REPUTATION AND REVIEWS
4.3.7 CONVENIENCE AND ACCESSIBILITY
4.3.8 CUSTOMER SERVICE AND HOSPITALITY
4.3.9 HEALTH AND SAFETY CONCERNS
4.3.10 CULTURAL TRENDS AND POPULARITY
4.3.11 CONCLUSION
4.4 GROWTH STRATEGIES ADOPTED BY KEY MARKET PLAYERS IN THE NORTH AMERICA JAPANESE RESTAURANT MARKET
4.4.1 EXPANSION THROUGH FRANCHISING
4.4.2 MENU INNOVATION AND DIVERSIFICATION
4.4.3 DIGITAL TRANSFORMATION AND ONLINE PRESENCE
4.4.4 STRATEGIC PARTNERSHIPS AND COLLABORATIONS
4.4.5 SUSTAINABLE PRACTICES AND ETHICAL SOURCING
4.4.6 PREMIUMIZATION AND FINE DINING CONCEPTS
4.4.7 GEOGRAPHIC EXPANSION INTO EMERGING MARKETS
4.4.8 LOYALTY PROGRAMS AND CUSTOMER ENGAGEMENT
4.4.9 TECHNOLOGY-DRIVEN EFFICIENCY
4.4.10 HEALTH AND WELLNESS-FOCUSED OFFERINGS
4.4.11 CONCLUSION
4.5 INDUSTRY TRENDS AND FUTURE PERSPECTIVE OF THE NORTH AMERICA JAPANESE RESTAURANT MARKET
4.5.1 RISING POPULARITY OF AUTHENTIC AND REGIONAL JAPANESE CUISINE
4.5.2 GROWTH OF FAST-CASUAL AND TAKEAWAY CONCEPTS
4.5.3 INCREASED FOCUS ON SUSTAINABILITY AND ETHICAL SOURCING
4.5.4 DIGITAL TRANSFORMATION AND SMART RESTAURANT TECHNOLOGY
4.5.5 EXPANSION INTO EMERGING MARKETS
4.5.6 HEALTH AND WELLNESS-DRIVEN MENUS
4.5.7 INFLUENCE OF JAPANESE POP CULTURE ON FOOD TRENDS
4.5.8 PERSONALIZATION AND CUSTOMIZATION
4.5.9 ALCOHOL PAIRING AND SAKE CULTURE EXPANSION
4.5.10 FUTURE OUTLOOK: THE EVOLUTION OF THE JAPANESE RESTAURANT MARKET
4.5.11 CONCLUSION
4.6 TECHNOLOGICAL ADVANCEMENT OF THE NORTH AMERICA JAPANESE RESTAURANT MARKET
4.6.1 AUTOMATION AND ROBOTICS
4.6.2 AI AND SMART ORDERING SYSTEMS
4.6.3 DIGITAL PAYMENT AND CONTACTLESS SOLUTIONS
4.6.4 SMART KITCHENS AND IOT INTEGRATION
4.6.5 SUSTAINABLE AND ECO-FRIENDLY INNOVATIONS
4.6.6 CONCLUSION
5 REGULATION COVERAGE
6 MARKET OVERVIEW
6.1 DRIVERS
6.1.1 INCREASING AWARENESS OF HEALTH BENEFITS
6.1.2 THE INCREASE IN POPULARITY OF THE DISH SUSHI
6.1.3 JAPANESE CUISINE, RECOGNIZED AS A UNESCO INTANGIBLE CULTURAL HERITAGE, INCREASES THE NORTH AMERICA CONSUMER INTEREST FOR JAPANESE CUISINE
6.2 RESTRAINTS
6.2.1 FOOD CONTAMINATION, RISKING THE SAFETY, AND QUALITY OF THE PRODUCT
6.2.2 HIGH COSTS OF INGREDIENTS FOR JAPANESE CUISINE
6.3 OPPORTUNITIES
6.3.1 INNOVATION IN MENU OFFERINGS
6.3.2 COLLABORATION WITH LOCAL CULTURAL EVENTS AND FESTIVALS
6.4 CHALLENGES
6.4.1 INTENSE COMPETITION FROM ITALIAN AND CHINESE CUISINES
6.4.2 MAINTAINING AUTHENTICITY AND LABOR SHORTAGES
7 NORTH AMERICA JAPANESE RESTAURANT MARKET, BY CUISINE TYPE
7.1 OVERVIEW
7.2 TRADITIONAL JAPANESE CUISINE
7.2.1 SUSHI
7.2.2 RAMEN
7.2.3 TEMPURA
7.2.4 SASHIMI
7.2.5 KAISEKI
7.2.6 UDON/SOBA
7.2.7 OTHERS
7.3 SPECIALTY JAPANESE CUISINE
7.4 MODERN JAPANESE CUISINE
8 NORTH AMERICA JAPANESE RESTAURANT MARKET, BY SERVICE TYPE
8.1 OVERVIEW
8.2 QUICK SERVICE RESTAURANTS (QSR)
8.3 FULL SERVICE RESTAURANTS
8.4 TAKE-OUT COUNTERS/OUTLETS
9 NORTH AMERICA JAPANESE RESTAURANT MARKET, BY RESTAURANT CATEGORY
9.1 OVERVIEW
9.2 STANDALONE RESTAURANT
9.3 CHAIN/FRANCHISE MODEL
10 NORTH AMERICA JAPANESE RESTAURANT MARKET, BY RESTAURANT MODEL
10.1 OVERVIEW
10.2 TAKEAWAY
10.3 HOME DELIVERY
10.4 DINE-IN
11 NORTH AMERICA JAPANESE RESTAURANT MARKET, BY SALES CHANNEL
11.1 OVERVIEW
11.2 PHYSICAL OUTLETS
11.3 DELIVERY ONLINE RESTAURANTS/GHOST KITCHEN
12 NORTH AMERICA JAPANESE RESTAURANT MARKET, BY REGION
12.1 NORTH AMERICA
12.1.1 U.S.
12.1.2 CANADA
12.1.3 MEXICO
13 NORTH AMERICA JAPANESE RESTAURANT MARKET: COMPANY LANDSCAPE
13.1 COMPANY SHARE ANALYSIS: NORTH AMERICA
14 SWOT ANALYSIS
15 COMPANY PROFILES
15.1 KATSU-YA GROUP, INC.
15.1.1 COMPANY SNAPSHOT
15.1.2 COMPANY SHARE ANALYSIS
15.1.3 PRODUCT PORTFOLIO
15.1.4 RECENT DEVELOPMENTS
15.2 WOKCANO ASIAN RESTAURANT & BAR.
15.2.1 COMPANY SNAPSHOT
15.2.2 COMPANY SHARE ANALYSIS
15.2.3 PRODUCT PORTFOLIO
15.2.4 RECENT DEVELOPMENTS
15.3 893 RYŌTEI BERLIN
15.3.1 COMPANY SNAPSHOT
15.3.2 COMPANY SHARE ANALYSIS
15.3.3 PRODUCT PORTFOLIO
15.3.4 RECENT DEVELOPMENT
15.4 CHIBA JAPANESE RESTAURANT
15.4.1 COMPANY SNAPSHOT
15.4.2 COMPANY SHARE ANALYSIS
15.4.3 PRODUCT PORTFOLIO
15.4.4 RECENT DEVELOPMENT
15.5 TSUJITA ARTISAN NOODLE.
15.5.1 COMPANY SNAPSHOT
15.5.2 COMPANY SHARE ANALYSIS
15.5.3 PRODUCT PORTFOLIO
15.5.4 RECENT DEVELOPMENT
15.6 FLORILÈGE
15.6.1 COMPANY SNAPSHOT
15.6.2 PRODUCT PORTFOLIO
15.6.3 RECENT DEVELOPMENT
15.7 KAITEN ZUSHI
15.7.1 COMPANY SNAPSHOT
15.7.2 PRODUCT PORTFOLIO
15.7.3 RECENT DEVELOPMENT
15.8 KURA SUSHI USA
15.8.1 COMPANY SNAPSHOT
15.8.2 REVENUE ANALYSIS
15.8.3 PRODUCT PORTFOLIO
15.8.4 RECENT DEVELOPMENTS
15.9 MY CONCIERGE JAPAN
15.9.1 COMPANY SNAPSHOT
15.9.2 PRODUCT PORTFOLIO
15.9.3 RECENT DEVELOPMENT
15.1 NARISAWA
15.10.1 COMPANY SNAPSHOT
15.10.2 PRODUCT PORTFOLIO
15.10.3 RECENT DEVELOPMENT
15.11 RE&S
15.11.1 COMPANY SNAPSHOT
15.11.2 REVENUE ANALYSIS
15.11.3 BRAND PORTFOLIO
15.11.4 RECENT DEVELOPMENT
15.12 SAZENKA
15.12.1 COMPANY SNAPSHOT
15.12.2 PRODUCT PORTFOLIO
15.12.3 RECENT DEVELOPMENTS
15.13 SEZZANE
15.13.1 COMPANY SNAPSHOT
15.13.2 PRODUCT PORTFOLIO
15.13.3 RECENT NEWS
15.14 SUSHI A GO GO
15.14.1 COMPANY SNAPSHOT
15.14.2 PRODUCT PORTFOLIO
15.14.3 RECENT DEVELOPMENT
15.15 SUSHI DEN
15.15.1 COMPANY SNAPSHOT
15.15.2 PRODUCT PORTFOLIO
15.15.3 RECENT DEVELOPMENT
15.16 SUSHI GEN ENTERPRISES
15.16.1 COMPANY SNAPSHOT
15.16.2 PRODUCT PORTFOLIO
15.16.3 RECENT DEVELOPMENTS
15.17 SUSHI NOZAWA GROUP
15.17.1 COMPANY SNAPSHOT
15.17.2 PRODUCT PORTFOLIO
15.17.3 RECENT DEVELOPMENTS
15.18 SUSHIYA
15.18.1 COMPANY SNAPSHOT
15.18.2 PRODUCT PORTFOLIO
15.18.3 RECENT DEVELOPMENTS
15.19 TAKAMI SUSHI & ROBATA RESTAURANT
15.19.1 COMPANY SNAPSHOT
15.19.2 PRODUCT PORTFOLIO
15.19.3 RECENT DEVELOPMENT
15.2 TATSU RAMEN LLC
15.20.1 COMPANY SNAPSHOT
15.20.2 PRODUCT PORTFOLIO
15.20.3 RECENT DEVELOPMENTS
15.21 YAMASHIRO HOLLYWOOD
15.21.1 COMPANY SNAPSHOT
15.21.2 PRODUCT PORTFOLIO
15.21.3 RECENT DEVELOPMENTS
16 QUESTIONNAIRE
17 RELATED REPORTS
List of Table
TABLE 1 REGULATORY COVERAGE
TABLE 2 NORTH AMERICA JAPANESE RESTAURANT MARKET, BY CUISINE TYPE, 2018-2032 (USD THOUSAND)
TABLE 3 NORTH AMERICA TRADITIONAL JAPANESE CUISINE IN JAPANESE RESTAURANT MARKET, BY REGION, 2018-2032 (USD THOUSAND)
TABLE 4 NORTH AMERICA TRADITIONAL JAPANESE CUISINE IN JAPANESE RESTAURANT MARKET, BY TYPE, 2018-2032 (USD THOUSAND)
TABLE 5 NORTH AMERICA SUSHI IN JAPANESE RESTAURANT MARKET, BY TYPE, 2018-2032 (USD THOUSAND)
TABLE 6 NORTH AMERICA SUSHI IN JAPANESE RESTAURANT MARKET, BY CHAIN, 2018-2032 (USD THOUSAND)
TABLE 7 NORTH AMERICA SUSHI IN JAPANESE RESTAURANT MARKET, BY RESTAURANT MODE, 2018-2032 (USD THOUSAND)
TABLE 8 NORTH AMERICA SUSHI IN JAPANESE RESTAURANT MARKET, BY ESTABLISHMENT, 2018-2032 (USD THOUSAND)
TABLE 9 NORTH AMERICA RAMEN IN JAPANESE RESTAURANT MARKET, BY RESTAURANT MODE, 2018-2032 (USD THOUSAND)
TABLE 10 NORTH AMERICA RAMEN IN JAPANESE RESTAURANT MARKET, BY ESTABLISHMENT, 2018-2032 (USD THOUSAND)
TABLE 11 NORTH AMERICA TEMPURA IN JAPANESE RESTAURANT MARKET, BY RESTAURANT MODE, 2018-2032 (USD THOUSAND)
TABLE 12 NORTH AMERICA TEMPURA IN JAPANESE RESTAURANT MARKET, BY ESTABLISHMENT, 2018-2032 (USD THOUSAND)
TABLE 13 NORTH AMERICA SASHIMI IN JAPANESE RESTAURANT MARKET, BY RESTAURANT MODE, 2018-2032 (USD THOUSAND)
TABLE 14 NORTH AMERICA SASHIMI IN JAPANESE RESTAURANT MARKET, BY ESTABLISHMENT, 2018-2032 (USD THOUSAND)
TABLE 15 NORTH AMERICA KAISEKI IN JAPANESE RESTAURANT MARKET, BY RESTAURANT MODE, 2018-2032 (USD THOUSAND)
TABLE 16 NORTH AMERICA KAISEKI IN JAPANESE RESTAURANT MARKET, BY ESTABLISHMENT, 2018-2032 (USD THOUSAND)
TABLE 17 NORTH AMERICA UDON/SOBA IN JAPANESE RESTAURANT MARKET, BY RESTAURANT MODE, 2018-2032 (USD THOUSAND)
TABLE 18 NORTH AMERICA UDON/SOBA IN JAPANESE RESTAURANT MARKET, BY ESTABLISHMENT, 2018-2032 (USD THOUSAND)
TABLE 19 NORTH AMERICA OTHERS IN JAPANESE RESTAURANT MARKET, BY RESTAURANT MODE, 2018-2032 (USD THOUSAND)
TABLE 20 NORTH AMERICA OTHERS IN JAPANESE RESTAURANT MARKET, BY ESTABLISHMENT, 2018-2032 (USD THOUSAND)
TABLE 21 NORTH AMERICA SPECIALTY JAPANESE CUISINE IN JAPANESE RESTAURANT MARKET, BY REGION, 2018-2032 (USD THOUSAND)
TABLE 22 NORTH AMERICA SPECIALTY JAPANESE CUISINE IN JAPANESE RESTAURANT MARKET, BY TYPE, 2018-2032 (USD THOUSAND)
TABLE 23 NORTH AMERICA SPECIALTY JAPANESE CUISINE IN JAPANESE RESTAURANT MARKET, BY RESTAURANT MODE, 2018-2032 (USD THOUSAND)
TABLE 24 NORTH AMERICA SPECIALTY JAPANESE IN JAPANESE RESTAURANT MARKET, BY ESTABLISHMENT, 2018-2032 (USD THOUSAND)
TABLE 25 NORTH AMERICA MODERN JAPANESE CUISINE IN JAPANESE RESTAURANT MARKET, BY REGION, 2018-2032 (USD THOUSAND)
TABLE 26 NORTH AMERICA MODERN JAPANESE CUISINE IN JAPANESE RESTAURANT MARKET, BY TYPE, 2018-2032 (USD THOUSAND)
TABLE 27 NORTH AMERICA MODERN JAPANESE CUISINE IN JAPANESE RESTAURANT MARKET, BY RESTAURANT MODE, 2018-2032 (USD THOUSAND)
TABLE 28 NORTH AMERICA MODERN JAPANESE IN JAPANESE RESTAURANT MARKET, BY ESTABLISHMENT, 2018-2032 (USD THOUSAND)
TABLE 29 NORTH AMERICA JAPANESE RESTAURANT MARKET, BY SERVICE TYPE, 2018-2032 (USD THOUSAND)
TABLE 30 NORTH AMERICA QUICK SERVICE RESTAURANTS (QSR) IN JAPANESE RESTAURANT MARKET, BY REGION, 2018-2032 (USD THOUSAND)
TABLE 31 NORTH AMERICA FULL SERVICE IN JAPANESE RESTAURANT MARKET, BY REGION, 2018-2032 (USD THOUSAND)
TABLE 32 NORTH AMERICA TAKE-OUT COUNTERS/OUTLETS IN JAPANESE RESTAURANT MARKET, BY REGION, 2018-2032 (USD THOUSAND)
TABLE 33 NORTH AMERICA JAPANESE RESTAURANT MARKET, BY RESTAURANT CATEGORY, 2018-2032 (USD THOUSAND)
TABLE 34 NORTH AMERICA STANDALONE RESTAURANT IN JAPANESE RESTAURANT MARKET, BY REGION, 2018-2032 (USD THOUSAND)
TABLE 35 NORTH AMERICA CHAIN/FRANCHISE MODEL IN JAPANESE RESTAURANT MARKET, BY REGION, 2018-2032 (USD THOUSAND)
TABLE 36 NORTH AMERICA JAPANESE RESTAURANT MARKET, BY RESTAURANT MODEL, 2018-2032 (USD THOUSAND)
TABLE 37 NORTH AMERICA TAKEAWAY IN JAPANESE RESTAURANT MARKET, BY REGION, 2018-2032 (USD THOUSAND)
TABLE 38 NORTH AMERICA HOME DELIVERY IN JAPANESE RESTAURANT MARKET, BY REGION, 2018-2032 (USD THOUSAND)
TABLE 39 NORTH AMERICA DINE-IN IN JAPANESE RESTAURANT MARKET, BY REGION, 2018-2032 (USD THOUSAND)
TABLE 40 NORTH AMERICA JAPANESE RESTAURANT MARKET, BY SALES CHANNEL, 2018-2032 (USD THOUSAND)
TABLE 41 NORTH AMERICA PHYSICAL OUTLETS IN JAPANESE RESTAURANT MARKET, BY REGION, 2018-2032 (USD THOUSAND)
TABLE 42 NORTH AMERICA DELIVERY ONLINE RESTAURANTS/GHOST KITCHEN IN JAPANESE RESTAURANT MARKET, BY REGION, 2018-2032 (USD THOUSAND)
TABLE 43 NORTH AMERICA JAPANESE RESTAURANT MARKET, BY COUNTRY, 2018-2032 (USD THOUSAND)
TABLE 44 NORTH AMERICA JAPANESE RESTAURANT MARKET, BY CUISINE TYPE, 2018-2032 (USD THOUSAND)
TABLE 45 NORTH AMERICA TRADITIONAL JAPANESE CUISINE IN JAPANESE RESTAURANT MARKET, BY TYPE, 2018-2032 (USD THOUSAND)
TABLE 46 NORTH AMERICA SUSHI IN JAPANESE RESTAURANT MARKET, BY TYPE, 2018-2032 (USD THOUSAND)
TABLE 47 NORTH AMERICA SUSHI IN JAPANESE RESTAURANT MARKET, BY CHAIN, 2018-2032 (USD THOUSAND)
TABLE 48 NORTH AMERICA SUSHI IN JAPANESE RESTAURANT MARKET, BY RESTAURANT MODE, 2018-2032 (USD THOUSAND)
TABLE 49 NORTH AMERICA SUSHI IN JAPANESE RESTAURANT MARKET, BY ESTABLISHMENT, 2018-2032 (USD THOUSAND)
TABLE 50 NORTH AMERICA RAMEN IN JAPANESE RESTAURANT MARKET, BY RESTAURANT MODE, 2018-2032 (USD THOUSAND)
TABLE 51 NORTH AMERICA RAMEN IN JAPANESE RESTAURANT MARKET, BY ESTABLISHMENT, 2018-2032 (USD THOUSAND)
TABLE 52 NORTH AMERICA TEMPURA IN JAPANESE RESTAURANT MARKET, BY RESTAURANT MODE, 2018-2032 (USD THOUSAND)
TABLE 53 NORTH AMERICA TEMPURA IN JAPANESE RESTAURANT MARKET, BY ESTABLISHMENT, 2018-2032 (USD THOUSAND)
TABLE 54 NORTH AMERICA SASHIMI IN JAPANESE RESTAURANT MARKET, BY RESTAURANT MODE, 2018-2032 (USD THOUSAND)
TABLE 55 NORTH AMERICA SASHIMI IN JAPANESE RESTAURANT MARKET, BY ESTABLISHMENT, 2018-2032 (USD THOUSAND)
TABLE 56 NORTH AMERICA KAISEKI IN JAPANESE RESTAURANT MARKET, BY RESTAURANT MODE, 2018-2032 (USD THOUSAND)
TABLE 57 NORTH AMERICA KAISEKI IN JAPANESE RESTAURANT MARKET, BY ESTABLISHMENT, 2018-2032 (USD THOUSAND)
TABLE 58 NORTH AMERICA UDON/SOBA IN JAPANESE RESTAURANT MARKET, BY RESTAURANT MODE, 2018-2032 (USD THOUSAND)
TABLE 59 NORTH AMERICA UDON/SOBA IN JAPANESE RESTAURANT MARKET, BY ESTABLISHMENT, 2018-2032 (USD THOUSAND)
TABLE 60 NORTH AMERICA OTHERS IN JAPANESE RESTAURANT MARKET, BY RESTAURANT MODE, 2018-2032 (USD THOUSAND)
TABLE 61 NORTH AMERICA OTHERS IN JAPANESE RESTAURANT MARKET, BY ESTABLISHMENT, 2018-2032 (USD THOUSAND)
TABLE 62 NORTH AMERICA SPECIALTY JAPANESE CUISINE IN JAPANESE RESTAURANT MARKET, BY TYPE, 2018-2032 (USD THOUSAND)
TABLE 63 NORTH AMERICA SPECIALTY JAPANESE CUISINE IN JAPANESE RESTAURANT MARKET, BY RESTAURANT MODE, 2018-2032 (USD THOUSAND)
TABLE 64 NORTH AMERICA SPECIALTY JAPANESE IN JAPANESE RESTAURANT MARKET, BY ESTABLISHMENT, 2018-2032 (USD THOUSAND)
TABLE 65 NORTH AMERICA MODERN JAPANESE CUISINE IN JAPANESE RESTAURANT MARKET, BY TYPE, 2018-2032 (USD THOUSAND)
TABLE 66 NORTH AMERICA MODERN JAPANESE CUISINE IN JAPANESE RESTAURANT MARKET, BY RESTAURANT MODE, 2018-2032 (USD THOUSAND)
TABLE 67 NORTH AMERICA MODERN JAPANESE CUISINE IN JAPANESE RESTAURANT MARKET, BY ESTABLISHMENT, 2018-2032 (USD THOUSAND)
TABLE 68 NORTH AMERICA JAPANESE RESTAURANT MARKET, BY SERVICE TYPE, 2018-2032 (USD THOUSAND)
TABLE 69 NORTH AMERICA JAPANESE RESTAURANT MARKET, BY RESTAURANT CATEGORY, 2018-2032 (USD THOUSAND)
TABLE 70 NORTH AMERICA JAPANESE RESTAURANT MARKET, BY RESTAURANT MODEL, 2018-2032 (USD THOUSAND)
TABLE 71 NORTH AMERICA JAPANESE RESTAURANT MARKET, BY SALES CHANNEL, 2018-2032 (USD THOUSAND)
TABLE 72 U.S. JAPANESE RESTAURANT MARKET, BY CUISINE TYPE, 2018-2032 (USD THOUSAND)
TABLE 73 U.S. TRADITIONAL JAPANESE CUISINE IN JAPANESE RESTAURANT MARKET, BY TYPE, 2018-2032 (USD THOUSAND)
TABLE 74 U.S. SUSHI IN JAPANESE RESTAURANT MARKET, BY TYPE, 2018-2032 (USD THOUSAND)
TABLE 75 U.S. SUSHI IN JAPANESE RESTAURANT MARKET, BY CHAIN, 2018-2032 (USD THOUSAND)
TABLE 76 U.S. SUSHI IN JAPANESE RESTAURANT MARKET, BY RESTAURANT MODE, 2018-2032 (USD THOUSAND)
TABLE 77 U.S. SUSHI IN JAPANESE RESTAURANT MARKET, BY ESTABLISHMENT, 2018-2032 (USD THOUSAND)
TABLE 78 U.S. RAMEN IN JAPANESE RESTAURANT MARKET, BY RESTAURANT MODE, 2018-2032 (USD THOUSAND)
TABLE 79 U.S. RAMEN IN JAPANESE RESTAURANT MARKET, BY ESTABLISHMENT, 2018-2032 (USD THOUSAND)
TABLE 80 U.S. TEMPURA IN JAPANESE RESTAURANT MARKET, BY RESTAURANT MODE, 2018-2032 (USD THOUSAND)
TABLE 81 U.S. TEMPURA IN JAPANESE RESTAURANT MARKET, BY ESTABLISHMENT, 2018-2032 (USD THOUSAND)
TABLE 82 U.S. SASHIMI IN JAPANESE RESTAURANT MARKET, BY RESTAURANT MODE, 2018-2032 (USD THOUSAND)
TABLE 83 U.S. SASHIMI IN JAPANESE RESTAURANT MARKET, BY ESTABLISHMENT, 2018-2032 (USD THOUSAND)
TABLE 84 U.S. KAISEKI IN JAPANESE RESTAURANT MARKET, BY RESTAURANT MODE, 2018-2032 (USD THOUSAND)
TABLE 85 U.S. KAISEKI IN JAPANESE RESTAURANT MARKET, BY ESTABLISHMENT, 2018-2032 (USD THOUSAND)
TABLE 86 U.S. UDON/SOBA IN JAPANESE RESTAURANT MARKET, BY RESTAURANT MODE, 2018-2032 (USD THOUSAND)
TABLE 87 U.S. UDON/SOBA IN JAPANESE RESTAURANT MARKET, BY ESTABLISHMENT, 2018-2032 (USD THOUSAND)
TABLE 88 U.S. OTHERS IN JAPANESE RESTAURANT MARKET, BY RESTAURANT MODE, 2018-2032 (USD THOUSAND)
TABLE 89 U.S. OTHERS IN JAPANESE RESTAURANT MARKET, BY ESTABLISHMENT, 2018-2032 (USD THOUSAND)
TABLE 90 U.S. SPECIALTY JAPANESE CUISINE IN JAPANESE RESTAURANT MARKET, BY TYPE, 2018-2032 (USD THOUSAND)
TABLE 91 U.S. SPECIALTY JAPANESE CUISINE IN JAPANESE RESTAURANT MARKET, BY RESTAURANT MODE, 2018-2032 (USD THOUSAND)
TABLE 92 U.S. SPECIALTY JAPANESE IN JAPANESE RESTAURANT MARKET, BY ESTABLISHMENT, 2018-2032 (USD THOUSAND)
TABLE 93 U.S. MODERN JAPANESE CUISINE IN JAPANESE RESTAURANT MARKET, BY TYPE, 2018-2032 (USD THOUSAND)
TABLE 94 U.S. MODERN JAPANESE CUISINE IN JAPANESE RESTAURANT MARKET, BY RESTAURANT MODE, 2018-2032 (USD THOUSAND)
TABLE 95 U.S. MODERN JAPANESE CUISINE IN JAPANESE RESTAURANT MARKET, BY ESTABLISHMENT, 2018-2032 (USD THOUSAND)
TABLE 96 U.S. JAPANESE RESTAURANT MARKET, BY SERVICE TYPE, 2018-2032 (USD THOUSAND)
TABLE 97 U.S. JAPANESE RESTAURANT MARKET, BY RESTAURANT CATEGORY, 2018-2032 (USD THOUSAND)
TABLE 98 U.S. JAPANESE RESTAURANT MARKET, BY RESTAURANT MODEL, 2018-2032 (USD THOUSAND)
TABLE 99 U.S. JAPANESE RESTAURANT MARKET, BY SALES CHANNEL, 2018-2032 (USD THOUSAND)
TABLE 100 CANADA JAPANESE RESTAURANT MARKET, BY CUISINE TYPE, 2018-2032 (USD THOUSAND)
TABLE 101 CANADA TRADITIONAL JAPANESE CUISINE IN JAPANESE RESTAURANT MARKET, BY TYPE, 2018-2032 (USD THOUSAND)
TABLE 102 CANADA SUSHI IN JAPANESE RESTAURANT MARKET, BY TYPE, 2018-2032 (USD THOUSAND)
TABLE 103 CANADA SUSHI IN JAPANESE RESTAURANT MARKET, BY CHAIN, 2018-2032 (USD THOUSAND)
TABLE 104 CANADA SUSHI IN JAPANESE RESTAURANT MARKET, BY RESTAURANT MODE, 2018-2032 (USD THOUSAND)
TABLE 105 CANADA SUSHI IN JAPANESE RESTAURANT MARKET, BY ESTABLISHMENT, 2018-2032 (USD THOUSAND)
TABLE 106 CANADA RAMEN IN JAPANESE RESTAURANT MARKET, BY RESTAURANT MODE, 2018-2032 (USD THOUSAND)
TABLE 107 CANADA RAMEN IN JAPANESE RESTAURANT MARKET, BY ESTABLISHMENT, 2018-2032 (USD THOUSAND)
TABLE 108 CANADA TEMPURA IN JAPANESE RESTAURANT MARKET, BY RESTAURANT MODE, 2018-2032 (USD THOUSAND)
TABLE 109 CANADA TEMPURA IN JAPANESE RESTAURANT MARKET, BY ESTABLISHMENT, 2018-2032 (USD THOUSAND)
TABLE 110 CANADA SASHIMI IN JAPANESE RESTAURANT MARKET, BY RESTAURANT MODE, 2018-2032 (USD THOUSAND)
TABLE 111 CANADA SASHIMI IN JAPANESE RESTAURANT MARKET, BY ESTABLISHMENT, 2018-2032 (USD THOUSAND)
TABLE 112 CANADA KAISEKI IN JAPANESE RESTAURANT MARKET, BY RESTAURANT MODE, 2018-2032 (USD THOUSAND)
TABLE 113 CANADA KAISEKI IN JAPANESE RESTAURANT MARKET, BY ESTABLISHMENT, 2018-2032 (USD THOUSAND)
TABLE 114 CANADA UDON/SOBA IN JAPANESE RESTAURANT MARKET, BY RESTAURANT MODE, 2018-2032 (USD THOUSAND)
TABLE 115 CANADA UDON/SOBA IN JAPANESE RESTAURANT MARKET, BY ESTABLISHMENT, 2018-2032 (USD THOUSAND)
TABLE 116 CANADA OTHERS IN JAPANESE RESTAURANT MARKET, BY RESTAURANT MODE, 2018-2032 (USD THOUSAND)
TABLE 117 CANADA OTHERS IN JAPANESE RESTAURANT MARKET, BY ESTABLISHMENT, 2018-2032 (USD THOUSAND)
TABLE 118 CANADA SPECIALTY JAPANESE CUISINE IN JAPANESE RESTAURANT MARKET, BY TYPE, 2018-2032 (USD THOUSAND)
TABLE 119 CANADA SPECIALTY JAPANESE CUISINE IN JAPANESE RESTAURANT MARKET, BY RESTAURANT MODE, 2018-2032 (USD THOUSAND)
TABLE 120 CANADA SPECIALTY JAPANESE IN JAPANESE RESTAURANT MARKET, BY ESTABLISHMENT, 2018-2032 (USD THOUSAND)
TABLE 121 CANADA MODERN JAPANESE CUISINE IN JAPANESE RESTAURANT MARKET, BY TYPE, 2018-2032 (USD THOUSAND)
TABLE 122 CANADA MODERN JAPANESE CUISINE IN JAPANESE RESTAURANT MARKET, BY RESTAURANT MODE, 2018-2032 (USD THOUSAND)
TABLE 123 CANADA MODERN JAPANESE CUISINE IN JAPANESE RESTAURANT MARKET, BY ESTABLISHMENT, 2018-2032 (USD THOUSAND)
TABLE 124 CANADA JAPANESE RESTAURANT MARKET, BY SERVICE TYPE, 2018-2032 (USD THOUSAND)
TABLE 125 CANADA JAPANESE RESTAURANT MARKET, BY RESTAURANT CATEGORY, 2018-2032 (USD THOUSAND)
TABLE 126 CANADA JAPANESE RESTAURANT MARKET, BY RESTAURANT MODEL, 2018-2032 (USD THOUSAND)
TABLE 127 CANADA JAPANESE RESTAURANT MARKET, BY SALES CHANNEL, 2018-2032 (USD THOUSAND)
TABLE 128 MEXICO JAPANESE RESTAURANT MARKET, BY CUISINE TYPE, 2018-2032 (USD THOUSAND)
TABLE 129 MEXICO TRADITIONAL JAPANESE CUISINE IN JAPANESE RESTAURANT MARKET, BY TYPE, 2018-2032 (USD THOUSAND)
TABLE 130 MEXICO SUSHI IN JAPANESE RESTAURANT MARKET, BY TYPE, 2018-2032 (USD THOUSAND)
TABLE 131 MEXICO SUSHI IN JAPANESE RESTAURANT MARKET, BY CHAIN, 2018-2032 (USD THOUSAND)
TABLE 132 MEXICO SUSHI IN JAPANESE RESTAURANT MARKET, BY RESTAURANT MODE, 2018-2032 (USD THOUSAND)
TABLE 133 MEXICO SUSHI IN JAPANESE RESTAURANT MARKET, BY ESTABLISHMENT, 2018-2032 (USD THOUSAND)
TABLE 134 MEXICO RAMEN IN JAPANESE RESTAURANT MARKET, BY RESTAURANT MODE, 2018-2032 (USD THOUSAND)
TABLE 135 MEXICO RAMEN IN JAPANESE RESTAURANT MARKET, BY ESTABLISHMENT, 2018-2032 (USD THOUSAND)
TABLE 136 MEXICO TEMPURA IN JAPANESE RESTAURANT MARKET, BY RESTAURANT MODE, 2018-2032 (USD THOUSAND)
TABLE 137 MEXICO TEMPURA IN JAPANESE RESTAURANT MARKET, BY ESTABLISHMENT, 2018-2032 (USD THOUSAND)
TABLE 138 MEXICO SASHIMI IN JAPANESE RESTAURANT MARKET, BY RESTAURANT MODE, 2018-2032 (USD THOUSAND)
TABLE 139 MEXICO SASHIMI IN JAPANESE RESTAURANT MARKET, BY ESTABLISHMENT, 2018-2032 (USD THOUSAND)
TABLE 140 MEXICO KAISEKI IN JAPANESE RESTAURANT MARKET, BY RESTAURANT MODE, 2018-2032 (USD THOUSAND)
TABLE 141 MEXICO KAISEKI IN JAPANESE RESTAURANT MARKET, BY ESTABLISHMENT, 2018-2032 (USD THOUSAND)
TABLE 142 MEXICO UDON/SOBA IN JAPANESE RESTAURANT MARKET, BY RESTAURANT MODE, 2018-2032 (USD THOUSAND)
TABLE 143 MEXICO UDON/SOBA IN JAPANESE RESTAURANT MARKET, BY ESTABLISHMENT, 2018-2032 (USD THOUSAND)
TABLE 144 MEXICO OTHERS IN JAPANESE RESTAURANT MARKET, BY RESTAURANT MODE, 2018-2032 (USD THOUSAND)
TABLE 145 MEXICO OTHERS IN JAPANESE RESTAURANT MARKET, BY ESTABLISHMENT, 2018-2032 (USD THOUSAND)
TABLE 146 MEXICO SPECIALTY JAPANESE CUISINE IN JAPANESE RESTAURANT MARKET, BY TYPE, 2018-2032 (USD THOUSAND)
TABLE 147 MEXICO SPECIALTY JAPANESE CUISINE IN JAPANESE RESTAURANT MARKET, BY RESTAURANT MODE, 2018-2032 (USD THOUSAND)
TABLE 148 MEXICO SPECIALTY JAPANESE IN JAPANESE RESTAURANT MARKET, BY ESTABLISHMENT, 2018-2032 (USD THOUSAND)
TABLE 149 MEXICO MODERN JAPANESE CUISINE IN JAPANESE RESTAURANT MARKET, BY TYPE, 2018-2032 (USD THOUSAND)
TABLE 150 MEXICO MODERN JAPANESE CUISINE IN JAPANESE RESTAURANT MARKET, BY RESTAURANT MODE, 2018-2032 (USD THOUSAND)
TABLE 151 MEXICO MODERN JAPANESE CUISINE IN JAPANESE RESTAURANT MARKET, BY ESTABLISHMENT, 2018-2032 (USD THOUSAND)
TABLE 152 MEXICO JAPANESE RESTAURANT MARKET, BY SERVICE TYPE, 2018-2032 (USD THOUSAND)
TABLE 153 MEXICO JAPANESE RESTAURANT MARKET, BY RESTAURANT CATEGORY, 2018-2032 (USD THOUSAND)
TABLE 154 MEXICO JAPANESE RESTAURANT MARKET, BY RESTAURANT MODEL, 2018-2032 (USD THOUSAND)
TABLE 155 MEXICO JAPANESE RESTAURANT MARKET, BY SALES CHANNEL, 2018-2032 (USD THOUSAND)
List of Figure
FIGURE 1 NORTH AMERICA JAPANESE RESTAURANT MARKET
FIGURE 2 NORTH AMERICA JAPANESE RESTAURANT MARKET: DATA TRIANGULATION
FIGURE 3 NORTH AMERICA JAPANESE RESTAURANT MARKET: DROC ANALYSIS
FIGURE 4 NORTH AMERICA JAPANESE RESTAURANT MARKET: NORTH AMERICA VS REGIONAL MARKET ANALYSIS
FIGURE 5 NORTH AMERICA JAPANESE RESTAURANT MARKET: COMPANY RESEARCH ANALYSIS
FIGURE 6 NORTH AMERICA JAPANESE RESTAURANT MARKET: MULTIVARIATE MODELLING
FIGURE 7 NORTH AMERICA JAPANESE RESTAURANT MARKET: INTERVIEW DEMOGRAPHICS
FIGURE 8 NORTH AMERICA JAPANESE RESTAURANT MARKET: DBMR MARKET POSITION GRID
FIGURE 9 NORTH AMERICA JAPANESE RESTAURANT MARKET: VENDOR SHARE ANALYSIS
FIGURE 10 NORTH AMERICA JAPANESE RESTAURANT MARKET: SEGMENTATION
FIGURE 11 THREE SEGMENTS COMPRISE THE NORTH AMERICA JAPANESE RESTAURANT MARKET: BY CUISINE TYPE, 2024
FIGURE 12 EXECUTIVE SUMMARY
FIGURE 13 STRATEGIC DECISIONS
FIGURE 14 INCREASING AWARENESS OF HEALTH BENEFITS IS EXPECTED TO DRIVE THE NORTH AMERICA JAPANESE RESTAURANT MARKET IN THE FORECAST PERIOD
FIGURE 15 TRADITIONAL JAPANESE CUISINE SEGMENT IS EXPECTED TO ACCOUNT FOR THE LARGEST SHARE OF THE NORTH AMERICA JAPANESE RESTAURANT MARKET IN 2025 AND 2032
FIGURE 16 SUPPLY CHAIN ANALYSIS- NORTH AMERICA JAPANESE RESTAURANT MARKET
FIGURE 17 VENDOR SELECTION CRITERIA
FIGURE 18 DRIVERS, RESTRAINTS, OPPORTUNITIES AND CHALLENGES OF NORTH AMERICA JAPANESE RESTAURANT MARKET
FIGURE 19 NORTH AMERICA JAPANESE RESTAURANT MARKET: BY CUISINE TYPE, 2024
FIGURE 20 NORTH AMERICA JAPANESE RESTAURANT MARKET: BY SERVICE TYPE, 2024
FIGURE 21 NORTH AMERICA JAPANESE RESTAURANT MARKET: BY RESTAURANT CATEGORY, 2024
FIGURE 22 NORTH AMERICA JAPANESE RESTAURANT MARKET: BY RESTAURANT MODEL, 2024
FIGURE 23 NORTH AMERICA JAPANESE RESTAURANT MARKET: BY SALES CHANNEL, 2024
FIGURE 24 NORTH AMERICA JAPANESE RESTAURANT MARKET: SNAPSHOT, 2024
FIGURE 25 NORTH AMERICA JAPANESE RESTAURANT MARKET: COMPANY SHARE, 2024 (%)
North America Japanese Restaurant Market, Supply Chain Analysis and Ecosystem Framework
To support market growth and help clients navigate the impact of geopolitical shifts, DBMR has integrated in-depth supply chain analysis into its North America Japanese Restaurant Market research reports. This addition empowers clients to respond effectively to global changes affecting their industries. The supply chain analysis section includes detailed insights such as North America Japanese Restaurant Market consumption and production by country, price trend analysis, the impact of tariffs and geopolitical developments, and import and export trends by country and HSN code. It also highlights major suppliers with data on production capacity and company profiles, as well as key importers and exporters. In addition to research, DBMR offers specialized supply chain consulting services backed by over a decade of experience, providing solutions like supplier discovery, supplier risk assessment, price trend analysis, impact evaluation of inflation and trade route changes, and comprehensive market trend analysis.
Data collection and base year analysis are done using data collection modules with large sample sizes. The stage includes obtaining market information or related data through various sources and strategies. It includes examining and planning all the data acquired from the past in advance. It likewise envelops the examination of information inconsistencies seen across different information sources. The market data is analysed and estimated using market statistical and coherent models. Also, market share analysis and key trend analysis are the major success factors in the market report. To know more, please request an analyst call or drop down your inquiry.
The key research methodology used by DBMR research team is data triangulation which involves data mining, analysis of the impact of data variables on the market and primary (industry expert) validation. Data models include Vendor Positioning Grid, Market Time Line Analysis, Market Overview and Guide, Company Positioning Grid, Patent Analysis, Pricing Analysis, Company Market Share Analysis, Standards of Measurement, Global versus Regional and Vendor Share Analysis. To know more about the research methodology, drop in an inquiry to speak to our industry experts.
Data Bridge Market Research is a leader in advanced formative research. We take pride in servicing our existing and new customers with data and analysis that match and suits their goal. The report can be customized to include price trend analysis of target brands understanding the market for additional countries (ask for the list of countries), clinical trial results data, literature review, refurbished market and product base analysis. Market analysis of target competitors can be analyzed from technology-based analysis to market portfolio strategies. We can add as many competitors that you require data about in the format and data style you are looking for. Our team of analysts can also provide you data in crude raw excel files pivot tables (Fact book) or can assist you in creating presentations from the data sets available in the report.


