
North America Liquid Filling Machines Market
Market Size in USD Billion
 USD
1.95 Billion
USD
2.80 Billion
2024
2032
USD
1.95 Billion
USD
2.80 Billion
2024
2032
| 2025 - 2032 | |
| USD 1.95 Billion | |
| USD 2.80 Billion | |
| % | |
|
North America Liquid Filling Machine Market Size
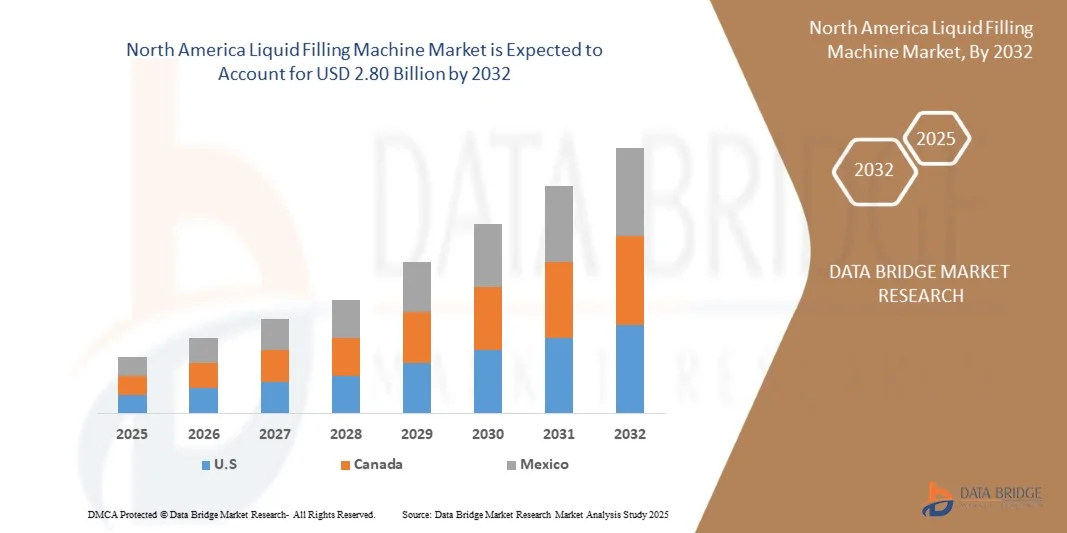
- The North America Liquid Filling Machine Market was valued at USD 1.95 billion in 2024 and is expected to reach approximately 2.80 billion by 2032.
- During the forecast period of 2025 to 2032, the market is anticipated to grow at a CAGR of 5.35%, primarily fueled by rising awareness of mental health, chronic disease prevention, and the increasing adoption of wellness solutions by employers.
- The global liquid filling machines market refers to the industry focused on the development, manufacturing, and distribution of machinery designed to fill various types of liquids into containers.
North America Liquid Filling Machine Market Analysis
- The North America Liquid Filling Machine Market is a key segment within industrial automation, driven by robust demand from the food & beverage, pharmaceutical, and cosmetics industries. The market is characterized by a strong preference for high-speed, precision-based filling solutions that comply with stringent hygiene and safety regulations.
- Market growth is closely tied to increasing investments in smart manufacturing, the need for operational efficiency, and the rising adoption of automated packaging lines to handle diverse liquid viscosities—from low-viscosity beverages to high-viscosity creams and serums. Technological advancements such as servo-driven systems, IoT-enabled monitoring, and clean-in-place (CIP) capabilities are further accelerating adoption across end-user sectors.
- In 2025, the U.S. dominates the North American Liquid Filling Machines market, accounting for over 85% of regional revenue. This leadership stems from the country’s advanced pharmaceutical manufacturing base, large-scale beverage production facilities, and strong presence of automation technology providers. Canada holds a modest share through academic and biotech research applications, while Mexico’s contribution remains limited but is gradually expanding due to nearshoring trends in packaging manufacturing.
- Bottling Machines represent the largest product segment, capturing 47.20% of the North America Liquid Filling Machine Market in 2025. This dominance is fueled by surging demand for automated bottling in water, carbonated drinks, liquid pharmaceuticals, and personal care products, alongside continuous innovation in filling accuracy, line speed, and contamination control to meet evolving consumer and regulatory standards
Report Scope and North America Liquid Filling Machines Market Segmentation
|
Attributes |
North America Liquid Filling Machines Key Market Insights |
|
Segments Covered |
|
|
Countries Covered |
North America
|
|
Key Market Players |
|
|
Market Opportunities |
|
|
Value Added Data Infosets |
In addition to the insights on market scenarios such as market value, growth rate, segmentation, geographical coverage, and major players, the market reports curated by the Data Bridge Market Research also include import export analysis, production capacity overview, production consumption analysis, price trend analysis, climate change scenario, supply chain analysis, value chain analysis, raw material/consumables overview, vendor selection criteria, PESTLE Analysis, Porter Analysis, and regulatory framework.. |
North America Liquid Filling Machines Market Trends
“Advancements In Flexible, Modular, And Multi-Viscosity Filling Technologies”
- Continuous advancements in flexible, modular, and multi-viscosity filling technologies are reshaping the capabilities and scalability of modern liquid filling operations. These innovations focus on accommodating a wide range of container sizes, product viscosities, and production formats while ensuring precision, hygiene, and operational efficiency.
- The development of modular filling units, quick-changeover systems, and integrated line controls enables manufacturers to switch seamlessly between liquid, semi-liquid, and viscous products without extensive downtime or retooling. Furthermore, the adoption of advanced servo-driven pumps, digital flow monitoring, and hygienic design standards enhances dosing accuracy, reduces product waste, and supports aseptic processing, positioning these technologies as critical enablers in highly dynamic and regulated production environments.
- In August 2025, according to a news release from the Rotzinger Group, the company launched the VarioFill platform, illustrating how filling-machine OEMs are adapting to the growing demand for systems capable of handling a variety of liquid and non-liquid products, quick changeovers, and flexible production. The platform supports liquids of different viscosities, solid dosage forms, and a wide range of container and closure types—all on a single modular base—demonstrating enhanced flexibility and production efficiency.
- In March 2024, according to the news reported by Packaging Technology Today, Ampack, a subsidiary of Syntegon Technology GmbH, launched the FBL modular bottle-filling machine, reaffirming its commitment to advanced and flexible liquid-filling solutions. The FBL can accommodate HDPE, PP, and PET bottles ranging from 50 mL to 1,500 mL, features a neck-handling system for rapid format changeovers, and incorporates a hygiene-centric design suitable for aseptic operations. It also supports modular integration with both upstream and downstream packaging systems, catering to manufacturers of beverages, cosmetics, and home care products seeking efficient and scalable filling lines.
North America Liquid Filling Machines Market Dynamics
Driver
“Growing Demand For Packaged Beverages, Pharmaceuticals, and Personal Care Products”
- The growing global demand for packaged beverages, pharmaceuticals, and personal care products is significantly driving the liquid filling machines market. Rising consumer preference for hygienic, convenient, and ready-to-use liquid products is prompting manufacturers to expand production capacities and adopt advanced, automated filling systems.
- In the fields of beverages, pharmaceuticals, and cosmetics, precision, speed, and flexibility in handling diverse container types and viscosities are crucial. Moreover, increasing healthcare needs, eco-friendly packaging trends, and product diversification across industries are accelerating the adoption of efficient, contamination-free, and adaptable filling technologies to ensure quality, compliance, and high productivity in modern packaging operations
- In April 2025, Krones AG unveiled a modular filling line engineered explicitly for low-viscosity beverages, emphasizing enhanced energy efficiency, operational flexibility, and container versatility. This development reflects the company’s strategic response to escalating market demand for high-speed, adaptable, and sustainable filling solutions within the beverage sector. The innovation underscores a broader industry trend, wherein manufacturers of beverages, pharmaceuticals, and personal care products are increasingly investing in advanced, automated liquid filling systems to boost productivity, optimize operational efficiency, and align with sustainability objectives, thereby reinforcing the overall expansion of the global liquid filling machines market.
- In July 2024, ProMach, Inc. announced the acquisition of MBF (Italy) to expand its bottle-filling and closing machine capabilities for the global wine & spirits segment. This strategic move underscores how equipment suppliers are investing in and scaling up their filling solutions, particularly for beverage applications, thereby reinforcing the broader growth driver of the liquid filling machines market, linked to the rising demand for packaged beverages.
Restraint/Challenge
“High Initial Investment And Maintenance Costs For Advanced Filling Machines”
- High initial investment and maintenance costs associated with advanced liquid filling machines continue to act as a significant restraint in the global liquid filling machines market. Sophisticated filling systems—such as aseptic, multi-head, or high-speed rotary fillers require precision engineering, automated control systems, specialized pumps and valves, and compliance with strict hygienic standards.
- The acquisition cost of these machines is often substantial, particularly for equipment capable of handling diverse container types, high throughput, or sensitive liquid products (e.g., dairy, beverages, or cosmetics).
- In September 2025, ACE Filling reported that high-speed automated filling machines, capable of handling over 10,000 bottles per hour, require maintenance 3 to 5 times more frequently than standard models, with upkeep consuming up to 40% of operational budgets in large-scale plants. Although automation lowers labor and energy costs, the machines’ technical complexity and frequent servicing reduce some of these efficiency gains. This underscores the financial challenge of investing in advanced liquid filling equipment: beyond the initial purchase price, ongoing maintenance and operational costs are significant, affecting overall ROI and creating barriers for smaller or emerging manufacturers.
- In September 2025, the Oden Machinery blog highlights that the cost of liquid filling machines is primarily determined by materials, build quality, and advanced functionalities. Machines made of stainless steel with sanitary designs, CIP modules, automation, and integrated systems are significantly more expensive than basic carbon-steel or semi-automated alternatives. The blog also stresses the importance of factoring in maintenance, spare parts, and service contracts when calculating total investment. This underscores the financial challenge for manufacturers: the purchase of advanced liquid filling equipment demands considerable upfront capital, while ongoing operational and maintenance costs further increase the overall investment burden, particularly for smaller or emerging players.
North America Liquid Filling Machines Market Scope
The global liquid filling machines market is segmented into seven notable segments based on the product type, machine type, filling technology, liquid type, fill type, container type, application.
- By Product Type
On the basis of product type, the global liquid filling machines market is segmented into bottling machines, capping machines, labeling machines, pouch filling machines, injectable liquid vials filling machines, prefilled syringe filling machines, others. In 2025, the bottling machines segment is expected to dominate the market with a 47.20%market share. The automatic bottling machines segment is driven by rising demand for high-speed, precision filling systems in large-scale beverage production. Automation enhances efficiency, reduces labor costs, and minimizes contamination risks. Increasing adoption in water, juice, and dairy bottling lines supports consistent output, product safety, and improved operational productivity.
- By Machine Type
On the basis of machine type, the global liquid filling machines market is segmented into automatic, semi-automatic and manual. In 2025, the automatic segment is expected to dominate the market with a 63.77%market share. Piston filling machines are gaining traction due to their accuracy in handling high-viscosity liquids like sauces, syrups, and creams. Their robust design ensures consistent volume control, making them ideal for food and beverage packaging. Growing demand for flexible, multi-product packaging solutions further boosts piston filler adoption across processing facilities.
- By filling technology
On the basis of filling technology, the global liquid filling machines market is segmented into piston filling, pump filling, vacuum filling, gravity filling, net weight filling, over flow filling, corrosive filling and others. In 2025, the piston filling segment is expected to dominate the market with a 43.26%market share. Piston filling machines are gaining traction due to their accuracy in handling high-viscosity liquids like sauces, syrups, and creams. Their robust design ensures consistent volume control, making them ideal for food and beverage packaging. Growing demand for flexible, multi-product packaging solutions further boosts piston filler adoption across processing facilities.
- By liquid type
On the basis of liquid type, the global liquid filling machines market is segmented into water based liquid, viscous liquids and oils & lubricants. In 2025, the water based liquid segment is expected to dominate the market with a 55.62%market share. The water-based liquid filling segment is driven by the widespread use of bottled water, non-carbonated beverages, and health drinks. Manufacturers focus on faster line speeds, minimal product waste, and hygienic filling technologies. Increasing health-conscious consumption and expanding bottled water production capacities are key growth enablers in this category.
- By Fill Type
On the basis of fill type, the global liquid filling machines market is segmented into cold fill, aseptic fill, hot/warm fill. In 2025, the cold fill segment is expected to dominate the market with a 48.35%market share. Cold fill systems are driven by growing preference for beverages that preserve flavor and nutrients without heat treatment. This method supports energy savings, product freshness, and eco-friendly operations. Expanding production of juices, sports drinks, and functional beverages encourages adoption of advanced cold-fill technologies for high-quality output.
- By Container Type
On the basis of container type, the global liquid filling machines market is segmented into plastic, glass and metal. In 2025, the plastic segment is expected to dominate the market with a 56.28%market share. Plastic packaging dominates due to its lightweight, cost-effectiveness, and versatility across diverse liquid products. Demand for recyclable PET bottles and flexible packaging formats is rising. Food and beverage manufacturers increasingly use sustainable plastic alternatives to meet regulatory standards while maintaining durability and extended shelf life for liquid-filled products.
- By Application
On the basis of application, the global liquid filling machines market is segmented into food & beverages, chemicals, pharmaceuticals & medical devices, personal care & cosmetics and others. In 2025, the food & beverages segment is expected to dominate the market with a 44.93%market share. The food and beverages segment drives demand for liquid filling machines owing to rapid urbanization, rising disposable incomes, and expanding packaged goods consumption. Increasing focus on hygiene, automation, and flexible packaging encourages manufacturers to adopt advanced filling technologies ensuring precision, safety, and scalability in production processes.
North America Liquid Filling Machine Market Regional Analysis
- North America dominates the Liquid Filling Machines market due to the strong presence of established food & beverage manufacturers, advanced packaging automation, and high adoption of Industry 4.0 technologies. Increasing consumer preference for packaged beverages and ready-to-drink products further fuels market growth across the region.
- The region benefits from well-developed manufacturing infrastructure, rising investments in sustainable packaging, and stringent regulatory standards that encourage the use of efficient and hygienic filling solutions.
- North American producers are adopting automated, servo-driven, and IoT-enabled liquid filling machines to improve precision, minimize wastage, and enhance production throughput.
- In addition, the focus on energy-efficient systems and integration of smart control technologies supports cost optimization and compliance with environmental sustainability goals.
U.S. Liquid Filling Machines Market Insight
The U.S. holds the largest share of the North American Liquid Filling Machines market, driven by robust demand from the food, beverage, and pharmaceutical sectors. Manufacturers are investing heavily in automated bottling and filling solutions to enhance productivity and maintain product quality. The expansion of the packaged beverage industry, combined with the growing trend toward customization and smaller batch production, further supports market growth. Leading players such as Fogg Filler, Filamatic, and Accutek Packaging Equipment are continuously developing advanced filling technologies to cater to evolving production requirements.
Canada Liquid Filling Machines Market Insight
Canada is experiencing steady growth in the Liquid Filling Machines market, supported by increasing adoption of automation in beverage, dairy, and personal care product manufacturing. Rising consumer demand for sustainable and hygienic packaging solutions drives the deployment of modern filling equipment. Government initiatives promoting local manufacturing and investments in clean technology are also fostering industry growth. Canadian producers are increasingly adopting modular, energy-efficient, and flexible filling systems to enhance operational efficiency and meet diverse product packaging needs.
Liquid Filling Machines Market Share
The market competitive landscape provides details by competitor. Details included are company overview, company financials, revenue generated, market potential, investment in research and development, new market initiatives, global presence, service offerings, platform capabilities, company strengths and weaknesses, strategic partnerships, program coverage, and employee engagement metrics. The above data points are only related to the companies’ focus related to the Liquid Filling Machines market.
The Major Market Leaders Operating in the Market Are:
- ACCUTEK PACKAGING COMPANY, INC ( U.S.)
- APACKS ( U.S.)
- BARRY-WEHMILLER COMPANIES ( U.S.)
- FOGG FILLER COMPANY ( U.S.)
- INLINE FILLING SYSTEMS ( U.S.)
- JBT ( U.S.)
- ODEN MACHINERY ( U.S.)
- PROMACH INC ( U.S.)
- PSR AUTOMATION INC (Canada)
- SIMPLEX FILLER COMPANY ( U.S.)
Latest Developments in North America Liquid Filling Machines Market
- In October 2025, Barry-Wehmiller’s packaging machinery business, BW Packaging, announced the integration of its three divisions—BW Filling & Closing, BW Flexible Systems, and BW Integrated Systems—into a unified global organization under a single brand. This restructure is designed to enhance collaboration, streamline innovation, and deliver fully integrated packaging line solutions worldwide, reinforcing service, responsiveness and life-cycle support for customers.
- In September 2025, Krones strengthens its portfolio through acquisitions in process technology and filling and packaging equipment, with the acquisition of 60% of the shares in GHS Separationstechnik GmbH and the full takeover of the Dutch company Can Systems Worldwide (CSW).
- In September 2025, JBT inaugurated the Global Production Center (GPC) in Pune, India. This marks a significant milestone in the company’s commitment to serve the Indian and Asia-Pacific markets with world-class solutions
SKU-

- Interactive Data Analysis Dashboard
- Company Analysis Dashboard for high growth potential opportunities
- Research Analyst Access for customization & queries
- Competitor Analysis with Interactive dashboard
- Latest News, Updates & Trend analysis
- Harness the Power of Benchmark Analysis for Comprehensive Competitor Tracking
Table of Content
1 INTRODUCTION
1.1 OBJECTIVES OF THE STUDY
1.2 MARKET DEFINITION
1.3 OVERVIEW OF LIQUID FILLING MACHINES MARKET
1.4 CURRENCY AND PRICING
1.5 LIMITATIONS
1.6 MARKETS COVERED
2 MARKET SEGMENTATION
2.1 MARKETS COVERED
2.2 GEOGRAPHICAL SCOPE
2.3 YEARS CONSIDERED FOR THE STUDY
2.4 DBMR TRIPOD DATA VALIDATION MODEL
2.5 PRIMARY INTERVIEWS WITH KEY OPINION LEADERS
2.6 DBMR MARKET POSITION GRID (MANUFACTURER)
2.7 DBMR MARKET POSITION GRID (DISTRIBUTOR)
2.8 VENDOR SHARE ANALYSIS
2.9 MULTIVARIATE MODELING
2.1 PRODUCT TYPE TIMELINE CURVE
2.11 MARKET APPLICATION COVERAGE GRID
2.12 SECONDARY SOURCES
2.13 ASSUMPTIONS
3 EXECUTIVE SUMMARY
4 PREMIUM INSIGHTS
4.1 PORTER’S FIVE FORCES ANALYSIS
4.1.1 PORTER’S FIVE FORCES ANALYSIS
4.1.2 THREAT OF NEW ENTRANTS
4.1.3 BARGAINING POWER OF SUPPLIERS
4.1.4 BARGAINING POWER OF BUYERS
4.1.5 THREAT OF SUBSTITUTE PRODUCTS
4.1.6 INDUSTRY RIVALRY
4.2 COMPANY EVALUATION QUADRANT – LIQUID FILLING MACHINES MARKET
4.2.1 MARKET LEADERSHIP AND STRATEGIC POSITIONING
4.2.2 INNOVATION ORIENTATION AND TECHNOLOGY ADOPTION
4.2.3 OPERATIONAL EXCELLENCE AND NORTH AMERICA REACH
4.2.4 BUSINESS STRATEGY AND MARKET EXPANSION
4.2.5 MARKET IMPACT AND COMPETITIVE OUTLOOK
4.2.6 QUADRANT DISTRIBUTION OVERVIEW
4.2.7 FUTURE OUTLOOK
4.3 INDUSTRY ECOSYSTEM ANALYSIS
4.3.1 PROMINENT COMPANIES
4.3.2 SMALL & MEDIUM-SIZE COMPANIES
4.3.3 SMALL COMPANIES
4.3.4 OTHERS (SUPPORTING ECOSYSTEM AND END USERS)
4.4 CLIMATE CHANGE SCENARIO
4.4.1 ENVIRONMENTAL CONCERNS
4.4.2 INDUSTRY RESPONSE
4.4.3 GOVERNMENT’S ROLE
4.4.4 ANALYST RECOMMENDATIONS
4.5 CONSUMER BUYING BEHAVIOUR – NORTH AMERICA LIQUID FILLING MACHINES MARKET
4.5.1 WHAT IS CONSUMER BEHAVIOUR?
4.5.2 PROBLEM RECOGNITION AND AWARENESS
4.5.3 INFORMATION SEARCH
4.5.4 PURCHASE DECISION
4.5.5 POST-PURCHASE BEHAVIOUR
4.5.6 DEMOGRAPHIC INSIGHTS
4.5.7 CONCLUSION
4.6 COST ANALYSIS BREAKDOWN
4.6.1 INITIAL CAPITAL INVESTMENT
4.6.2 OPERATING COSTS
4.6.3 MAINTENANCE AND DOWNTIME COSTS
4.6.4 COST EFFICIENCY AND RETURN ON INVESTMENT
4.6.5 EMERGING COST DRIVERS AND OPTIMIZATION STRATEGIES
4.6.6 CONCLUSION
4.7 INNOVATION TRACKER AND STRATEGIC ANALYSIS
4.7.1 MAJOR DEALS AND STRATEGIC ALLIANCES ANALYSIS
4.7.1.1 Joint Ventures
4.7.1.2 Mergers and Acquisitions
4.7.1.3 Licensing and Partnership
4.7.1.4 Technology Collaborations
4.7.1.5 Strategic Divestments
4.7.2 NUMBER OF PRODUCTS IN DEVELOPMENT
4.7.3 STAGE OF DEVELOPMENT
4.7.4 TIMELINES AND MILESTONES
4.7.5 INNOVATION STRATEGIES AND METHODOLOGIES
4.7.6 RISK ASSESSMENT AND MITIGATION
4.7.7 FUTURE OUTLOOK
4.8 PATENT ANALYSIS
4.8.1 PATENT QUALITY AND STRENGTH
4.8.2 PATENT FAMILIES
4.8.3 LICENSING AND COLLABORATIONS
4.8.4 COMPANY PATENT LANDSCAPE
4.8.5 REGION PATENT LANDSCAPE
4.8.6 IP STRATEGY AND MANAGEMENT
4.9 PRICING ANALYSIS
4.1 PROFIT MARGIN SCENARIO
4.10.1 INFLUENCE OF PRODUCTION EFFICIENCY ON PROFIT MARGINS
4.10.2 IMPACT OF PRICING STRATEGIES AND MARKET POSITIONING
4.10.3 ROLE OF SUPPLY CHAIN AND PROCUREMENT EFFICIENCY
4.10.4 TECHNOLOGICAL DIFFERENTIATION AND PRODUCT INNOVATION
4.10.5 EXTERNAL ECONOMIC FACTORS AND MARKET DYNAMICS
4.10.6 CONCLUSION
4.11 RAW MATERIAL COVERAGE
4.11.1 STAINLESS STEEL AND ALLOY STEEL
4.11.2 ALUMINUM AND LIGHTWEIGHT ALLOYS
4.11.3 ENGINEERING PLASTICS AND POLYMERS
4.11.4 ELASTOMERS, SEALS, AND GASKETS
4.11.5 ELECTRONIC, SENSOR, AND ACTUATOR COMPONENTS
4.11.6 COATINGS, SURFACE FINISHES, AND LUBRICANTS
4.11.7 PACKAGING, WIRING, AND ASSEMBLY MATERIALS
4.12 SUPPLY CHAIN ANALYSIS
4.12.1 OVERVIEW
4.12.2 LOGISTIC COST SCENARIO
4.12.3 IMPORTANCE OF LOGISTICS SERVICE PROVIDERS
4.13 TECHNOLOGICAL ADVANCEMENTS
4.13.1 INTELLIGENT AUTOMATION AND ROBOTICS
4.13.2 IOT CONNECTIVITY, DATA ANALYTICS, AND PREDICTIVE MAINTENANCE
4.13.3 PRECISION METERING AND HIGH-SPEED FILLING TECHNOLOGIES
4.13.4 MODULAR, FLEXIBLE, AND MULTI-FORMAT MACHINE DESIGNS
4.13.5 HYGIENIC DESIGN, ASEPTIC FILLING, AND CLEAN-IN-PLACE SYSTEMS
4.13.6 SUSTAINABLE AND ENERGY-EFFICIENT OPERATIONS
4.13.7 DIGITAL TWIN AND SIMULATION-BASED DESIGN
4.13.8 CONCLUSION
4.14 VALUE CHAIN ANALYSIS
4.14.1 RAW MATERIAL PROCUREMENT
4.14.2 MANUFACTURING & ASSEMBLY
4.14.3 AUTOMATION & TECHNOLOGY INTEGRATION
4.14.4 QUALITY TESTING & VALIDATION
4.14.5 DISTRIBUTION & INSTALLATION
4.15 VENDOR SELECTION CRITERIA
4.15.1 PRODUCT QUALITY, PERFORMANCE, AND RELIABILITY
4.15.2 TECHNOLOGICAL CAPABILITY AND INNOVATION
4.15.3 CUSTOMIZATION CAPABILITY AND APPLICATION EXPERTISE
4.15.4 AFTER-SALES SERVICE AND TECHNICAL SUPPORT
4.15.5 REGULATORY COMPLIANCE AND HYGIENE STANDARDS
4.15.6 COST EFFICIENCY AND LIFECYCLE VALUE
4.15.7 NORTH AMERICA PRESENCE AND SUPPLY CHAIN RELIABILITY
4.15.8 SUSTAINABILITY AND ENERGY EFFICIENCY
4.15.9 CONCLUSION
5 TARIFFS & IMPACT ON THE MARKET
5.1 CURRENT TARIFF RATE(S) IN TOP-5 COUNTRY MARKETS
5.2 OUTLOOK: LOCAL PRODUCTION VERSUS IMPORT RELIANCE
5.3 VENDOR SELECTION CRITERIA DYNAMICS
5.4 IMPACT ON SUPPLY CHAIN
5.4.1 RAW MATERIAL PROCUREMENT
5.4.2 MANUFACTURING AND PRODUCTION
5.4.3 LOGISTICS AND DISTRIBUTION
5.4.4 PRICE PITCHING AND POSITION OF MARKET
5.5 INDUSTRY PARTICIPANTS: PROACTIVE MOVES
5.5.1 SUPPLY CHAIN OPTIMIZATION
5.5.2 JOINT VENTURE ESTABLISHMENTS
5.6 IMPACT ON PRICES
5.7 REGULATORY INCLINATION
5.7.1 GEOPOLITICAL SITUATION
5.7.2 TRADE PARTNERSHIPS BETWEEN COUNTRIES
5.7.2.1 FREE TRADE AGREEMENTS
5.7.2.2 ALLIANCES / ESTABLISHMENTS
5.7.3 STATUS / ACCREDITATION (INCLUDING AEO / MFTN)
5.7.4 DOMESTIC COURSE OF CORRECTION
5.7.4.1 INCENTIVE SCHEMES TO BOOST PRODUCTION OUTPUTS
5.7.4.2 ESTABLISHMENT OF SPECIAL ECONOMIC ZONES / INDUSTRIAL PARKS
6 REGULATION COVERAGE
6.1 PRODUCT CODES
6.2 CERTIFIED STANDARDS
6.3 SAFETY STANDARDS
7 MARKET OVERVIEW
7.1 DRIVERS
7.1.1 GROWING DEMAND FOR PACKAGED BEVERAGES, PHARMACEUTICALS, AND PERSONAL CARE PRODUCTS
7.1.2 INCREASING ADOPTION OF AUTOMATION AND PRECISION FILLING TECHNOLOGIES
7.1.3 RAPID EXPANSION OF FOOD, BEVERAGE, AND COSMETIC MANUFACTURING INDUSTRIES
7.1.4 RISING EMPHASIS ON HYGIENIC AND CONTAMINATION-FREE LIQUID PACKAGING
7.2 RESTRAINTS
7.2.1 HIGH INITIAL INVESTMENT AND MAINTENANCE COSTS FOR ADVANCED FILLING MACHINES
7.2.2 COMPLEX INTEGRATION WITH EXISTING PRODUCTION LINES AND PACKAGING SYSTEMS
7.3 OPPORTUNITIES
7.3.1 GROWING DEMAND FOR AUTOMATED AND ASEPTIC FILLING SOLUTIONS IN EMERGING MARKETS
7.3.2 ADVANCEMENTS IN FLEXIBLE, MODULAR, AND MULTI-VISCOSITY FILLING TECHNOLOGIES
7.3.3 DEVELOPMENT OF SMART FILLING SYSTEMS WITH PREDICTIVE MAINTENANCE AND DATA ANALYTICS
7.4 CHALLENGES
7.4.1 RAPID TECHNOLOGICAL EVOLUTION LEADING TO EQUIPMENT OBSOLESCENCE
7.4.2 INTENSE MARKET COMPETITION AMONG NORTH AMERICA AND REGIONAL MACHINE MANUFACTURERS
8 NORTH AMERICA LIQUID FILLING MACHINE MARKET, BY PRODUCT TYPE
8.1 OVERVIEW
8.2 BOTTLING MACHINES
8.3 CAPPING MACHINES
8.4 LABELING MACHINES
8.5 POUCH FILLING MACHINES
8.6 INJECTABLE LIQUID VIALS FILLING MACHINES
8.7 PREFILLED SYRINGE FILLING MACHINES
8.8 OTHERS
9 NORTH AMERICA LIQUID FILLING MACHINES MARKET, BY MACHINE TYPE
9.1 OVERVIEW
9.2 AUTOMATIC
9.2.1 AUTOMATIC, BY TYPE
9.3 SEMI-AUTOMATIC
9.4 MANUAL
10 NORTH AMERICA LIQUID FILLING MACHINES MARKET, BY FILL TYPE
10.1.1 OVERVIEW
10.2 COLD FILL
10.3 ASEPTIC FILL
10.3.1 ASEPTIC FILL, BY TYPE
10.4 HOT/WARM FILL
11 NORTH AMERICA LIQUID FILING MACHINE MARKET, BY FILLING TECHNOLOGY
11.1 OVERVIEW
11.2 PISTON FILLING
11.3 PUMP FILLING
11.4 VACUUM FILLING
11.5 GRAVITY FILLING
11.6 NET WEIGHT FILLING
11.7 OVER FLOW FILLING
11.8 CORROSIVE FILLING
11.9 OTHERS
12 NORTH AMERICA LIQUID FILING MACHINES MARKET, BY LIQUID TYPE
12.1 OVERVIEW
12.2 WATER-BASED LIQUID
12.3 VISCOUS LIQUIDS
12.4 OILS & LUBRICANTS
13 NORTH AMERICA LIQUID FILLING MACHINES MARKET, BY CONTAINER TYPE
13.1 OVERVIEW
13.2 PLASTIC
13.2.1 BOTTLES
13.2.2 TETRA PACK
13.2.3 TUBES
13.2.4 OTHERS
13.3 GLASS
13.3.1 BOTTLES
13.3.2 VIALS
13.3.3 AMPOULES
13.3.4 JARS
13.3.5 OTHERS
13.4 METAL
13.4.1 CANS
13.4.2 DRUMS
13.4.3 BOTTLES
13.4.4 OTHERS
14 NORTH AMERICA LIQUID FILLING MACHINES MARKET, BY APPLICATION
14.1 OVERVIEW
14.2 FOOD & BEVERAGES
14.3 CHEMICALS
14.4 PHARMACEUTICALS & MEDICAL DEVICES
14.5 PERSONAL CARE & COSMETICS
14.6 OTHERS
15 NORTH AMERICA LIQUID FILLING MACHINES MARKET, BY REGION
15.1 NORTH AMERICA
15.1.1 U.S.
15.1.2 CANADA
15.1.3 MEXICO
16 NORTH AMERICA LIQUID FILLING MACHINE MARKET: COMPANY LANDSCAPE
16.1 MANUFACTURER COMPANY SHARE ANALYSIS: GLOBAL
17 SWOT ANALYSIS
18 QUESTIONNAIRE
19 RELATED REPORTS
List of Table
TABLE 1 NORTH AMERICA LIQUID FILLING MACHINE MARKET, BY PRODUCT TYPE, 2018-2032 (USD THOUSAND)
TABLE 2 NORTH AMERICA LIQUID FILLING MACHINE MARKET, BY PRODUCT TYPE, 2018-2032 (UNITS)
TABLE 3 NORTH AMERICA BOTTLING MACHINES IN LIQUID FILLING MACHINES MARKET, BY REGION 2018-2032 (USD THOUSAND)
TABLE 4 NORTH AMERICA BOTTLING MACHINES IN LIQUID FILLING MACHINES MARKET, BY REGION 2018-2032 (UNITS)
TABLE 5 NORTH AMERICA CAPPING MACHINES IN LIQUID FILLING MACHINE MARKET, BY REGION, 2018-2032 (USD THOUSAND)
TABLE 6 NORTH AMERICA CAPPING MACHINES IN LIQUID FILLING MACHINE MARKET, BY REGION, 2018-2032 (UNITS)
TABLE 7 NORTH AMERICA LABELING MACHINES IN LIQUID FILLING MACHINE MARKET, BY REGION, 2018-2032 (USD THOUSAND)
TABLE 8 NORTH AMERICA LABELING MACHINES IN LIQUID FILLING MACHINE MARKET, BY REGION, 2018-2032 (UNITS)
TABLE 9 NORTH AMERICA POUCH FILLING MACHINES IN LIQUID FILLING MACHINE MARKET, BY REGION, 2018-2032 (USD THOUSAND)
TABLE 10 NORTH AMERICA POUCH FILLING MACHINES IN LIQUID FILLING MACHINE MARKET, BY REGION, 2018-2032 (UNITS)
TABLE 11 NORTH AMERICA INJECTABLE LIQUID VIALS FILLING MACHINES IN LIQUID FILLING MACHINE MARKET, BY REGION, 2018-2032 (USD THOUSAND)
TABLE 12 NORTH AMERICA INJECTABLE LIQUID VIALS FILLING MACHINES IN LIQUID FILLING MACHINE MARKET, BY REGION, 2018-2032 (UNITS)
TABLE 13 NORTH AMERICA PREFILLED SYRINGE FILLING MACHINES IN LIQUID FILLING MACHINE MARKET, BY REGION, 2018-2032 (USD THOUSAND)
TABLE 14 NORTH AMERICA PREFILLED SYRINGE FILLING MACHINES IN LIQUID FILLING MACHINE MARKET, BY REGION, 2018-2032 (USD THOUSAND)
TABLE 15 NORTH AMERICA OTHERS IN LIQUID FILLING MACHINE MARKET, BY REGION, 2018-2032 (USD THOUSAND)
TABLE 16 NORTH AMERICA OTHERS IN LIQUID FILLING MACHINE MARKET, BY REGION, 2018-2032 (UNITS)
TABLE 17 NORTH AMERICA LIQUID FILLING MACHINES MARKET, BY MACHINE TYPE, 2018-2032 (USD THOUSAND)
TABLE 18 NORTH AMERICA AUTOMATIC IN LIQUID FILLING MACHINES MARKET, BY REGION, 2018-2032 (USD THOUSAND)
TABLE 19 NORTH AMERICA AUTOMATIC IN LIQUID FILLING MACHINES MARKET, BY TYPE, 2018-2032 (USD THOUSAND)
TABLE 20 NORTH AMERICA SEMI-AUTOMATIC IN LIQUID FILLING MACHINES MARKET, BY REGION, 2018-2032 (USD THOUSAND)
TABLE 21 NORTH AMERICA MANUAL IN LIQUID FILLING MACHINES MARKET, BY REGION, 2018-2032 (USD THOUSAND)
TABLE 22 NORTH AMERICA LIQUID FILLING MACHINES MARKET, BY FILL TYPE, 2018-2032 (USD THOUSAND)
TABLE 23 NORTH AMERICA COLD FILL IN LIQUID FILLING MACHINES MARKET, BY REGION, 2018-2032 (USD THOUSAND)
TABLE 24 NORTH AMERICA ASEPTIC FILL IN LIQUID FILLING MACHINES MARKET, BY REGION, 2018-2032 (USD THOUSAND)
TABLE 25 NORTH AMERICA ASEPTIC FILL IN LIQUID FILLING MACHINES MARKET, BY TYPE, 2018-2032 (USD THOUSAND)
TABLE 26 NORTH AMERICA HOT/WARM FILL IN LIQUID FILLING MACHINES MARKET, BY REGION, 2018-2032 (USD THOUSAND)
TABLE 27 NORTH AMERICA LIQUID FILLING MACHINE MARKET, BY FILLING TECHNOLOGY, 2018-2032 (USD THOUSAND)
TABLE 28 NORTH AMERICA PISTON FILLING IN LIQUID FILLING MACHINES MARKET, BY REGION 2018-2032 (USD THOUSAND)
TABLE 29 NORTH AMERICA PUMP FILLING IN LIQUID FILLING MACHINE MARKET, BY REGION, 2018-2032 (USD THOUSAND)
TABLE 30 NORTH AMERICA VACUUM FILLING IN LIQUID FILLING MACHINE MARKET, BY REGION, 2018-2032 (USD THOUSAND)
TABLE 31 NORTH AMERICA GRAVITY FILLING IN LIQUID FILLING MACHINE MARKET, BY REGION, 2018-2032 (USD THOUSAND)
TABLE 32 NORTH AMERICA NET WEIGHT FILLING IN LIQUID FILLING MACHINE MARKET, BY REGION, 2018-2032 (USD THOUSAND)
TABLE 33 NORTH AMERICA OVER FLOW FILLING IN LIQUID FILLING MACHINE MARKET, BY REGION, 2018-2032 (USD THOUSAND)
TABLE 34 NORTH AMERICA CORROSIVE FILLING IN LIQUID FILLING MACHINE MARKET, BY REGION, 2018-2032 (USD THOUSAND)
TABLE 35 NORTH AMERICA OTHERS IN LIQUID FILING MACHINE MARKET, BY REGION, 2018-2032 (USD THOUSAND)
TABLE 36 NORTH AMERICA LIQUID FILING MACHINES MARKET, BY LIQUID TYPE, 2018-2032 (USD THOUSAND)
TABLE 37 NORTH AMERICA WATER-BASED LIQUID IN LIQUID FILLING MACHINES MARKET, BY REGION 2018-2032 (USD THOUSAND)
TABLE 38 NORTH AMERICA VISCOUS LIQUIDS IN LIQUID FILING MACHINE MARKET, BY REGION, 2018-2032 (USD THOUSAND)
TABLE 39 NORTH AMERICA OILS & LUBRICANTS IN LIQUID FILLING MACHINE MARKET, BY REGION, 2018-2032 (USD THOUSAND)
TABLE 40 NORTH AMERICA LIQUID FILLING MACHINES MARKET, BY CONTAINER TYPE, 2018-2032 (USD THOUSAND)
TABLE 41 NORTH AMERICA PLASTIC IN LIQUID FILLING MACHINES MARKET, BY REGION, 2018-2032 (USD THOUSAND)
TABLE 42 NORTH AMERICA PLASTIC IN LIQUID FILLING MACHINES MARKET, BY TYPE, 2018-2032 (USD THOUSAND)
TABLE 43 NORTH AMERICA GLASS IN LIQUID FILLING MACHINES MARKET, BY REGION, 2018-2032 (USD THOUSAND)
TABLE 44 NORTH AMERICA GLASS IN LIQUID FILLING MACHINES MARKET, BY TYPE, 2018-2032 (USD THOUSAND)
TABLE 45 NORTH AMERICA METAL IN LIQUID FILLING MACHINES MARKET, BY REGION, 2018-2032 (USD THOUSAND)
TABLE 46 NORTH AMERICA METAL IN LIQUID FILLING MACHINES MARKET, BY TYPE, 2018-2032 (USD THOUSAND)
TABLE 47 NORTH AMERICA LIQUID FILLING MACHINES MARKET, BY APPLICATION, 2018-2032 (USD THOUSAND)
TABLE 48 NORTH AMERICA FOOD & BEVERAGES IN LIQUID FILLING MACHINES MARKET, BY REGION, 2018-2032 (USD THOUSAND)
TABLE 49 NORTH AMERICA FOOD & BEVERAGES IN LIQUID FILLING MACHINES MARKET, BY TYPE, 2018-2032 (USD THOUSAND)
TABLE 50 NORTH AMERICA BEVERAGES IN LIQUID FILLING MACHINES MARKET, BY TYPE, 2018-2032 (USD THOUSAND)
TABLE 51 NORTH AMERICA ALCOHOL IN LIQUID FILLING MACHINES MARKET, BY TYPE, 2018-2032 (USD THOUSAND)
TABLE 52 NORTH AMERICA DAIRY PRODUCTS IN LIQUID FILLING MACHINES MARKET, BY TYPE, 2018-2032 (USD THOUSAND)
TABLE 53 NORTH AMERICA SAUCES & CONDIMENTS IN LIQUID FILLING MACHINES MARKET, BY TYPE, 2018-2032 (USD THOUSAND)
TABLE 54 NORTH AMERICA EDIBLE OILS IN LIQUID FILLING MACHINES MARKET, BY TYPE, 2018-2032 (USD THOUSAND)
TABLE 55 NORTH AMERICA CHEMICALS IN LIQUID FILLING MACHINES MARKET, BY REGION, 2018-2032 (USD THOUSAND)
TABLE 56 NORTH AMERICA CHEMICALS IN LIQUID FILLING MACHINES MARKET, BY TYPE, 2018-2032 (USD THOUSAND)
TABLE 57 NORTH AMERICA INDUSTRIAL CHEMICALS IN LIQUID FILLING MACHINES MARKET, BY TYPE, 2018-2032 (USD THOUSAND)
TABLE 58 NORTH AMERICA PETROCHEMICALS IN LIQUID FILLING MACHINES MARKET, BY TYPE, 2018-2032 (USD THOUSAND)
TABLE 59 NORTH AMERICA SPECIALTY CHEMICALS IN LIQUID FILLING MACHINES MARKET, BY TYPE, 2018-2032 (USD THOUSAND)
TABLE 60 NORTH AMERICA AGROCHEMICALS IN LIQUID FILLING MACHINES MARKET, BY TYPE, 2018-2032 (USD THOUSAND)
TABLE 61 NORTH AMERICA CLEANING & SANITATION CHEMICALS IN LIQUID FILLING MACHINES MARKET, BY TYPE, 2018-2032 (USD THOUSAND)
TABLE 62 NORTH AMERICA PHARMACEUTICALS & MEDICAL DEVICES IN LIQUID FILLING MACHINES MARKET, BY REGION, 2018-2032 (USD THOUSAND)
TABLE 63 NORTH AMERICA PHARMACEUTICALS & MEDICAL DEVICES IN LIQUID FILLING MACHINES MARKET, BY TYPE, 2018-2032 (USD THOUSAND)
TABLE 64 NORTH AMERICA INJECTABLE LIQUID FILLING MACHINES IN LIQUID FILLING MACHINES MARKET, BY TYPE, 2018-2032 (USD THOUSAND)
TABLE 65 NORTH AMERICA ORAL LIQUID FILLING MACHINES IN LIQUID FILLING MACHINES MARKET, BY TYPE, 2018-2032 (USD THOUSAND)
TABLE 66 NORTH AMERICA OPHTHALMIC LIQUID FILLING MACHINES IN LIQUID FILLING MACHINES MARKET, BY TYPE, 2018-2032 (USD THOUSAND)
TABLE 67 NORTH AMERICA NASAL LIQUID FILLING MACHINES IN LIQUID FILLING MACHINES MARKET, BY TYPE, 2018-2032 (USD THOUSAND)
TABLE 68 NORTH AMERICA NASAL LIQUID FILLING MACHINES IN LIQUID FILLING MACHINES MARKET, BY TYPE, 2018-2032 (USD THOUSAND)
TABLE 69 NORTH AMERICA BIOPHARMACEUTICAL FILLING MACHINES IN LIQUID FILLING MACHINES MARKET, BY TYPE, 2018-2032 (USD THOUSAND)
TABLE 70 NORTH AMERICA PERSONAL CARE & COSMETICS IN LIQUID FILLING MACHINES MARKET, BY REGION, 2018-2032 (USD THOUSAND)
TABLE 71 NORTH AMERICA PERSONAL CARE & COSMETICS IN LIQUID FILLING MACHINES MARKET, BY TYPE, 2018-2032 (USD THOUSAND)
TABLE 72 NORTH AMERICA FACE & BODY CARE IN LIQUID FILLING MACHINES MARKET, BY TYPE, 2018-2032 (USD THOUSAND)
TABLE 73 NORTH AMERICA HAIR CARE IN LIQUID FILLING MACHINES MARKET, BY TYPE, 2018-2032 (USD THOUSAND)
TABLE 74 NORTH AMERICA FRAGRANCE IN LIQUID FILLING MACHINES MARKET, BY TYPE, 2018-2032 (USD THOUSAND)
TABLE 75 NORTH AMERICA OTHERS IN LIQUID FILLING MACHINES MARKET, BY REGION, 2018-2032 (USD THOUSAND)
TABLE 76 NORTH AMERICA LIQUID FILLING MACHINES MARKET, BY COUNTRY, 2018-2032 (USD THOUSAND)
TABLE 77 NORTH AMERICA LIQUID FILLING MACHINES MARKET, BY COUNTRY, 2018-2032 (UNITS)
TABLE 78 NORTH AMERICA LIQUID FILLING MACHINES MARKET, BY PRODUCT TYPE, 2018-2032 (USD THOUSAND)
TABLE 79 NORTH AMERICA LIQUID FILLING MACHINES MARKET, BY PRODUCT TYPE, 2018-2032 (UNITS)
TABLE 80 NORTH AMERICA BOTTLING MACHINES IN LIQUID FILLING MACHINES MARKET, BY TYPE, 2018-2032 (USD THOUSAND)
TABLE 81 NORTH AMERICA CAPPING MACHINES IN LIQUID FILLING MACHINES MARKET, BY TYPE, 2018-2032 (USD THOUSAND)
TABLE 82 NORTH AMERICA LABELING MACHINES IN LIQUID FILLING MACHINES MARKET, BY TYPE, 2018-2032 (USD THOUSAND)
TABLE 83 NORTH AMERICA POUCH FILLING MACHINES IN LIQUID FILLING MACHINES MARKET, BY TYPE, 2018-2032 (USD THOUSAND)
TABLE 84 NORTH AMERICA INJECTABLE LIQUID VIALS FILLING MACHINES IN LIQUID FILLING MACHINES MARKET, BY TYPE, 2018-2032 (USD THOUSAND)
TABLE 85 NORTH AMERICA PREFILLED SYRINGE FILLING MACHINES IN LIQUID FILLING MACHINES MARKET, BY TYPE, 2018-2032 (USD THOUSAND)
TABLE 86 NORTH AMERICA OTHERS IN LIQUID FILLING MACHINES MARKET, BY TYPE, 2018-2032 (USD THOUSAND)
TABLE 87 NORTH AMERICA LIQUID FILLING MACHINES MARKET, BY MACHINE TYPE, 2018-2032 (USD THOUSAND)
TABLE 88 NORTH AMERICA AUTOMATIC IN LIQUID FILLING MACHINES MARKET, BY TYPE, 2018-2032 (USD THOUSAND)
TABLE 89 NORTH AMERICA LIQUID FILLING MACHINES MARKET, BY FILLING TECHNOLOGY, 2018-2032 (USD THOUSAND)
TABLE 90 NORTH AMERICA LIQUID FILLING MACHINES MARKET, BY LIQUID TYPE, 2018-2032 (USD THOUSAND)
TABLE 91 NORTH AMERICA LIQUID FILLING MACHINES MARKET, BY FILL TYPE, 2018-2032 (USD THOUSAND)
TABLE 92 NORTH AMERICA ASEPTIC FILL IN LIQUID FILLING MACHINES MARKET, BY TYPE, 2018-2032 (USD THOUSAND)
TABLE 93 NORTH AMERICA LIQUID FILLING MACHINES MARKET, BY CONTAINER TYPE, 2018-2032 (USD THOUSAND)
TABLE 94 NORTH AMERICA PLASTIC IN LIQUID FILLING MACHINES MARKET, BY TYPE, 2018-2032 (USD THOUSAND)
TABLE 95 NORTH AMERICA GLASS IN LIQUID FILLING MACHINES MARKET, BY TYPE, 2018-2032 (USD THOUSAND)
TABLE 96 NORTH AMERICA METAL IN LIQUID FILLING MACHINES MARKET, BY TYPE, 2018-2032 (USD THOUSAND)
TABLE 97 NORTH AMERICA LIQUID FILLING MACHINES MARKET, BY APPLICATION, 2018-2032 (USD THOUSAND)
TABLE 98 NORTH AMERICA FOOD & BEVERAGES IN LIQUID FILLING MACHINES MARKET, BY TYPE, 2018-2032 (USD THOUSAND)
TABLE 99 NORTH AMERICA BEVERAGES IN LIQUID FILLING MACHINES MARKET, BY TYPE, 2018-2032 (USD THOUSAND)
TABLE 100 NORTH AMERICA ALCOHOL IN LIQUID FILLING MACHINES MARKET, BY TYPE, 2018-2032 (USD THOUSAND)
TABLE 101 NORTH AMERICA DAIRY PRODUCTS IN LIQUID FILLING MACHINES MARKET, BY TYPE, 2018-2032 (USD THOUSAND)
TABLE 102 NORTH AMERICA SAUCES & CONDIMENTS IN LIQUID FILLING MACHINES MARKET, BY TYPE, 2018-2032 (USD THOUSAND)
TABLE 103 NORTH AMERICA EDIBLE OILS IN LIQUID FILLING MACHINES MARKET, BY TYPE, 2018-2032 (USD THOUSAND)
TABLE 104 NORTH AMERICA CHEMICALS IN LIQUID FILLING MACHINES MARKET, BY TYPE, 2018-2032 (USD THOUSAND)
TABLE 105 NORTH AMERICA INDUSTRIAL CHEMICALS IN LIQUID FILLING MACHINES MARKET, BY TYPE, 2018-2032 (USD THOUSAND)
TABLE 106 NORTH AMERICA PETROCHEMICALS IN LIQUID FILLING MACHINES MARKET, BY TYPE, 2018-2032 (USD THOUSAND)
TABLE 107 NORTH AMERICA SPECIALTY CHEMICALS IN LIQUID FILLING MACHINES MARKET, BY TYPE, 2018-2032 (USD THOUSAND)
TABLE 108 NORTH AMERICA AGROCHEMICALS IN LIQUID FILLING MACHINES MARKET, BY TYPE, 2018-2032 (USD THOUSAND)
TABLE 109 NORTH AMERICA CLEANING & SANITATION CHEMICALS IN LIQUID FILLING MACHINES MARKET, BY TYPE, 2018-2032 (USD THOUSAND)
TABLE 110 NORTH AMERICA PHARMACEUTICALS & MEDICAL DEVICES IN LIQUID FILLING MACHINES MARKET, BY TYPE, 2018-2032 (USD THOUSAND)
TABLE 111 NORTH AMERICA INJECTABLE LIQUID FILLING MACHINES IN LIQUID FILLING MACHINES MARKET, BY TYPE, 2018-2032 (USD THOUSAND)
TABLE 112 NORTH AMERICA ORAL LIQUID FILLING MACHINES IN LIQUID FILLING MACHINES MARKET, BY TYPE, 2018-2032 (USD THOUSAND)
TABLE 113 NORTH AMERICA OPHTHALMIC LIQUID FILLING MACHINES IN LIQUID FILLING MACHINES MARKET, BY TYPE, 2018-2032 (USD THOUSAND)
TABLE 114 NORTH AMERICA NASAL LIQUID FILLING MACHINES IN LIQUID FILLING MACHINES MARKET, BY TYPE, 2018-2032 (USD THOUSAND)
TABLE 115 NORTH AMERICA TOPICAL LIQUID FILLING MACHINES IN LIQUID FILLING MACHINES MARKET, BY TYPE, 2018-2032 (USD THOUSAND)
TABLE 116 NORTH AMERICA BIOPHARMACEUTICAL FILLING MACHINES IN LIQUID FILLING MACHINES MARKET, BY TYPE, 2018-2032 (USD THOUSAND)
TABLE 117 NORTH AMERICA PERSONAL CARE & COSMETICS IN LIQUID FILLING MACHINES MARKET, BY TYPE, 2018-2032 (USD THOUSAND)
TABLE 118 NORTH AMERICA FACE & BODY CARE IN LIQUID FILLING MACHINES MARKET, BY TYPE, 2018-2032 (USD THOUSAND)
TABLE 119 NORTH AMERICA HAIR CARE IN LIQUID FILLING MACHINES MARKET, BY TYPE, 2018-2032 (USD THOUSAND)
TABLE 120 NORTH AMERICA FRAGRANCE IN LIQUID FILLING MACHINES MARKET, BY TYPE, 2018-2032 (USD THOUSAND)
TABLE 121 U.S. LIQUID FILLING MACHINES MARKET, BY PRODUCT TYPE, 2018-2032 (USD THOUSAND)
TABLE 122 U.S. LIQUID FILLING MACHINES MARKET, BY PRODUCT TYPE, 2018-2032 (UNITS)
TABLE 123 U.S. BOTTLING MACHINES IN LIQUID FILLING MACHINES MARKET, BY TYPE, 2018-2032 (USD THOUSAND)
TABLE 124 U.S. CAPPING MACHINES IN LIQUID FILLING MACHINES MARKET, BY TYPE, 2018-2032 (USD THOUSAND)
TABLE 125 U.S. LABELING MACHINES IN LIQUID FILLING MACHINES MARKET, BY TYPE, 2018-2032 (USD THOUSAND)
TABLE 126 U.S. POUCH FILLING MACHINES IN LIQUID FILLING MACHINES MARKET, BY TYPE, 2018-2032 (USD THOUSAND)
TABLE 127 U.S. INJECTABLE LIQUID VIALS FILLING MACHINES IN LIQUID FILLING MACHINES MARKET, BY TYPE, 2018-2032 (USD THOUSAND)
TABLE 128 U.S. PREFILLED SYRINGE FILLING MACHINES IN LIQUID FILLING MACHINES MARKET, BY TYPE, 2018-2032 (USD THOUSAND)
TABLE 129 U.S. OTHERS IN LIQUID FILLING MACHINES MARKET, BY TYPE, 2018-2032 (USD THOUSAND)
TABLE 130 U.S. LIQUID FILLING MACHINES MARKET, BY MACHINE TYPE, 2018-2032 (USD THOUSAND)
TABLE 131 U.S. AUTOMATIC IN LIQUID FILLING MACHINES MARKET, BY TYPE, 2018-2032 (USD THOUSAND)
TABLE 132 U.S. LIQUID FILLING MACHINES MARKET, BY FILLING TECHNOLOGY, 2018-2032 (USD THOUSAND)
TABLE 133 U.S. LIQUID FILLING MACHINES MARKET, BY LIQUID TYPE, 2018-2032 (USD THOUSAND)
TABLE 134 U.S. LIQUID FILLING MACHINES MARKET, BY FILL TYPE, 2018-2032 (USD THOUSAND)
TABLE 135 U.S. ASEPTIC FILL IN LIQUID FILLING MACHINES MARKET, BY TYPE, 2018-2032 (USD THOUSAND)
TABLE 136 U.S. LIQUID FILLING MACHINES MARKET, BY CONTAINER TYPE, 2018-2032 (USD THOUSAND)
TABLE 137 U.S. PLASTIC IN LIQUID FILLING MACHINES MARKET, BY TYPE, 2018-2032 (USD THOUSAND)
TABLE 138 U.S. GLASS IN LIQUID FILLING MACHINES MARKET, BY TYPE, 2018-2032 (USD THOUSAND)
TABLE 139 U.S. METAL IN LIQUID FILLING MACHINES MARKET, BY TYPE, 2018-2032 (USD THOUSAND)
TABLE 140 U.S. LIQUID FILLING MACHINES MARKET, BY APPLICATION, 2018-2032 (USD THOUSAND)
TABLE 141 U.S. FOOD & BEVERAGES IN LIQUID FILLING MACHINES MARKET, BY TYPE, 2018-2032 (USD THOUSAND)
TABLE 142 U.S. BEVERAGES IN LIQUID FILLING MACHINES MARKET, BY TYPE, 2018-2032 (USD THOUSAND)
TABLE 143 U.S. ALCOHOL IN LIQUID FILLING MACHINES MARKET, BY TYPE, 2018-2032 (USD THOUSAND)
TABLE 144 U.S. DAIRY PRODUCTS IN LIQUID FILLING MACHINES MARKET, BY TYPE, 2018-2032 (USD THOUSAND)
TABLE 145 U.S. SAUCES & CONDIMENTS IN LIQUID FILLING MACHINES MARKET, BY TYPE, 2018-2032 (USD THOUSAND)
TABLE 146 U.S. EDIBLE OILS IN LIQUID FILLING MACHINES MARKET, BY TYPE, 2018-2032 (USD THOUSAND)
TABLE 147 U.S. CHEMICALS IN LIQUID FILLING MACHINES MARKET, BY TYPE, 2018-2032 (USD THOUSAND)
TABLE 148 U.S. INDUSTRIAL CHEMICALS IN LIQUID FILLING MACHINES MARKET, BY TYPE, 2018-2032 (USD THOUSAND)
TABLE 149 U.S. PETROCHEMICALS IN LIQUID FILLING MACHINES MARKET, BY TYPE, 2018-2032 (USD THOUSAND)
TABLE 150 U.S. SPECIALTY CHEMICALS IN LIQUID FILLING MACHINES MARKET, BY TYPE, 2018-2032 (USD THOUSAND)
TABLE 151 U.S. AGROCHEMICALS IN LIQUID FILLING MACHINES MARKET, BY TYPE, 2018-2032 (USD THOUSAND)
TABLE 152 U.S. CLEANING & SANITATION CHEMICALS IN LIQUID FILLING MACHINES MARKET, BY TYPE, 2018-2032 (USD THOUSAND)
TABLE 153 U.S. PHARMACEUTICALS & MEDICAL DEVICES IN LIQUID FILLING MACHINES MARKET, BY TYPE, 2018-2032 (USD THOUSAND)
TABLE 154 U.S. INJECTABLE LIQUID FILLING MACHINES IN LIQUID FILLING MACHINES MARKET, BY TYPE, 2018-2032 (USD THOUSAND)
TABLE 155 U.S. ORAL LIQUID FILLING MACHINES IN LIQUID FILLING MACHINES MARKET, BY TYPE, 2018-2032 (USD THOUSAND)
TABLE 156 U.S. OPHTHALMIC LIQUID FILLING MACHINES IN LIQUID FILLING MACHINES MARKET, BY TYPE, 2018-2032 (USD THOUSAND)
TABLE 157 U.S. NASAL LIQUID FILLING MACHINES IN LIQUID FILLING MACHINES MARKET, BY TYPE, 2018-2032 (USD THOUSAND)
TABLE 158 U.S. TOPICAL LIQUID FILLING MACHINES IN LIQUID FILLING MACHINES MARKET, BY TYPE, 2018-2032 (USD THOUSAND)
TABLE 159 U.S. BIOPHARMACEUTICAL FILLING MACHINES IN LIQUID FILLING MACHINES MARKET, BY TYPE, 2018-2032 (USD THOUSAND)
TABLE 160 U.S. PERSONAL CARE & COSMETICS IN LIQUID FILLING MACHINES MARKET, BY TYPE, 2018-2032 (USD THOUSAND)
TABLE 161 U.S. FACE & BODY CARE IN LIQUID FILLING MACHINES MARKET, BY TYPE, 2018-2032 (USD THOUSAND)
TABLE 162 U.S. HAIR CARE IN LIQUID FILLING MACHINES MARKET, BY TYPE, 2018-2032 (USD THOUSAND)
TABLE 163 U.S. FRAGRANCE IN LIQUID FILLING MACHINES MARKET, BY TYPE, 2018-2032 (USD THOUSAND)
TABLE 164 CANADA LIQUID FILLING MACHINES MARKET, BY PRODUCT TYPE, 2018-2032 (USD THOUSAND)
TABLE 165 CANADA LIQUID FILLING MACHINES MARKET, BY PRODUCT TYPE, 2018-2032 (UNITS)
TABLE 166 CANADA BOTTLING MACHINES IN LIQUID FILLING MACHINES MARKET, BY TYPE, 2018-2032 (USD THOUSAND)
TABLE 167 CANADA CAPPING MACHINES IN LIQUID FILLING MACHINES MARKET, BY TYPE, 2018-2032 (USD THOUSAND)
TABLE 168 CANADA LABELING MACHINES IN LIQUID FILLING MACHINES MARKET, BY TYPE, 2018-2032 (USD THOUSAND)
TABLE 169 CANADA POUCH FILLING MACHINES IN LIQUID FILLING MACHINES MARKET, BY TYPE, 2018-2032 (USD THOUSAND)
TABLE 170 CANADA INJECTABLE LIQUID VIALS FILLING MACHINES IN LIQUID FILLING MACHINES MARKET, BY TYPE, 2018-2032 (USD THOUSAND)
TABLE 171 CANADA PREFILLED SYRINGE FILLING MACHINES IN LIQUID FILLING MACHINES MARKET, BY TYPE, 2018-2032 (USD THOUSAND)
TABLE 172 CANADA OTHERS IN LIQUID FILLING MACHINES MARKET, BY TYPE, 2018-2032 (USD THOUSAND)
TABLE 173 CANADA LIQUID FILLING MACHINES MARKET, BY MACHINE TYPE, 2018-2032 (USD THOUSAND)
TABLE 174 CANADA AUTOMATIC IN LIQUID FILLING MACHINES MARKET, BY TYPE, 2018-2032 (USD THOUSAND)
TABLE 175 CANADA LIQUID FILLING MACHINES MARKET, BY FILLING TECHNOLOGY, 2018-2032 (USD THOUSAND)
TABLE 176 CANADA LIQUID FILLING MACHINES MARKET, BY LIQUID TYPE, 2018-2032 (USD THOUSAND)
TABLE 177 CANADA LIQUID FILLING MACHINES MARKET, BY FILL TYPE, 2018-2032 (USD THOUSAND)
TABLE 178 CANADA ASEPTIC FILL IN LIQUID FILLING MACHINES MARKET, BY TYPE, 2018-2032 (USD THOUSAND)
TABLE 179 CANADA LIQUID FILLING MACHINES MARKET, BY CONTAINER TYPE, 2018-2032 (USD THOUSAND)
TABLE 180 CANADA PLASTIC IN LIQUID FILLING MACHINES MARKET, BY TYPE, 2018-2032 (USD THOUSAND)
TABLE 181 CANADA GLASS IN LIQUID FILLING MACHINES MARKET, BY TYPE, 2018-2032 (USD THOUSAND)
TABLE 182 CANADA METAL IN LIQUID FILLING MACHINES MARKET, BY TYPE, 2018-2032 (USD THOUSAND)
TABLE 183 CANADA LIQUID FILLING MACHINES MARKET, BY APPLICATION, 2018-2032 (USD THOUSAND)
TABLE 184 CANADA FOOD & BEVERAGES IN LIQUID FILLING MACHINES MARKET, BY TYPE, 2018-2032 (USD THOUSAND)
TABLE 185 CANADA BEVERAGES IN LIQUID FILLING MACHINES MARKET, BY TYPE, 2018-2032 (USD THOUSAND)
TABLE 186 CANADA ALCOHOL IN LIQUID FILLING MACHINES MARKET, BY TYPE, 2018-2032 (USD THOUSAND)
TABLE 187 CANADA DAIRY PRODUCTS IN LIQUID FILLING MACHINES MARKET, BY TYPE, 2018-2032 (USD THOUSAND)
TABLE 188 CANADA SAUCES & CONDIMENTS IN LIQUID FILLING MACHINES MARKET, BY TYPE, 2018-2032 (USD THOUSAND)
TABLE 189 CANADA EDIBLE OILS IN LIQUID FILLING MACHINES MARKET, BY TYPE, 2018-2032 (USD THOUSAND)
TABLE 190 CANADA CHEMICALS IN LIQUID FILLING MACHINES MARKET, BY TYPE, 2018-2032 (USD THOUSAND)
TABLE 191 CANADA INDUSTRIAL CHEMICALS IN LIQUID FILLING MACHINES MARKET, BY TYPE, 2018-2032 (USD THOUSAND)
TABLE 192 CANADA PETROCHEMICALS IN LIQUID FILLING MACHINES MARKET, BY TYPE, 2018-2032 (USD THOUSAND)
TABLE 193 CANADA SPECIALTY CHEMICALS IN LIQUID FILLING MACHINES MARKET, BY TYPE, 2018-2032 (USD THOUSAND)
TABLE 194 CANADA AGROCHEMICALS IN LIQUID FILLING MACHINES MARKET, BY TYPE, 2018-2032 (USD THOUSAND)
TABLE 195 CANADA CLEANING & SANITATION CHEMICALS IN LIQUID FILLING MACHINES MARKET, BY TYPE, 2018-2032 (USD THOUSAND)
TABLE 196 CANADA PHARMACEUTICALS & MEDICAL DEVICES IN LIQUID FILLING MACHINES MARKET, BY TYPE, 2018-2032 (USD THOUSAND)
TABLE 197 CANADA INJECTABLE LIQUID FILLING MACHINES IN LIQUID FILLING MACHINES MARKET, BY TYPE, 2018-2032 (USD THOUSAND)
TABLE 198 CANADA ORAL LIQUID FILLING MACHINES IN LIQUID FILLING MACHINES MARKET, BY TYPE, 2018-2032 (USD THOUSAND)
TABLE 199 CANADA OPHTHALMIC LIQUID FILLING MACHINES IN LIQUID FILLING MACHINES MARKET, BY TYPE, 2018-2032 (USD THOUSAND)
TABLE 200 CANADA NASAL LIQUID FILLING MACHINES IN LIQUID FILLING MACHINES MARKET, BY TYPE, 2018-2032 (USD THOUSAND)
TABLE 201 CANADA TOPICAL LIQUID FILLING MACHINES IN LIQUID FILLING MACHINES MARKET, BY TYPE, 2018-2032 (USD THOUSAND)
TABLE 202 CANADA BIOPHARMACEUTICAL FILLING MACHINES IN LIQUID FILLING MACHINES MARKET, BY TYPE, 2018-2032 (USD THOUSAND)
TABLE 203 CANADA PERSONAL CARE & COSMETICS IN LIQUID FILLING MACHINES MARKET, BY TYPE, 2018-2032 (USD THOUSAND)
TABLE 204 CANADA FACE & BODY CARE IN LIQUID FILLING MACHINES MARKET, BY TYPE, 2018-2032 (USD THOUSAND)
TABLE 205 CANADA HAIR CARE IN LIQUID FILLING MACHINES MARKET, BY TYPE, 2018-2032 (USD THOUSAND)
TABLE 206 CANADA FRAGRANCE IN LIQUID FILLING MACHINES MARKET, BY TYPE, 2018-2032 (USD THOUSAND)
TABLE 207 MEXICO LIQUID FILLING MACHINES MARKET, BY PRODUCT TYPE, 2018-2032 (USD THOUSAND)
TABLE 208 MEXICO LIQUID FILLING MACHINES MARKET, BY PRODUCT TYPE, 2018-2032 (UNITS)
TABLE 209 MEXICO BOTTLING MACHINES IN LIQUID FILLING MACHINES MARKET, BY TYPE, 2018-2032 (USD THOUSAND)
TABLE 210 MEXICO CAPPING MACHINES IN LIQUID FILLING MACHINES MARKET, BY TYPE, 2018-2032 (USD THOUSAND)
TABLE 211 MEXICO LABELING MACHINES IN LIQUID FILLING MACHINES MARKET, BY TYPE, 2018-2032 (USD THOUSAND)
TABLE 212 MEXICO POUCH FILLING MACHINES IN LIQUID FILLING MACHINES MARKET, BY TYPE, 2018-2032 (USD THOUSAND)
TABLE 213 MEXICO INJECTABLE LIQUID VIALS FILLING MACHINES IN LIQUID FILLING MACHINES MARKET, BY TYPE, 2018-2032 (USD THOUSAND)
TABLE 214 MEXICO PREFILLED SYRINGE FILLING MACHINES IN LIQUID FILLING MACHINES MARKET, BY TYPE, 2018-2032 (USD THOUSAND)
TABLE 215 MEXICO OTHERS IN LIQUID FILLING MACHINES MARKET, BY TYPE, 2018-2032 (USD THOUSAND)
TABLE 216 MEXICO LIQUID FILLING MACHINES MARKET, BY MACHINE TYPE, 2018-2032 (USD THOUSAND)
TABLE 217 MEXICO AUTOMATIC IN LIQUID FILLING MACHINES MARKET, BY TYPE, 2018-2032 (USD THOUSAND)
TABLE 218 MEXICO LIQUID FILLING MACHINES MARKET, BY FILLING TECHNOLOGY, 2018-2032 (USD THOUSAND)
TABLE 219 MEXICO LIQUID FILLING MACHINES MARKET, BY LIQUID TYPE, 2018-2032 (USD THOUSAND)
TABLE 220 MEXICO LIQUID FILLING MACHINES MARKET, BY FILL TYPE, 2018-2032 (USD THOUSAND)
TABLE 221 MEXICO ASEPTIC FILL IN LIQUID FILLING MACHINES MARKET, BY TYPE, 2018-2032 (USD THOUSAND)
TABLE 222 MEXICO LIQUID FILLING MACHINES MARKET, BY CONTAINER TYPE, 2018-2032 (USD THOUSAND)
TABLE 223 MEXICO PLASTIC IN LIQUID FILLING MACHINES MARKET, BY TYPE, 2018-2032 (USD THOUSAND)
TABLE 224 MEXICO GLASS IN LIQUID FILLING MACHINES MARKET, BY TYPE, 2018-2032 (USD THOUSAND)
TABLE 225 MEXICO METAL IN LIQUID FILLING MACHINES MARKET, BY TYPE, 2018-2032 (USD THOUSAND)
TABLE 226 MEXICO LIQUID FILLING MACHINES MARKET, BY APPLICATION, 2018-2032 (USD THOUSAND)
TABLE 227 MEXICO FOOD & BEVERAGES IN LIQUID FILLING MACHINES MARKET, BY TYPE, 2018-2032 (USD THOUSAND)
TABLE 228 MEXICO BEVERAGES IN LIQUID FILLING MACHINES MARKET, BY TYPE, 2018-2032 (USD THOUSAND)
TABLE 229 MEXICO ALCOHOL IN LIQUID FILLING MACHINES MARKET, BY TYPE, 2018-2032 (USD THOUSAND)
TABLE 230 MEXICO DAIRY PRODUCTS IN LIQUID FILLING MACHINES MARKET, BY TYPE, 2018-2032 (USD THOUSAND)
TABLE 231 MEXICO SAUCES & CONDIMENTS IN LIQUID FILLING MACHINES MARKET, BY TYPE, 2018-2032 (USD THOUSAND)
TABLE 232 MEXICO EDIBLE OILS IN LIQUID FILLING MACHINES MARKET, BY TYPE, 2018-2032 (USD THOUSAND)
TABLE 233 MEXICO CHEMICALS IN LIQUID FILLING MACHINES MARKET, BY TYPE, 2018-2032 (USD THOUSAND)
TABLE 234 MEXICO INDUSTRIAL CHEMICALS IN LIQUID FILLING MACHINES MARKET, BY TYPE, 2018-2032 (USD THOUSAND)
TABLE 235 MEXICO PETROCHEMICALS IN LIQUID FILLING MACHINES MARKET, BY TYPE, 2018-2032 (USD THOUSAND)
TABLE 236 MEXICO SPECIALTY CHEMICALS IN LIQUID FILLING MACHINES MARKET, BY TYPE, 2018-2032 (USD THOUSAND)
TABLE 237 MEXICO AGROCHEMICALS IN LIQUID FILLING MACHINES MARKET, BY TYPE, 2018-2032 (USD THOUSAND)
TABLE 238 MEXICO CLEANING & SANITATION CHEMICALS IN LIQUID FILLING MACHINES MARKET, BY TYPE, 2018-2032 (USD THOUSAND)
TABLE 239 MEXICO PHARMACEUTICALS & MEDICAL DEVICES IN LIQUID FILLING MACHINES MARKET, BY TYPE, 2018-2032 (USD THOUSAND)
TABLE 240 MEXICO INJECTABLE LIQUID FILLING MACHINES IN LIQUID FILLING MACHINES MARKET, BY TYPE, 2018-2032 (USD THOUSAND)
TABLE 241 MEXICO ORAL LIQUID FILLING MACHINES IN LIQUID FILLING MACHINES MARKET, BY TYPE, 2018-2032 (USD THOUSAND)
TABLE 242 MEXICO OPHTHALMIC LIQUID FILLING MACHINES IN LIQUID FILLING MACHINES MARKET, BY TYPE, 2018-2032 (USD THOUSAND)
TABLE 243 MEXICO NASAL LIQUID FILLING MACHINES IN LIQUID FILLING MACHINES MARKET, BY TYPE, 2018-2032 (USD THOUSAND)
TABLE 244 MEXICO TOPICAL LIQUID FILLING MACHINES IN LIQUID FILLING MACHINES MARKET, BY TYPE, 2018-2032 (USD THOUSAND)
TABLE 245 MEXICO BIOPHARMACEUTICAL FILLING MACHINES IN LIQUID FILLING MACHINES MARKET, BY TYPE, 2018-2032 (USD THOUSAND)
TABLE 246 MEXICO PERSONAL CARE & COSMETICS IN LIQUID FILLING MACHINES MARKET, BY TYPE, 2018-2032 (USD THOUSAND)
TABLE 247 MEXICO FACE & BODY CARE IN LIQUID FILLING MACHINES MARKET, BY TYPE, 2018-2032 (USD THOUSAND)
TABLE 248 MEXICO HAIR CARE IN LIQUID FILLING MACHINES MARKET, BY TYPE, 2018-2032 (USD THOUSAND)
TABLE 249 MEXICO FRAGRANCE IN LIQUID FILLING MACHINES MARKET, BY TYPE, 2018-2032 (USD THOUSAND)
List of Figure
FIGURE 1 NORTH AMERICA LIQUID FILLING MACHINES MARKET: SEGMENTATION
FIGURE 2 NORTH AMERICA LIQUID FILLING MACHINES MARKET: DATA TRIANGULATION
FIGURE 3 NORTH AMERICA LIQUID FILLING MACHINES MARKET: DROC ANALYSIS
FIGURE 4 NORTH AMERICA LIQUID FILLING MACHINES MARKET: NORTH AMERICA VS. REGIONAL MARKET ANALYSIS
FIGURE 5 NORTH AMERICA LIQUID FILLING MACHINES MARKET: COMPANY RESEARCH ANALYSIS
FIGURE 6 NORTH AMERICA LIQUID FILLING MACHINES MARKET: INTERVIEW DEMOGRAPHICS
FIGURE 7 NORTH AMERICA LIQUID FILLING MACHINES MARKET: DBMR MARKET POSITION GRID
FIGURE 8 NORTH AMERICA LIQUID FILLING MACHINES MARKET: DBMR MARKET POSITION GRID
FIGURE 9 NORTH AMERICA LIQUID FILLING MACHINES MARKET: VENDOR SHARE ANALYSIS
FIGURE 10 NORTH AMERICA LIQUID FILLING MACHINES MARKET: MULTIVARIATE MODELING
FIGURE 11 NORTH AMERICA LIQUID FILLING MACHINES MARKET: PRODUCT TYPE TIMELINE CURVE
FIGURE 12 NORTH AMERICA LIQUID FILLING MACHINES MARKET: APPLICATION COVERAGE GRID
FIGURE 13 NORTH AMERICA LIQUID FILLING MACHINES MARKET: SEGMENTATION
FIGURE 14 SEVEN SEGMENTS COMPRISE THE NORTH AMERICA LIQUID FILLING MACHINES MARKET, BY PRODUCT TYPE (2024)
FIGURE 15 NORTH AMERICA LIQUID FILLING MACHINES MARKET: EXECUTIVE SUMMARY
FIGURE 16 STRATEGIC DECISIONS
FIGURE 17 GROWING DEMAND FOR PACKAGED BEVERAGES, PHARMACEUTICALS, AND PERSONAL CARE PRODUCTS ARE EXPECTED TO DRIVE THE NORTH AMERICA LIQUID FILLING MACHINES MARKET DURING THE FORECAST PERIOD OF 2025 TO 2032
FIGURE 18 BOTTLING MACHINES SEGMENT IS EXPECTED TO ACCOUNT FOR THE LARGEST SHARE OF THE NORTH AMERICA LIQUID FILLING MACHINES MARKET IN 2025 & 2032
FIGURE 19 TOTAL PATENTS IN THE LIQUID FILLING MACHINE
FIGURE 20 VALUE CHAIN OF NORTH AMERICA LIQUID FILLING MACHINES MARKET
FIGURE 21 DRIVERS, RESTRAINTS, OPPORTUNITIES AND CHALLENGES OF NORTH AMERICA LIQUID FILLING MACHINES MARKET
FIGURE 22 NORTH AMERICA LIQUID FILLING MACHINE MARKET: BY PRODUCT TYPE, 2024 (USD THOUSAND)
FIGURE 23 NORTH AMERICA LIQUID FILLING MACHINES MARKET: BY MACHINE TYPE, 2024
FIGURE 24 NORTH AMERICA LIQUID FILLING MACHINES MARKET: BY FILL TYPE, 2024
FIGURE 25 NORTH AMERICA LIQUID FILLING MACHINE MARKET: BY FILLING TECHNOLOGY, 2024 (USD THOUSAND)
FIGURE 26 NORTH AMERICA LIQUID FILING MACHINES MARKET: BY LIQUID TYPE, 2024
FIGURE 27 NORTH AMERICA LIQUID FILLING MACHINES MARKET: BY CONTAINER TYPE, 2024
FIGURE 28 NORTH AMERICA LIQUID FILLING MACHINES MARKET: BY APPLICATION, 2024
FIGURE 29 NORTH AMERICA LIQUID FILLING MACHINES MARKET: SNAPSHOT (2024)
FIGURE 30 NORTH AMERICA LIQUID FILLING MACHINES MARKET: COMPANY SHARE 2024 (%)
North America Liquid Filling Machines Market, Supply Chain Analysis and Ecosystem Framework
To support market growth and help clients navigate the impact of geopolitical shifts, DBMR has integrated in-depth supply chain analysis into its North America Liquid Filling Machines Market research reports. This addition empowers clients to respond effectively to global changes affecting their industries. The supply chain analysis section includes detailed insights such as North America Liquid Filling Machines Market consumption and production by country, price trend analysis, the impact of tariffs and geopolitical developments, and import and export trends by country and HSN code. It also highlights major suppliers with data on production capacity and company profiles, as well as key importers and exporters. In addition to research, DBMR offers specialized supply chain consulting services backed by over a decade of experience, providing solutions like supplier discovery, supplier risk assessment, price trend analysis, impact evaluation of inflation and trade route changes, and comprehensive market trend analysis.
Data collection and base year analysis are done using data collection modules with large sample sizes. The stage includes obtaining market information or related data through various sources and strategies. It includes examining and planning all the data acquired from the past in advance. It likewise envelops the examination of information inconsistencies seen across different information sources. The market data is analysed and estimated using market statistical and coherent models. Also, market share analysis and key trend analysis are the major success factors in the market report. To know more, please request an analyst call or drop down your inquiry.
The key research methodology used by DBMR research team is data triangulation which involves data mining, analysis of the impact of data variables on the market and primary (industry expert) validation. Data models include Vendor Positioning Grid, Market Time Line Analysis, Market Overview and Guide, Company Positioning Grid, Patent Analysis, Pricing Analysis, Company Market Share Analysis, Standards of Measurement, Global versus Regional and Vendor Share Analysis. To know more about the research methodology, drop in an inquiry to speak to our industry experts.
Data Bridge Market Research is a leader in advanced formative research. We take pride in servicing our existing and new customers with data and analysis that match and suits their goal. The report can be customized to include price trend analysis of target brands understanding the market for additional countries (ask for the list of countries), clinical trial results data, literature review, refurbished market and product base analysis. Market analysis of target competitors can be analyzed from technology-based analysis to market portfolio strategies. We can add as many competitors that you require data about in the format and data style you are looking for. Our team of analysts can also provide you data in crude raw excel files pivot tables (Fact book) or can assist you in creating presentations from the data sets available in the report.


