
North America Lubricants Market
Market Size in USD Billion
 USD
30.19 Billion
USD
44.42 Billion
2024
2032
USD
30.19 Billion
USD
44.42 Billion
2024
2032
| 2025 - 2032 | |
| USD 30.19 Billion | |
| USD 44.42 Billion | |
| % | |
|
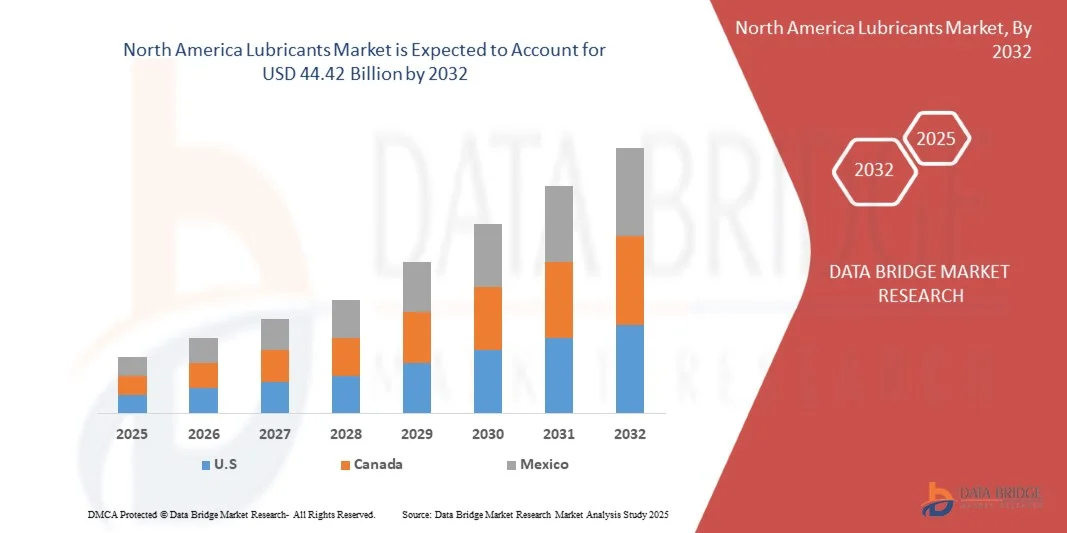
North America Lubricants Market Size
- The North America Lubricants Market was valued at USD 30.19 Billion in 2024 and is expected to reach USD 44.42 Billion by 2032
- During the forecast period of 2025 to 2032 the market is likely to grow at a CAGR of 5.1%, primarily driven by the Rising use of CHO cells in the genetic study.
- The growth of the North America Lubricants Market is driven by factors such as increasing industrialization, rising demand for high-performance automotive and industrial lubricants, technological advancements in synthetic and bio-based formulations, and the expansion of manufacturing and transportation sectors worldwide.
North America Lubricants Market Analysis
- Lubricants are essential substances used to reduce friction between moving surfaces, minimize wear and tear, and enhance the efficiency and lifespan of machinery and engines. They play a crucial role across various industries including automotive, aerospace, marine, industrial machinery, and energy production. Modern lubricants are formulated with additives that improve viscosity, oxidation stability, corrosion resistance, and thermal performance.
- One of the primary applications of lubricants is in the automotive sector, where they are used in engine oils, transmission fluids, and greases to ensure smooth operation, fuel efficiency, and reduced emissions. The growing shift towards electric vehicles (EVs) is also driving the development of specialized e-lubricants designed for cooling and protecting electric drivetrains and components. In industrial applications, lubricants are essential for metalworking, hydraulics, and heavy-duty machinery, ensuring consistent performance and reduced maintenance costs.
- In 2025, the Engine Oil segment is expected to dominate the market with a 32.05% market share due to the increasing production of vehicles, rising demand for synthetic lubricants offering enhanced performance, and the growing focus on energy-efficient and environmentally sustainable lubrication solutions.
Report Scope and North America Lubricants Market Segmentation
|
Attributes |
North America Lubricant Key Market Insights |
|
Segments Covered |
|
|
Countries Covered |
North America
|
|
Key Market Players |
|
|
Market Opportunities |
|
|
Value Added Data Infosets |
In addition to the insights on market scenarios such as market value, growth rate, segmentation, geographical coverage, and major players, the market reports curated by the Data Bridge Market Research also include import export analysis, production capacity overview, production consumption analysis, price trend analysis, climate change scenario, supply chain analysis, value chain analysis, raw material/consumables overview, vendor selection criteria, PESTLE Analysis, Porter Analysis, and regulatory framework. |
North America Lubricants Market Trends
“Growing Integration of Artificial Intelligence (AI) in Lubricant Formulation and Manufacturing”
- One prominent trend in the North America Lubricants Market is the increasing integration of artificial intelligence (AI) in lubricant formulation, production, and performance optimization.
- AI and machine learning technologies are being utilized to analyze complex datasets, predict lubricant behavior under varying operating conditions, and design advanced formulations with enhanced thermal stability, viscosity, and wear protection.
- For instance, predictive AI models can simulate lubricant performance in engines or industrial machinery, enabling manufacturers to optimize formulations without extensive physical testing.
- This technology helps reduce research and development time, minimize production costs, and improve the overall quality and consistency of lubricants.
- The adoption of AI-driven predictive maintenance systems in automotive and industrial sectors also supports the efficient use of lubricants, extending equipment life and reducing downtime.
- The growing integration of AI is thus transforming lubricant production and performance management, providing manufacturers with a competitive advantage through innovation, efficiency, and sustainability.
North America Lubricants Market Dynamics
Driver
“Rising Use of Advanced Materials and Additive Technologies in Lubricant Development”
- The increasing application of advanced materials science and additive chemistry is emerging as a key driver for the North America Lubricants Market. As nanotechnology, synthetic chemistry, and tribology research continue to evolve, lubricants are no longer viewed merely as friction-reducing fluids—they are becoming engineered solutions designed to enhance performance, energy efficiency, and sustainability across industries.
- This shift is expanding demand across three interconnected market dimensions: (1) Formulation innovation—the use of nanoparticles, esters, and ionic liquids to develop next-generation lubricants with superior thermal and oxidative stability; (2) Performance optimization—integration of AI modeling, rheological analysis, and real-time performance monitoring to predict lubricant behavior under extreme conditions; and (3) Sustainability and circularity—increasing R&D investment in biodegradable, low-toxicity, and renewable base oils to meet environmental regulations and corporate sustainability goals.
- In short, the advancement of material and additive technologies is fueling an expanding ecosystem that includes chemical suppliers, additive manufacturers, R&D labs, testing services, and digital monitoring solutions—broadening both the scope and commercial potential of lubricant innovation.
- For instance, in early 2025, several lubricant producers announced the incorporation of graphene-based and boron nitride nanomaterials into industrial lubricants, improving wear resistance and heat dissipation. Similarly, new bio-based ester formulations have demonstrated enhanced biodegradability and performance parity with conventional synthetics, reinforcing the market shift toward sustainable materials.
- The rising use of advanced additives and engineered materials is not only strengthening the performance and environmental profile of lubricants but also transforming them into strategic enablers for efficiency, equipment reliability, and decarbonization across automotive, manufacturing, and energy sectors.
Opportunity
“Continuous Development of Lubrication and Additive Technologies”
- Continuous advances in lubrication and additive technologies are creating new growth opportunities for the North America Lubricants Market. Innovations in synthetic chemistry, nanotechnology, and tribological engineering—combined with digital monitoring and AI-driven formulation optimization—are enhancing lubricant efficiency, durability, and environmental performance across industries.
- Improvements in base oil formulation (Group III, IV, and bio-based oils), as well as in additive packages that provide superior oxidation stability, anti-wear properties, and thermal control, are enabling next-generation lubricants designed for high-performance automotive, aerospace, and industrial applications.
- For instance, in 2024, TotalEnergies and Michelin announced a joint project to develop 100% renewable bio-based lubricants, supporting carbon-neutral goals and advancing sustainable product development. Similarly, ExxonMobil introduced AI-assisted formulation platforms that predict lubricant performance under various mechanical and thermal stresses, reducing R&D time and improving precision blending.
- These initiatives highlight that continuous technological development in lubricant chemistry and manufacturing is no longer limited to incremental performance improvements—it is being accelerated by collaborative innovation among major energy companies, chemical suppliers, and equipment manufacturers. This coordinated effort is reshaping North America production capabilities, improving energy efficiency, and supporting the transition toward sustainable and high-performance lubrication solutions.
Restraint/Challenge
“High Cost of Synthetic and Bio-Based Lubricant Production as a Market Restraint”
- The high production and formulation costs associated with synthetic and bio-based lubricants represent a significant restraint on the North America Lubricants Market. While these advanced lubricants offer superior thermal stability, oxidation resistance, and extended service life, their manufacturing involves costly raw materials, complex refining processes, and specialized blending technologies—resulting in higher end-user prices compared to conventional mineral-based lubricants.
- Capital-intensive production infrastructure, R&D investments in additive formulation, and the need for precision blending and quality assurance further raise operating costs for lubricant manufacturers. Additionally, fluctuating crude oil prices, volatility in base oil supply chains, and the limited availability of high-quality bio-based feedstocks add to the overall cost burden.
- These economic pressures compress profit margins, restrict adoption in cost-sensitive industrial and automotive segments, and create barriers for small and mid-sized manufacturers. Moreover, compliance with evolving environmental and performance standards (such as REACH, EPA, and Euro VI regulations) adds to production complexity and cost.
- For instance, in 2024, the European Lubricants Industry Directorate (ELID) reported that the transition toward low-emission, biodegradable, and high-efficiency lubricants has led to a 20–30% cost increase in base-stock procurement and additive development compared to conventional lubricants. Similarly, several industry assessments by API and SAE International have highlighted that the production of Group IV and V synthetic base oils involves complex chemical synthesis and energy-intensive processes, contributing to elevated pricing levels.
- Despite being vital for high-performance and environmentally sustainable operations, synthetic and bio-based lubricants remain significantly constrained by their high cost structure. The need for advanced materials, skilled workforce, stringent formulation standards, and high R&D expenditure continues to limit affordability and large-scale adoption, especially in emerging markets
North America Lubricants Market Scope
The market is segmented on the basis product, sales channel, base oil, end use.
|
Segmentation |
Sub-Segmentation |
|
By Product |
|
|
By Base oil |
|
|
By Sales Channel
|
|
|
By End Use |
|
North America Lubricants Market Regional Analysis
“U.S. is the Dominant Region in the Lubricants”
- U.S. holds the largest share in the North America Lubricants Market, driven by rapid industrialization, expanding automotive and manufacturing sectors, and the strong presence of both multinational and regional lubricant manufacturers.
- U.S. contribute significantly to regional dominance due to rising vehicle ownership, large-scale industrial operations, and increasing demand for high-performance and synthetic lubricants.
- Supportive government policies promoting energy efficiency, environmental sustainability, and domestic production capacity further accelerate market growth. Moreover, strategic collaborations between North America and local players, technological advancements in synthetic and bio-based lubricant formulations, and expanding blending and distribution networks continue to boost market expansion across the region.
“U.S. is Projected to Register the Highest Growth Rate”
- U.S. holds the largest share in the North America Lubricants Market, driven by rapid industrialization, expanding automotive production, and strong economic growth across emerging economies. The region serves as a North America manufacturing hub, with increasing demand for high-performance lubricants across automotive, industrial machinery, construction, and marine sectors.
- U.S. contribute significantly to the region’s dominance, supported by growing vehicle ownership, large-scale infrastructure development, and expansion of industrial operations. Continuous investment in refining capacity and lubricant blending plants by key players further enhances regional production capabilities.
- Moreover, the presence of leading market participants—including Shell, ExxonMobil, BP, Indian Oil Corporation, and Sinopec—along with regional companies such as ENEOS, GS Caltex, and PTT, has strengthened supply networks and improved product availability.
- Technological advancements in synthetic and bio-based lubricants, coupled with government initiatives promoting energy efficiency and sustainable manufacturing, are further driving market growth in Asia Pacific. The region’s cost-effective production environment, rising consumer awareness, and expanding automotive aftermarket are expected to maintain its leading position in the North America Lubricants Market throughout the forecast period.
North America Lubricants Market Share
The market competitive landscape provides details by competitor. Details included are company overview, company financials, revenue generated, market potential, investment in research and development, new market initiatives, North America presence, production sites and facilities, production capacities, company strengths and weaknesses, product launch, product width and breadth, application dominance. The above data points provided are only related to the companies' focus related to market.
The Major Market Leaders Operating in the Market Are:
- Shell PLC (U.K.)
- Chevron Corporation (U.S.)
- China National Petroleum Corporation (CNPC) (China)
- PTT Public Company Limited (Thailand)
- Eni S.p.A. (Italy)
- China Petroleum & Chemical Corporation (China)
- Exxon Mobil Corporation (U.S.)
- BP p.l.c. (U.K.)
- TotalEnergies (France)
- ENEOS Corporation (Japan)
- Idemitsu Kosan Co., Ltd. (Japan)
- PT Pertamina Lubricants (Indonesia)
- ROSNEFT (Russia)
- FUCHS (Germany)
- Indian Oil Corporation Ltd. (India)
- Valvoline (U.S.)
- GS Caltex Corporation (South Korea)
- Motul (France)
- LUKOIL (Russia)
- Phillips 66 (U.S.)
- Schaeffer (U.S.)
- Gulf Oil (U.A.E.)
- PETRONAS (Malaysia)
- BECHEM (Germany)
- Quaker Houghton (U.S.)
- Hardcastle Petrofer (India)
- HP Lubricants (India)
- Terpel (Colombia)
Latest Developments in North America Lubricants
- In July 2025, Shell Lubricants India acquired Raj Petro Specialities Pvt. Ltd., expanding its industrial and automotive lubricants portfolio and strengthening market reach in India.
- In June 2025, Eni Sustainable Mobility S.p.A. (via its parent Eni S.p.A.) signed a strategic Letter of Intent with BMW Italia to collaborate on road-transport decarbonisation — combining bio-fuels (notably HVO from 100% renewable feedstocks) and expanding electric mobility charging infrastructure under the jointly-branded network.
- In April 2025, Idemitsu Kosan completed the construction to increase the capacity of its Plant 1 in Ichihara City, Chiba Prefecture. This small pilot facility is dedicated to the mass production of solid electrolytes, essential materials for all-solid-state batteries. The project received support via METI’s subsidy for grid-scale storage projects. The initiative aims to contribute to the evolution of electric vehicles and the creation of a resource recycling society.
- In November 2024, PTT Lubricants, a flagship lubricant brand of PTT Oil and Retail Business (OR) in Thailand, announced a strategic collaboration with PT Sumber Suwarna Unisindo (SUN‑D) to bolster its market presence in Indonesia. The partnership is intended to ensure the supply of high‑quality PTT lubricant products to Indonesian customers and to provide robust after‑sales services. Indonesia was specifically identified as a rapidly growing market in the automotive sector, making it a key target in PTT Lubricants’ international expansion strategy.
- In June 2024, GS Caltex signed a memorandum of understanding with Summit Cosmetics (Japan) to supply its eco-friendly ingredient “GreenDiol” North Americaly, leveraging Summit’s network in North America, Europe and Asia, accelerating GS Caltex’s expansion in the white-bio and sustainable cosmetics segment.
SKU-

- Interactive Data Analysis Dashboard
- Company Analysis Dashboard for high growth potential opportunities
- Research Analyst Access for customization & queries
- Competitor Analysis with Interactive dashboard
- Latest News, Updates & Trend analysis
- Harness the Power of Benchmark Analysis for Comprehensive Competitor Tracking
Table of Content
1 INTRODUCTION
1.1 OBJECTIVES OF THE STUDY
1.2 MARKET DEFINITION
1.3 OVERVIEW OF THE NORTH AMERICA LUBRICANT MARKET
1.4 LIMITATIONS
1.5 MARKETS COVERED
2 MARKET SEGMENTATION
2.1 MARKETS COVERED
2.2 GEOGRAPHICAL SCOPE
2.3 YEARS CONSIDERED FOR THE STUDY
2.4 CURRENCY AND PRICING
2.5 DBMR TRIPOD DATA VALIDATION MODEL
2.6 MULTIVARIATE MODELLING
2.7 PRIMARY INTERVIEWS WITH KEY OPINION LEADERS
2.8 DBMR MARKET POSITION GRID
2.9 VENDOR SHARE ANALYSIS
2.1 SECONDARY SOURCES
2.11 ASSUMPTIONS
3 EXECUTIVE SUMMARY
4 PREMIUM INSIGHTS
4.1 PORTER’S FIVE FORCES
4.2 PESTEL ANALYSIS
4.3 TECHNOLOGICAL ADVANCEMENT BY MANUFACTURERS
4.3.1 OVERVIEW
4.3.2 ADVANCED BASE OIL TECHNOLOGIES
4.3.3 ADDITIVE CHEMISTRY INNOVATION
4.3.4 SMART AND FUNCTIONAL LUBRICANTS
4.3.5 DIGITALIZATION AND PROCESS AUTOMATION
4.3.6 ELECTRIFICATION AND EV-COMPATIBLE LUBRICANTS
4.3.7 SUSTAINABILITY AND CIRCULAR ECONOMY INITIATIVES
4.3.8 ADDITIVE MANUFACTURING AND TESTING INNOVATIONS
4.3.9 COLLABORATION AND R&D TRENDS
4.3.10 OUTLOOK
4.4 PRODUCTION AND CONSUMPTION ANALYSIS
4.4.1 NORTH AMERICA PRODUCTION OVERVIEW
4.4.2 REGIONAL PRODUCTION DISTRIBUTION
4.4.3 CONSUMPTION PATTERNS
4.4.4 TRADE FLOW AND SUPPLY BALANCE
4.4.5 INDUSTRIAL AND AUTOMOTIVE SEGMENT ANALYSIS
4.4.6 KEY TRENDS IMPACTING PRODUCTION AND CONSUMPTION
4.5 SUPPLY CHAIN ANALYSIS – NORTH AMERICA LUBRICANTS MARKET
4.5.1 OVERVIEW
4.5.2 LOGISTIC COST SCENARIO
4.5.3 IMPORTANCE OF LOGISTICS SERVICE PROVIDERS
4.5.4 CONCLUSION
4.6 CLIMATE CHANGE SCENARIO
4.6.1 ENVIRONMENTAL CONCERNS
4.6.2 INDUSTRY RESPONSE
4.6.3 GOVERNMENT’S ROLE
4.6.4 ANALYST RECOMMENDATIONS
4.6.5 CONCLUSION
4.7 PRICING ANALYSIS
4.7.1 INTRODUCTION
4.7.2 PRICING ANALYSIS
4.7.3 CONCLUSION
4.8 RAW MATERIAL COVERAGE
4.8.1 BASE OILS
4.8.2 ADDITIVE PACKAGES
4.8.3 SYNTHETIC ESTERS
4.8.4 POLYALKYLENE GLYCOLS (PAGS)
4.8.5 VEGETABLE AND BIO-BASED OILS
4.8.6 THICKENERS AND SOAP COMPLEXES (FOR GREASES)
4.8.7 SOLVENTS AND PROCESSING AIDS
4.9 VENDOR SELECTION CRITERIA – NORTH AMERICA LUBRICANTS MARKET
4.9.1 OVERVIEW
4.9.2 REGULATORY AND PRODUCT STEWARDSHIP COMPLIANCE
4.9.3 MANAGEMENT SYSTEMS AND GOVERNANCE
4.9.4 PRODUCT PERFORMANCE, SAFETY & SUSTAINABLE FORMULATION
4.9.5 LIFE-CYCLE ASSESSMENT AND ENVIRONMENTAL FOOTPRINT
4.9.6 DUE-DILIGENCE WORKFLOW FOR PROCUREMENT
4.9.7 CONCLUSION
5 REGULATION COVERAGE
5.1 PRODUCT CODES
5.2 CERTIFIED STANDARDS
5.3 SAFETY STANDARDS
6 MARKET OVERVIEW
6.1 DRIVERS
6.1.1 GROWTH IN AUTOMOTIVE PRODUCTION & VEHICLE FLEETS
6.1.2 INDUSTRIALIZATION & LARGE-SCALE INFRASTRUCTURE EXPANSION
6.1.3 RISING DEMAND FOR HIGH PERFORMANCE AND ENERGY-EFFICIENT LUBRICANTS
6.1.4 RISING ADOPTION OF ADVANCED MANUFACTURING & AUTOMATION TECHNOLOGIES
6.2 RESTRAINS
6.2.1 STRINGENT & DIVERGENT REGULATORY FRAMEWORKS
6.2.2 DECLINING DEMAND FROM ELECTRIC VEHICLES (EVS) FOR CONVENTIONAL LUBRICANTS
6.3 OPPORTUNITIES
6.3.1 DEVELOPMENT & COMMERCIALIZATION OF BIO-BASED AND SUSTAINABLE LUBRICANTS
6.3.2 GROWTH IN DEMAND FROM CONSTRUCTION, AGRICULTURE, AND MINING SECTORS
6.3.3 SERVICES AND TECHNOLOGY INTEGRATION FOR PREDICTIVE MAINTENANCE, IOT, AND LIFECYCLE MANAGEMENT
6.4 CHALLENGES
6.4.1 VOLATILITY IN RAW MATERIAL & BASE OIL PRICES
6.4.2 COMPETITION FROM ALTERNATIVE LUBRICATION TECHNOLOGIES & SUBSTITUTES
7 NORTH AMERICA LUBRICANTS MARKET, BY PRODUCT
7.1 OVERVIEW
7.2 ENGINE OILS
7.2.1 MINERAL OIL
7.2.2 SYNTHETIC OIL
7.3 HYDRAULIC OILS
7.3.1 MINERAL OIL
7.3.2 SYNTHETIC OIL
7.4 CIRCULATION FLUIDS
7.4.1 MINERAL OIL
7.4.2 SYNTHETIC OIL
7.5 GEAR OIL
7.5.1 MINERAL OIL
7.5.2 SYNTHETIC OIL
7.6 GREASE
7.6.1 GREASE, BY BASE OIL
7.6.2 MINERAL OIL
7.6.3 SYNTHETIC OIL
7.7 METALWORKING FLUIDS
7.7.1 MINERAL OIL
7.7.2 SYNTHETIC OIL
7.8 WIND TURBINE OILS
7.8.1 MINERAL OIL
7.8.2 SYNTHETIC OIL
7.9 COMPRESSOR OILS
7.9.1 MINERAL OIL
7.9.2 SYNTHETIC OIL
7.1 GAS TURBINE OILS
7.10.1 MINERAL OIL
7.10.2 SYNTHETIC OIL
7.11 HEAT TRANSFER OILS
7.11.1 MINERAL OIL
7.11.2 SYNTHETIC OIL
7.12 RUST PREVENTIVE OILS
7.12.1 MINERAL OIL
7.12.2 SYNTHETIC OIL
7.13 OTHERS
7.13.1 MINERAL OIL
7.13.2 SYNTHETIC OIL
8 NORTH AMERICA LUBRICANTS MARKET, BY BASE OIL
8.1 OVERVIEW
8.2 MINERAL OIL
8.3 SYNTHETIC OIL
8.4 SEMI-SYNTHETIC OIL
8.5 BIO-BASED OIL
8.6 OTHERS
9 NORTH AMERICA LUBRICANTS MARKET, BY SALES CHANNEL
9.1 OVERVIEW
9.2 B2B
9.3 B2C
10 NORTH AMERICA LUBRICANTS MARKET, BY END-USE
10.1 OVERVIEW
10.2 AUTOMOBILE & TRANSPORTATION
10.3 MARINE
10.4 METALLURGY AND METAL
10.5 ENERGY & POWER GENERATION
10.6 INDUSTRIAL
10.7 CHEMICAL MANUFACTURING
10.8 CONSTRUCTION MACHINERY/EARTHMOVING
10.9 HEAVY EQUIPMENT
10.1 FOOD & BEVERAGE
10.11 AEROSPACE
10.12 OTHERS
11 NORTH AMERICA LUBRICANTS MARKET, BY REGION
11.1 NORTH AMERICA
11.1.1 U.S.
11.1.2 MEXICO
11.1.3 CANADA
12 NORTH AMERICA LUBRICANTS MARKET: COMPANY LANDSCAPE
12.1 MANUFACTURER COMPANY SHARE ANALYSIS: GLOBAL
13 SWOT ANALYSIS
14 COMPANY PROFILE
14.1 SHELL PLC
14.1.1 COMPANY SNAPSHOT
14.1.2 REVENUE ANALYSIS
14.1.3 COMPANY SHARE ANALYSIS
14.1.4 PRODUCT PORTFOLIO
14.1.5 RECENT DEVELOPMENT
14.2 CHEVRON CORPORATION
14.2.1 COMPANY SNAPSHOT
14.2.2 REVENUE ANALYSIS
14.2.3 COMPANY SHARE ANALYSIS
14.2.4 PRODUCT PORTFOLIO
14.2.5 RECENT DEVELOPMENT
14.3 CHINA NATIONAL PETROLEUM CORPORATION (CNPC)
14.3.1 COMPANY SNAPSHOT
14.3.2 REVENUE ANALYSIS
14.3.3 COMPANY SHARE ANALYSIS
14.3.4 PRODUCT PORTFOLIO
14.3.5 RECENT DEVELOPMENT
14.4 PTT PUBLIC COMPANY LIMITED
14.4.1 COMPANY SNAPSHOT
14.4.2 REVENUE ANALYSIS
14.4.3 COMPANY SHARE ANALYSIS
14.4.4 PRODUCT PORTFOLIO
14.4.5 RECENT DEVELOPMENT
14.5 ENI S.P.A.
14.5.1 COMPANY SNAPSHOT
14.5.2 REVENUE ANALYSIS
14.5.3 COMPANY SHARE ANALYSIS
14.5.4 PRODUCT PORTFOLIO
14.5.5 RECENT DEVELOPMENT
14.6 BP P.L.C.
14.6.1 COMPANY SNAPSHOT
14.6.2 REVENUE ANALYSIS
14.6.3 PRODUCT PORTFOLIO
14.6.4 RECENT DEVELOPMENT
14.7 CARL BECHEM GMBH.
14.7.1 COMPANY SNAPSHOT
14.7.2 PRODUCT PORTFOLIO
14.7.3 RECENT DEVELOPMENT
14.8 CHINA PETROCHEMICAL CORPORATION
14.8.1 COMPANY SNAPSHOT
14.8.2 REVENUE ANALYSIS
14.8.3 PRODUCT PORTFOLIO
14.8.4 RECENT DEVELOPMENT
14.9 EXXON MOBIL CORPORATION.
14.9.1 COMPANY SNAPSHOT
14.9.2 REVENUE ANALYSIS
14.9.3 PRODUCT PORTFOLIO
14.9.4 RECENT DEVELOPMENT
14.1 ENEOS CORPORATION
14.10.1 COMPANY SNAPSHOT
14.10.2 REVENUE ANALYSIS
14.10.3 PRODUCT PORTFOLIO
14.10.4 RECENT DEVELOPMENT
14.11 FUCHS
14.11.1 COMPANY SNAPSHOT
14.11.2 REVENUE ANALYSIS
14.11.3 PRODUCT PORTFOLIO
14.11.4 RECENT DEVELOPMENT
14.12 GS CALTEX CORPORATION
14.12.1 COMPANY SNAPSHOT
14.12.2 REVENUE ANALYSIS
14.12.3 PRODUCT PORTFOLIO
14.12.4 RECENT DEVELOPMENT
14.13 GULF OIL INTERNATIONAL LTD
14.13.1 COMPANY SNAPSHOT
14.13.2 REVENUE ANALYSIS
14.13.3 PRODUCT PORTFOLIO
14.13.4 RECENT DEVELOPMENT
14.14 HARDCASTLE PETROFER
14.14.1 COMPANY SNAPSHOT
14.14.2 PRODUCT PORTFOLIO
14.14.3 RECENT DEVELOPMENT
14.15 HP LUBRICANTS.
14.15.1 COMPANY SNAPSHOT
14.15.2 REVENUE ANALYSIS
14.15.3 PRODUCT PORTFOLIO
14.15.4 RECENT DEVELOPMENT
14.16 IDEMITSU KOSAN CO., LTD.
14.16.1 COMPANY SNAPSHOT
14.16.2 REVENUE ANALYSIS
14.16.3 PRODUCT PORTFOLIO
14.16.4 RECENT DEVELOPMENT
14.17 INDIAN OIL CORPORATION LTD
14.17.1 COMPANY SNAPSHOT
14.17.2 REVENUE ANALYSIS
14.17.3 PRODUCT PORTFOLIO
14.17.4 RECENT DEVELOPMENT
14.18 LUKOIL
14.18.1 COMPANY SNAPSHOT
14.18.2 PRODUCT PORTFOLIO
14.18.3 RECENT DEVELOPMENT
14.19 MOTUL
14.19.1 COMPANY SNAPSHOT
14.19.2 PRODUCT PORTFOLIO
14.19.3 RECENT DEVELOPMENT
14.2 ORGANIZACIÓN TERPEL
14.20.1 COMPANY SNAPSHOT
14.20.2 PRODUCT PORTFOLIO
14.20.3 RECENT DEVELOPMENT
14.21 PETRONAS LUBRICANTS INTERNATIONAL
14.21.1 COMPANY SNAPSHOT
14.21.2 PRODUCT PORTFOLIO
14.21.3 RECENT DEVELOPMENT
14.22 PT PERTAMINA LUBRICANTS
14.22.1 COMPANY SNAPSHOT
14.22.2 REVENUE ANALYSIS
14.22.3 PRODUCT PORTFOLIO
14.22.4 RECENT DEVELOPMENT
14.23 PHILLIPS 66 COMPANY
14.23.1 COMPANY SNAPSHOT
14.23.2 REVENUE ANALYSIS
14.23.3 PRODUCT PORTFOLIO
14.23.4 RECENT DEVELOPMENT
14.24 QUAKER CHEMICAL CORPORATION D/B/A QUAKER HOUGHTON
14.24.1 COMPANY SNAPSHOT
14.24.2 REVENUE ANALYSIS
14.24.3 PRODUCT PORTFOLIO
14.24.4 RECENT DEVELOPMENT
14.25 ROSNEFT
14.25.1 COMPANY SNAPSHOT
14.25.2 REVENUE ANALYSIS
14.25.3 PRODUCT PORTFOLIO
14.25.4 RECENT DEVELOPMENT
14.26 SCHAEFFER MANUFACTURING CO.
14.26.1 COMPANY SNAPSHOT
14.26.2 PRODUCT PORTFOLIO
14.26.3 RECENT DEVELOPMENT
14.27 TOTALENERGIES
14.27.1 COMPANY SNAPSHOT
14.27.2 REVENUE ANALYSIS
14.27.3 PRODUCT PORTFOLIO
14.27.4 RECENT DEVELOPMENT
14.28 VALVOLINE
14.28.1 COMPANY SNAPSHOT
14.28.2 REVENUE ANALYSIS
14.28.3 PRODUCT PORTFOLIO
14.28.4 RECENT DEVELOPMENT
15 QUESTIONNAIRE
16 RELATED REPORTS
List of Table
TABLE 1 NORTH AMERICA LUBRICANTS MARKET, BY PRODUCT, 2018-2032 (USD MILLION)
TABLE 2 NORTH AMERICA LUBRICANTS MARKET, BY PRODUCT, 2018-2032 (KILO TONS)
TABLE 3 NORTH AMERICA ENGINE OILS IN LUBRICANTS MARKET, BY REGION, 2018-2032 (USD THOUSAND)
TABLE 4 NORTH AMERICA ENGINE OILS IN LUBRICANTS MARKET, BY BASE OIL, 2018-2032 (USD MILLION)
TABLE 5 NORTH AMERICA MINERAL OIL IN LUBRICANTS MARKET, BY TYPE, 2018-2032 (USD MILLION)
TABLE 6 NORTH AMERICA SYNTHETIC OIL IN LUBRICANTS MARKET, BY TYPE, 2018-2032 (USD MILLION)
TABLE 7 NORTH AMERICA HYDRAULIC OILS IN LUBRICANTS MARKET, BY REGION, 2018-2032 (USD THOUSAND)
TABLE 8 NORTH AMERICA HYDRAULIC OILS IN LUBRICANTS MARKET, BY BASE OIL, 2018-2032 (USD MILLION)
TABLE 9 NORTH AMERICA MINERAL OIL IN LUBRICANTS MARKET, BY TYPE, 2018-2032 (USD MILLION)
TABLE 10 NORTH AMERICA SYNTHETIC OIL IN LUBRICANTS MARKET, BY TYPE, 2018-2032 (USD MILLION)
TABLE 11 NORTH AMERICA CIRCULATION FLUIDS IN LUBRICANTS MARKET, BY REGION, 2018-2032 (USD THOUSAND)
TABLE 12 NORTH AMERICA CIRCULATION FLUIDS IN LUBRICANTS MARKET, BY BASE OIL, 2018-2032 (USD MILLION)
TABLE 13 NORTH AMERICA MINERAL OIL IN LUBRICANTS MARKET, BY TYPE, 2018-2032 (USD MILLION)
TABLE 14 NORTH AMERICA SYNTHETIC OIL IN LUBRICANTS MARKET, BY TYPE, 2018-2032 (USD MILLION)
TABLE 15 NORTH AMERICA GEAR OIL IN LUBRICANTS MARKET, BY REGION, 2018-2032 (USD THOUSAND)
TABLE 16 NORTH AMERICA GEAR OILS IN LUBRICANTS MARKET, BY BASE OIL, 2018-2032 (USD MILLION)
TABLE 17 NORTH AMERICA MINERAL OIL IN LUBRICANTS MARKET, BY TYPE, 2018-2032 (USD MILLION)
TABLE 18 NORTH AMERICA SYNTHETIC OIL IN LUBRICANTS MARKET, BY TYPE, 2018-2032 (USD MILLION)
TABLE 19 NORTH AMERICA GREASE IN LUBRICANTS MARKET, BY REGION, 2018-2032 (USD THOUSAND)
TABLE 20 NORTH AMERICA GREASE IN LUBRICANTS MARKET, BY TYPE, 2018-2032 (USD MILLION)
TABLE 21 NORTH AMERICA GREASE IN LUBRICANTS MARKET, BY BASE OIL, 2018-2032 (USD MILLION)
TABLE 22 NORTH AMERICA MINERAL OIL IN LUBRICANTS MARKET, BY TYPE, 2018-2032 (USD MILLION)
TABLE 23 NORTH AMERICA SYNTHETIC OIL IN LUBRICANTS MARKET, BY TYPE, 2018-2032 (USD MILLION)
TABLE 24 NORTH AMERICA METALWORKING FLUIDS IN LUBRICANTS MARKET, BY REGION, 2018-2032 (USD THOUSAND)
TABLE 25 NORTH AMERICA METALWORKING FLUIDS IN LUBRICANTS MARKET, BY BASE OIL, 2018-2032 (USD MILLION)
TABLE 26 NORTH AMERICA MINERAL OIL IN LUBRICANTS MARKET, BY TYPE, 2018-2032 (USD MILLION)
TABLE 27 NORTH AMERICA SYNTHETIC OIL IN LUBRICANTS MARKET, BY TYPE, 2018-2032 (USD MILLION)
TABLE 28 NORTH AMERICA WIND TURBINE OILS IN LUBRICANTS MARKET, BY REGION, 2018-2032 (USD THOUSAND)
TABLE 29 NORTH AMERICA WIND TURBINE OILS IN LUBRICANTS MARKET, BY BASE OIL, 2018-2032 (USD MILLION)
TABLE 30 NORTH AMERICA MINERAL OIL IN LUBRICANTS MARKET, BY TYPE, 2018-2032 (USD MILLION)
TABLE 31 NORTH AMERICA SYNTHETIC OIL IN LUBRICANTS MARKET, BY TYPE, 2018-2032 (USD MILLION)
TABLE 32 NORTH AMERICA COMPRESSOR OILS IN LUBRICANTS MARKET, BY REGION, 2018-2032 (USD THOUSAND)
TABLE 33 NORTH AMERICA COMPRESSOR OILS IN LUBRICANTS MARKET, BY BASE OIL, 2018-2032 (USD MILLION)
TABLE 34 NORTH AMERICA MINERAL OIL IN LUBRICANTS MARKET, BY TYPE, 2018-2032 (USD MILLION)
TABLE 35 NORTH AMERICA SYNTHETIC OIL IN LUBRICANTS MARKET, BY TYPE, 2018-2032 (USD MILLION)
TABLE 36 NORTH AMERICA GAS TURBINE OILS IN LUBRICANTS MARKET, BY REGION, 2018-2032 (USD THOUSAND)
TABLE 37 NORTH AMERICA GAS TURBINE OILS IN LUBRICANTS MARKET, BY BASE OIL, 2018-2032 (USD MILLION)
TABLE 38 NORTH AMERICA MINERAL OIL IN LUBRICANTS MARKET, BY TYPE, 2018-2032 (USD MILLION)
TABLE 39 NORTH AMERICA SYNTHETIC OIL IN LUBRICANTS MARKET, BY TYPE, 2018-2032 (USD MILLION)
TABLE 40 NORTH AMERICA HEAT TRANSFER OILS IN LUBRICANTS MARKET, BY REGION, 2018-2032 (USD THOUSAND)
TABLE 41 NORTH AMERICA HEAT TRANSFER OILS IN LUBRICANTS MARKET, BY BASE OIL, 2018-2032 (USD MILLION)
TABLE 42 NORTH AMERICA MINERAL OIL IN LUBRICANTS MARKET, BY TYPE, 2018-2032 (USD MILLION)
TABLE 43 NORTH AMERICA SYNTHETIC OIL IN LUBRICANTS MARKET, BY TYPE, 2018-2032 (USD MILLION)
TABLE 44 NORTH AMERICA RUST PREVENTIVE OILS IN LUBRICANTS MARKET, BY REGION, 2018-2032 (USD THOUSAND)
TABLE 45 NORTH AMERICA RUST PREVENTIVE OILS IN LUBRICANTS MARKET, BY BASE OIL, 2018-2032 (USD MILLION)
TABLE 46 NORTH AMERICA MINERAL OIL IN LUBRICANTS MARKET, BY TYPE, 2018-2032 (USD MILLION)
TABLE 47 NORTH AMERICA SYNTHETIC OIL IN LUBRICANTS MARKET, BY TYPE, 2018-2032 (USD MILLION)
TABLE 48 NORTH AMERICA OTHERS IN LUBRICANTS MARKET, BY REGION, 2018-2032 (USD THOUSAND)
TABLE 49 NORTH AMERICA OTHERS IN LUBRICANTS MARKET, BY BASE OIL, 2018-2032 (USD MILLION)
TABLE 50 NORTH AMERICA MINERAL OIL IN LUBRICANTS MARKET, BY TYPE, 2018-2032 (USD MILLION)
TABLE 51 NORTH AMERICA SYNTHETIC OIL IN LUBRICANTS MARKET, BY TYPE, 2018-2032 (USD MILLION)
TABLE 52 NORTH AMERICA LUBRICANTS MARKET, BY BASE OIL, 2018-2032 (USD MILLION)
TABLE 53 NORTH AMERICA MINERAL OIL IN LUBRICANTS MARKET, BY REGION, 2018-2032 (USD MILLION)
TABLE 54 NORTH AMERICA MINERAL OIL IN LUBRICANTS MARKET, BY TYPE, 2018-2032 (USD MILLION)
TABLE 55 NORTH AMERICA SYNTHETIC OIL IN LUBRICANTS MARKET, BY REGION, 2018-2032 (USD MILLION)
TABLE 56 NORTH AMERICA SYNTHETIC OIL IN LUBRICANTS MARKET, BY TYPE, 2018-2032 (USD MILLION)
TABLE 57 NORTH AMERICA SEMI-SYNTHETIC OIL IN LUBRICANTS MARKET, BY REGION, 2018-2032 (USD MILLION)
TABLE 58 NORTH AMERICA SEMI-SYNTHETIC OIL IN LUBRICANTS MARKET, BY REGION, 2018-2032 (USD MILLION)
TABLE 59 NORTH AMERICA OTHERS IN LUBRICANTS MARKET, BY REGION, 2018-2032 (USD MILLION)
TABLE 60 NORTH AMERICA LUBRICANTS MARKET, BY SALES CHANNEL, 2018-2032 (USD MILLION)
TABLE 61 NORTH AMERICA B2B IN LUBRICANTS MARKET, BY REGION, 2018-2032 (USD MILLION)
TABLE 62 NORTH AMERICA B2B IN LUBRICANTS MARKET, BY TYPE, 2018-2032 (USD MILLION)
TABLE 63 NORTH AMERICA B2C IN LUBRICANTS MARKET, BY REGION, 2018-2032 (USD MILLION)
TABLE 64 NORTH AMERICA B2C IN LUBRICANTS MARKET, BY TYPE, 2018-2032 (USD MILLION)
TABLE 65 NORTH AMERICA LUBRICANTS MARKET, BY END-USE, 2018-2032 (USD MILLION)
TABLE 66 NORTH AMERICA AUTOMOBILE & TRANSPORTATION IN LUBRICANTS MARKET, BY REGION, 2018-2032 (USD MILLION)
TABLE 67 NORTH AMERICA AUTOMOBILE & TRANSPORTATION IN LUBRICANTS MARKET, BY VEHICLE TYPE, 2018-2032 (USD MILLION)
TABLE 68 NORTH AMERICA COMMERCIAL VEHICLES IN LUBRICANTS MARKET, BY TYPE, 2018-2032 (USD MILLION)
TABLE 69 NORTH AMERICA TRUCKS IN LUBRICANTS MARKET, BY VEHICLE TYPE, 2018-2032 (USD MILLION)
TABLE 70 NORTH AMERICA PASSENGER VEHICLES IN LUBRICANTS MARKET, BY TYPE, 2018-2032 (USD MILLION)
TABLE 71 NORTH AMERICA MARINE IN LUBRICANTS MARKET, BY REGION, 2018-2032 (USD MILLION)
TABLE 72 NORTH AMERICA METALLURGY AND METAL WORKING IN LUBRICANTS MARKET, BY REGION, 2018-2032 (USD MILLION)
TABLE 73 NORTH AMERICA ENERGY & POWER GENERATION IN LUBRICANTS MARKET, BY REGION, 2018-2032 (USD MILLION)
TABLE 74 NORTH AMERICA INDUSTRIAL IN LUBRICANTS MARKET, BY REGION, 2018-2032 (USD MILLION)
TABLE 75 NORTH AMERICA CHEMICAL MANUFACTURING IN LUBRICANTS MARKET, BY REGION, 2018-2032 (USD MILLION)
TABLE 76 NORTH AMERICA CONSTRUCTION MACHINERY/ EARTHMOVING IN LUBRICANTS MARKET, BY REGION, 2018-2032 (USD MILLION)
TABLE 77 NORTH AMERICA HEAVY EQUIPMENT IN LUBRICANTS MARKET, BY REGION, 2018-2032 (USD MILLION)
TABLE 78 NORTH AMERICA FOOD & BEVERAGE IN LUBRICANTS MARKET, BY REGION, 2018-2032 (USD MILLION)
TABLE 79 NORTH AMERICA AEROSPACE IN LUBRICANTS MARKET, BY REGION, 2018-2032 (USD MILLION)
TABLE 80 NORTH AMERICA OTHERS IN LUBRICANTS MARKET, BY REGION, 2018-2032 (USD MILLION)
TABLE 81 NORTH AMERICA LUBRICANTS MARKET, BY COUNTRY, 2018-2032 (USD MILLION)
TABLE 82 NORTH AMERICA LUBRICANTS MARKET, BY COUNTRY, 2018-2032 (KILO TONS)
TABLE 83 NORTH AMERICA LUBRICANTS MARKET, BY PRODUCT, 2018-2032 (USD MILLION)
TABLE 84 NORTH AMERICA LUBRICANTS MARKET, BY PRODUCT, 2018-2032 (KILO TONS)
TABLE 85 NORTH AMERICA ENGINE OILS IN LUBRICANTS MARKET, BY BASE OIL, 2018-2032 (USD MILLION)
TABLE 86 NORTH AMERICA MINERAL OIL IN LUBRICANTS MARKET, BY TYPE, 2018-2032 (USD MILLION)
TABLE 87 NORTH AMERICA SYNTHETIC OIL IN LUBRICANTS MARKET, BY TYPE, 2018-2032 (USD MILLION)
TABLE 88 NORTH AMERICA HYDRAULIC OILS IN LUBRICANTS MARKET, BY BASE OIL, 2018-2032 (USD MILLION)
TABLE 89 NORTH AMERICA MINERAL OIL IN LUBRICANTS MARKET, BY TYPE, 2018-2032 (USD MILLION)
TABLE 90 NORTH AMERICA SYNTHETIC OIL IN LUBRICANTS MARKET, BY TYPE, 2018-2032 (USD MILLION)
TABLE 91 NORTH AMERICA CIRCULATION FLUIDS IN LUBRICANTS MARKET, BY BASE OIL, 2018-2032 (USD MILLION)
TABLE 92 NORTH AMERICA MINERAL OIL IN LUBRICANTS MARKET, BY TYPE, 2018-2032 (USD MILLION)
TABLE 93 NORTH AMERICA SYNTHETIC OIL IN LUBRICANTS MARKET, BY TYPE, 2018-2032 (USD MILLION)
TABLE 94 NORTH AMERICA GEAR OILS IN LUBRICANTS MARKET, BY BASE OIL, 2018-2032 (USD MILLION)
TABLE 95 NORTH AMERICA MINERAL OIL IN LUBRICANTS MARKET, BY TYPE, 2018-2032 (USD MILLION)
TABLE 96 NORTH AMERICA SYNTHETIC OIL IN LUBRICANTS MARKET, BY TYPE, 2018-2032 (USD MILLION)
TABLE 97 NORTH AMERICA GREASE IN LUBRICANTS MARKET, BY TYPE, 2018-2032 (USD MILLION)
TABLE 98 NORTH AMERICA GREASE IN LUBRICANTS MARKET, BY BASE OIL, 2018-2032 (USD MILLION)
TABLE 99 NORTH AMERICA MINERAL OIL IN LUBRICANTS MARKET, BY TYPE, 2018-2032 (USD MILLION)
TABLE 100 NORTH AMERICA SYNTHETIC OIL IN LUBRICANTS MARKET, BY TYPE, 2018-2032 (USD MILLION)
TABLE 101 NORTH AMERICA METALWORKING FLUIDS IN LUBRICANTS MARKET, BY BASE OIL, 2018-2032 (USD MILLION)
TABLE 102 NORTH AMERICA MINERAL OIL IN LUBRICANTS MARKET, BY TYPE, 2018-2032 (USD MILLION)
TABLE 103 NORTH AMERICA SYNTHETIC OIL IN LUBRICANTS MARKET, BY TYPE, 2018-2032 (USD MILLION)
TABLE 104 NORTH AMERICA WIND TURBINE OILS IN LUBRICANTS MARKET, BY BASE OIL, 2018-2032 (USD MILLION)
TABLE 105 NORTH AMERICA MINERAL OIL IN LUBRICANTS MARKET, BY TYPE, 2018-2032 (USD MILLION)
TABLE 106 NORTH AMERICA SYNTHETIC OIL IN LUBRICANTS MARKET, BY TYPE, 2018-2032 (USD MILLION)
TABLE 107 NORTH AMERICA COMPRESSOR OILS IN LUBRICANTS MARKET, BY BASE OIL, 2018-2032 (USD MILLION)
TABLE 108 NORTH AMERICA MINERAL OIL IN LUBRICANTS MARKET, BY TYPE, 2018-2032 (USD MILLION)
TABLE 109 NORTH AMERICA SYNTHETIC OIL IN LUBRICANTS MARKET, BY TYPE, 2018-2032 (USD MILLION)
TABLE 110 NORTH AMERICA GAS TURBINE OILS IN LUBRICANTS MARKET, BY BASE OIL, 2018-2032 (USD MILLION)
TABLE 111 NORTH AMERICA MINERAL OIL IN LUBRICANTS MARKET, BY TYPE, 2018-2032 (USD MILLION)
TABLE 112 NORTH AMERICA SYNTHETIC OIL IN LUBRICANTS MARKET, BY TYPE, 2018-2032 (USD MILLION)
TABLE 113 NORTH AMERICA HEAT TRANSFER OILS IN LUBRICANTS MARKET, BY BASE OIL, 2018-2032 (USD MILLION)
TABLE 114 NORTH AMERICA MINERAL OIL IN LUBRICANTS MARKET, BY TYPE, 2018-2032 (USD MILLION)
TABLE 115 NORTH AMERICA SYNTHETIC OIL IN LUBRICANTS MARKET, BY TYPE, 2018-2032 (USD MILLION)
TABLE 116 NORTH AMERICA RUST PREVENTIVE OILS IN LUBRICANTS MARKET, BY BASE OIL, 2018-2032 (USD MILLION)
TABLE 117 NORTH AMERICA MINERAL OIL IN LUBRICANTS MARKET, BY TYPE, 2018-2032 (USD MILLION)
TABLE 118 NORTH AMERICA SYNTHETIC OIL IN LUBRICANTS MARKET, BY TYPE, 2018-2032 (USD MILLION)
TABLE 119 NORTH AMERICA OTHERS IN LUBRICANTS MARKET, BY BASE OIL, 2018-2032 (USD MILLION)
TABLE 120 NORTH AMERICA MINERAL OIL IN LUBRICANTS MARKET, BY TYPE, 2018-2032 (USD MILLION)
TABLE 121 NORTH AMERICA SYNTHETIC OIL IN LUBRICANTS MARKET, BY TYPE, 2018-2032 (USD MILLION)
TABLE 122 NORTH AMERICA LUBRICANTS MARKET, BY BASE OIL, 2018-2032 (USD MILLION)
TABLE 123 NORTH AMERICA MINERAL OIL IN LUBRICANTS MARKET, BY TYPE, 2018-2032 (USD MILLION)
TABLE 124 NORTH AMERICA SYNTHETIC OIL IN LUBRICANTS MARKET, BY TYPE, 2018-2032 (USD MILLION)
TABLE 125 NORTH AMERICA LUBRICANTS MARKET, BY SALES CHANNEL, 2018-2032 (USD MILLION)
TABLE 126 NORTH AMERICA B2B IN LUBRICANTS MARKET, BY TYPE, 2018-2032 (USD MILLION)
TABLE 127 NORTH AMERICA B2C IN LUBRICANTS MARKET, BY TYPE, 2018-2032 (USD MILLION)
TABLE 128 NORTH AMERICA LUBRICANTS MARKET, BY END-USE, 2018-2032 (USD MILLION)
TABLE 129 NORTH AMERICA AUTOMOBILE & TRANSPORTATION IN LUBRICANTS MARKET, BY VEHICLE TYPE, 2018-2032 (USD MILLION)
TABLE 130 NORTH AMERICA COMMERCIAL VEHICLES IN LUBRICANTS MARKET, BY TYPE, 2018-2032 (USD MILLION)
TABLE 131 NORTH AMERICA TRUCKS IN LUBRICANTS MARKET, BY VEHICLE TYPE, 2018-2032 (USD MILLION)
TABLE 132 NORTH AMERICA PASSENGER VEHICLES IN LUBRICANTS MARKET, BY TYPE, 2018-2032 (USD MILLION)
TABLE 133 U.S. LUBRICANTS MARKET, BY PRODUCT, 2018-2032 (USD MILLION)
TABLE 134 U.S. LUBRICANTS MARKET, BY PRODUCT, 2018-2032 (KILO TONS)
TABLE 135 U.S. ENGINE OILS IN LUBRICANTS MARKET, BY BASE OIL, 2018-2032 (USD MILLION)
TABLE 136 U.S. MINERAL OIL IN LUBRICANTS MARKET, BY TYPE, 2018-2032 (USD MILLION)
TABLE 137 U.S. SYNTHETIC OIL IN LUBRICANTS MARKET, BY TYPE, 2018-2032 (USD MILLION)
TABLE 138 U.S. HYDRAULIC OILS IN LUBRICANTS MARKET, BY BASE OIL, 2018-2032 (USD MILLION)
TABLE 139 U.S. MINERAL OIL IN LUBRICANTS MARKET, BY TYPE, 2018-2032 (USD MILLION)
TABLE 140 U.S. SYNTHETIC OIL IN LUBRICANTS MARKET, BY TYPE, 2018-2032 (USD MILLION)
TABLE 141 U.S. CIRCULATION FLUIDS IN LUBRICANTS MARKET, BY BASE OIL, 2018-2032 (USD MILLION)
TABLE 142 U.S. MINERAL OIL IN LUBRICANTS MARKET, BY TYPE, 2018-2032 (USD MILLION)
TABLE 143 U.S. SYNTHETIC OIL IN LUBRICANTS MARKET, BY TYPE, 2018-2032 (USD MILLION)
TABLE 144 U.S. GEAR OILS IN LUBRICANTS MARKET, BY BASE OIL, 2018-2032 (USD MILLION)
TABLE 145 U.S. MINERAL OIL IN LUBRICANTS MARKET, BY TYPE, 2018-2032 (USD MILLION)
TABLE 146 U.S. SYNTHETIC OIL IN LUBRICANTS MARKET, BY TYPE, 2018-2032 (USD MILLION)
TABLE 147 U.S. GREASE IN LUBRICANTS MARKET, BY TYPE, 2018-2032 (USD MILLION)
TABLE 148 U.S. GREASE IN LUBRICANTS MARKET, BY BASE OIL, 2018-2032 (USD MILLION)
TABLE 149 U.S. MINERAL OIL IN LUBRICANTS MARKET, BY TYPE, 2018-2032 (USD MILLION)
TABLE 150 U.S. SYNTHETIC OIL IN LUBRICANTS MARKET, BY TYPE, 2018-2032 (USD MILLION)
TABLE 151 U.S. METALWORKING FLUIDS IN LUBRICANTS MARKET, BY BASE OIL, 2018-2032 (USD MILLION)
TABLE 152 U.S. MINERAL OIL IN LUBRICANTS MARKET, BY TYPE, 2018-2032 (USD MILLION)
TABLE 153 U.S. SYNTHETIC OIL IN LUBRICANTS MARKET, BY TYPE, 2018-2032 (USD MILLION)
TABLE 154 U.S. WIND TURBINE OILS IN LUBRICANTS MARKET, BY BASE OIL, 2018-2032 (USD MILLION)
TABLE 155 U.S. MINERAL OIL IN LUBRICANTS MARKET, BY TYPE, 2018-2032 (USD MILLION)
TABLE 156 U.S. SYNTHETIC OIL IN LUBRICANTS MARKET, BY TYPE, 2018-2032 (USD MILLION)
TABLE 157 U.S. COMPRESSOR OILS IN LUBRICANTS MARKET, BY BASE OIL, 2018-2032 (USD MILLION)
TABLE 158 U.S. MINERAL OIL IN LUBRICANTS MARKET, BY TYPE, 2018-2032 (USD MILLION)
TABLE 159 U.S. SYNTHETIC OIL IN LUBRICANTS MARKET, BY TYPE, 2018-2032 (USD MILLION)
TABLE 160 U.S. GAS TURBINE OILS IN LUBRICANTS MARKET, BY BASE OIL, 2018-2032 (USD MILLION)
TABLE 161 U.S. MINERAL OIL IN LUBRICANTS MARKET, BY TYPE, 2018-2032 (USD MILLION)
TABLE 162 U.S. SYNTHETIC OIL IN LUBRICANTS MARKET, BY TYPE, 2018-2032 (USD MILLION)
TABLE 163 U.S. HEAT TRANSFER OILS IN LUBRICANTS MARKET, BY BASE OIL, 2018-2032 (USD MILLION)
TABLE 164 U.S. MINERAL OIL IN LUBRICANTS MARKET, BY TYPE, 2018-2032 (USD MILLION)
TABLE 165 U.S. SYNTHETIC OIL IN LUBRICANTS MARKET, BY TYPE, 2018-2032 (USD MILLION)
TABLE 166 U.S. RUST PREVENTIVE OILS IN LUBRICANTS MARKET, BY BASE OIL, 2018-2032 (USD MILLION)
TABLE 167 U.S. MINERAL OIL IN LUBRICANTS MARKET, BY TYPE, 2018-2032 (USD MILLION)
TABLE 168 U.S. SYNTHETIC OIL IN LUBRICANTS MARKET, BY TYPE, 2018-2032 (USD MILLION)
TABLE 169 U.S. OTHERS IN LUBRICANTS MARKET, BY BASE OIL, 2018-2032 (USD MILLION)
TABLE 170 U.S. MINERAL OIL IN LUBRICANTS MARKET, BY TYPE, 2018-2032 (USD MILLION)
TABLE 171 U.S. SYNTHETIC OIL IN LUBRICANTS MARKET, BY TYPE, 2018-2032 (USD MILLION)
TABLE 172 U.S. LUBRICANTS MARKET, BY BASE OIL, 2018-2032 (USD MILLION)
TABLE 173 U.S. MINERAL OIL IN LUBRICANTS MARKET, BY TYPE, 2018-2032 (USD MILLION)
TABLE 174 U.S. SYNTHETIC OIL IN LUBRICANTS MARKET, BY TYPE, 2018-2032 (USD MILLION)
TABLE 175 U.S. LUBRICANTS MARKET, BY SALES CHANNEL, 2018-2032 (USD MILLION)
TABLE 176 U.S. B2B IN LUBRICANTS MARKET, BY TYPE, 2018-2032 (USD MILLION)
TABLE 177 U.S. B2C IN LUBRICANTS MARKET, BY TYPE, 2018-2032 (USD MILLION)
TABLE 178 U.S. LUBRICANTS MARKET, BY END-USE, 2018-2032 (USD MILLION)
TABLE 179 U.S. AUTOMOBILE & TRANSPORTATION IN LUBRICANTS MARKET, BY VEHICLE TYPE, 2018-2032 (USD MILLION)
TABLE 180 U.S. COMMERCIAL VEHICLES IN LUBRICANTS MARKET, BY TYPE, 2018-2032 (USD MILLION)
TABLE 181 U.S. TRUCKS IN LUBRICANTS MARKET, BY VEHICLE TYPE, 2018-2032 (USD MILLION)
TABLE 182 U.S. PASSENGER VEHICLES IN LUBRICANTS MARKET, BY TYPE, 2018-2032 (USD MILLION)
TABLE 183 MEXICO LUBRICANTS MARKET, BY PRODUCT, 2018-2032 (USD MILLION)
TABLE 184 MEXICO LUBRICANTS MARKET, BY PRODUCT, 2018-2032 (KILO TONS)
TABLE 185 MEXICO ENGINE OILS IN LUBRICANTS MARKET, BY BASE OIL, 2018-2032 (USD MILLION)
TABLE 186 MEXICO MINERAL OIL IN LUBRICANTS MARKET, BY TYPE, 2018-2032 (USD MILLION)
TABLE 187 MEXICO SYNTHETIC OIL IN LUBRICANTS MARKET, BY TYPE, 2018-2032 (USD MILLION)
TABLE 188 MEXICO HYDRAULIC OILS IN LUBRICANTS MARKET, BY BASE OIL, 2018-2032 (USD MILLION)
TABLE 189 MEXICO MINERAL OIL IN LUBRICANTS MARKET, BY TYPE, 2018-2032 (USD MILLION)
TABLE 190 MEXICO SYNTHETIC OIL IN LUBRICANTS MARKET, BY TYPE, 2018-2032 (USD MILLION)
TABLE 191 MEXICO CIRCULATION FLUIDS IN LUBRICANTS MARKET, BY BASE OIL, 2018-2032 (USD MILLION)
TABLE 192 MEXICO MINERAL OIL IN LUBRICANTS MARKET, BY TYPE, 2018-2032 (USD MILLION)
TABLE 193 MEXICO SYNTHETIC OIL IN LUBRICANTS MARKET, BY TYPE, 2018-2032 (USD MILLION)
TABLE 194 MEXICO GEAR OILS IN LUBRICANTS MARKET, BY BASE OIL, 2018-2032 (USD MILLION)
TABLE 195 MEXICO MINERAL OIL IN LUBRICANTS MARKET, BY TYPE, 2018-2032 (USD MILLION)
TABLE 196 MEXICO SYNTHETIC OIL IN LUBRICANTS MARKET, BY TYPE, 2018-2032 (USD MILLION)
TABLE 197 MEXICO GREASE IN LUBRICANTS MARKET, BY TYPE, 2018-2032 (USD MILLION)
TABLE 198 MEXICO GREASE IN LUBRICANTS MARKET, BY BASE OIL, 2018-2032 (USD MILLION)
TABLE 199 MEXICO MINERAL OIL IN LUBRICANTS MARKET, BY TYPE, 2018-2032 (USD MILLION)
TABLE 200 MEXICO SYNTHETIC OIL IN LUBRICANTS MARKET, BY TYPE, 2018-2032 (USD MILLION)
TABLE 201 MEXICO METALWORKING FLUIDS IN LUBRICANTS MARKET, BY BASE OIL, 2018-2032 (USD MILLION)
TABLE 202 MEXICO MINERAL OIL IN LUBRICANTS MARKET, BY TYPE, 2018-2032 (USD MILLION)
TABLE 203 MEXICO SYNTHETIC OIL IN LUBRICANTS MARKET, BY TYPE, 2018-2032 (USD MILLION)
TABLE 204 MEXICO WIND TURBINE OILS IN LUBRICANTS MARKET, BY BASE OIL, 2018-2032 (USD MILLION)
TABLE 205 MEXICO MINERAL OIL IN LUBRICANTS MARKET, BY TYPE, 2018-2032 (USD MILLION)
TABLE 206 MEXICO SYNTHETIC OIL IN LUBRICANTS MARKET, BY TYPE, 2018-2032 (USD MILLION)
TABLE 207 MEXICO COMPRESSOR OILS IN LUBRICANTS MARKET, BY BASE OIL, 2018-2032 (USD MILLION)
TABLE 208 MEXICO MINERAL OIL IN LUBRICANTS MARKET, BY TYPE, 2018-2032 (USD MILLION)
TABLE 209 MEXICO SYNTHETIC OIL IN LUBRICANTS MARKET, BY TYPE, 2018-2032 (USD MILLION)
TABLE 210 MEXICO GAS TURBINE OILS IN LUBRICANTS MARKET, BY BASE OIL, 2018-2032 (USD MILLION)
TABLE 211 MEXICO MINERAL OIL IN LUBRICANTS MARKET, BY TYPE, 2018-2032 (USD MILLION)
TABLE 212 MEXICO SYNTHETIC OIL IN LUBRICANTS MARKET, BY TYPE, 2018-2032 (USD MILLION)
TABLE 213 MEXICO HEAT TRANSFER OILS IN LUBRICANTS MARKET, BY BASE OIL, 2018-2032 (USD MILLION)
TABLE 214 MEXICO MINERAL OIL IN LUBRICANTS MARKET, BY TYPE, 2018-2032 (USD MILLION)
TABLE 215 MEXICO SYNTHETIC OIL IN LUBRICANTS MARKET, BY TYPE, 2018-2032 (USD MILLION)
TABLE 216 MEXICO RUST PREVENTIVE OILS IN LUBRICANTS MARKET, BY BASE OIL, 2018-2032 (USD MILLION)
TABLE 217 MEXICO MINERAL OIL IN LUBRICANTS MARKET, BY TYPE, 2018-2032 (USD MILLION)
TABLE 218 MEXICO SYNTHETIC OIL IN LUBRICANTS MARKET, BY TYPE, 2018-2032 (USD MILLION)
TABLE 219 MEXICO OTHERS IN LUBRICANTS MARKET, BY BASE OIL, 2018-2032 (USD MILLION)
TABLE 220 MEXICO MINERAL OIL IN LUBRICANTS MARKET, BY TYPE, 2018-2032 (USD MILLION)
TABLE 221 MEXICO SYNTHETIC OIL IN LUBRICANTS MARKET, BY TYPE, 2018-2032 (USD MILLION)
TABLE 222 MEXICO LUBRICANTS MARKET, BY BASE OIL, 2018-2032 (USD MILLION)
TABLE 223 MEXICO MINERAL OIL IN LUBRICANTS MARKET, BY TYPE, 2018-2032 (USD MILLION)
TABLE 224 MEXICO SYNTHETIC OIL IN LUBRICANTS MARKET, BY TYPE, 2018-2032 (USD MILLION)
TABLE 225 MEXICO LUBRICANTS MARKET, BY SALES CHANNEL, 2018-2032 (USD MILLION)
TABLE 226 MEXICO B2B IN LUBRICANTS MARKET, BY TYPE, 2018-2032 (USD MILLION)
TABLE 227 MEXICO B2C IN LUBRICANTS MARKET, BY TYPE, 2018-2032 (USD MILLION)
TABLE 228 MEXICO LUBRICANTS MARKET, BY END-USE, 2018-2032 (USD MILLION)
TABLE 229 MEXICO AUTOMOBILE & TRANSPORTATION IN LUBRICANTS MARKET, BY VEHICLE TYPE, 2018-2032 (USD MILLION)
TABLE 230 MEXICO COMMERCIAL VEHICLES IN LUBRICANTS MARKET, BY TYPE, 2018-2032 (USD MILLION)
TABLE 231 MEXICO TRUCKS IN LUBRICANTS MARKET, BY VEHICLE TYPE, 2018-2032 (USD MILLION)
TABLE 232 MEXICO PASSENGER VEHICLES IN LUBRICANTS MARKET, BY TYPE, 2018-2032 (USD MILLION)
TABLE 233 CANADA LUBRICANTS MARKET, BY PRODUCT, 2018-2032 (USD MILLION)
TABLE 234 CANADA LUBRICANTS MARKET, BY PRODUCT, 2018-2032 (KILO TONS)
TABLE 235 CANADA ENGINE OILS IN LUBRICANTS MARKET, BY BASE OIL, 2018-2032 (USD MILLION)
TABLE 236 CANADA MINERAL OIL IN LUBRICANTS MARKET, BY TYPE, 2018-2032 (USD MILLION)
TABLE 237 CANADA SYNTHETIC OIL IN LUBRICANTS MARKET, BY TYPE, 2018-2032 (USD MILLION)
TABLE 238 CANADA HYDRAULIC OILS IN LUBRICANTS MARKET, BY BASE OIL, 2018-2032 (USD MILLION)
TABLE 239 CANADA MINERAL OIL IN LUBRICANTS MARKET, BY TYPE, 2018-2032 (USD MILLION)
TABLE 240 CANADA SYNTHETIC OIL IN LUBRICANTS MARKET, BY TYPE, 2018-2032 (USD MILLION)
TABLE 241 CANADA CIRCULATION FLUIDS IN LUBRICANTS MARKET, BY BASE OIL, 2018-2032 (USD MILLION)
TABLE 242 CANADA MINERAL OIL IN LUBRICANTS MARKET, BY TYPE, 2018-2032 (USD MILLION)
TABLE 243 CANADA SYNTHETIC OIL IN LUBRICANTS MARKET, BY TYPE, 2018-2032 (USD MILLION)
TABLE 244 CANADA GEAR OILS IN LUBRICANTS MARKET, BY BASE OIL, 2018-2032 (USD MILLION)
TABLE 245 CANADA MINERAL OIL IN LUBRICANTS MARKET, BY TYPE, 2018-2032 (USD MILLION)
TABLE 246 CANADA SYNTHETIC OIL IN LUBRICANTS MARKET, BY TYPE, 2018-2032 (USD MILLION)
TABLE 247 CANADA GREASE IN LUBRICANTS MARKET, BY TYPE, 2018-2032 (USD MILLION)
TABLE 248 CANADA GREASE IN LUBRICANTS MARKET, BY BASE OIL, 2018-2032 (USD MILLION)
TABLE 249 CANADA MINERAL OIL IN LUBRICANTS MARKET, BY TYPE, 2018-2032 (USD MILLION)
TABLE 250 CANADA SYNTHETIC OIL IN LUBRICANTS MARKET, BY TYPE, 2018-2032 (USD MILLION)
TABLE 251 CANADA METALWORKING FLUIDS IN LUBRICANTS MARKET, BY BASE OIL, 2018-2032 (USD MILLION)
TABLE 252 CANADA MINERAL OIL IN LUBRICANTS MARKET, BY TYPE, 2018-2032 (USD MILLION)
TABLE 253 CANADA SYNTHETIC OIL IN LUBRICANTS MARKET, BY TYPE, 2018-2032 (USD MILLION)
TABLE 254 CANADA WIND TURBINE OILS IN LUBRICANTS MARKET, BY BASE OIL, 2018-2032 (USD MILLION)
TABLE 255 CANADA MINERAL OIL IN LUBRICANTS MARKET, BY TYPE, 2018-2032 (USD MILLION)
TABLE 256 CANADA SYNTHETIC OIL IN LUBRICANTS MARKET, BY TYPE, 2018-2032 (USD MILLION)
TABLE 257 CANADA COMPRESSOR OILS IN LUBRICANTS MARKET, BY BASE OIL, 2018-2032 (USD MILLION)
TABLE 258 CANADA MINERAL OIL IN LUBRICANTS MARKET, BY TYPE, 2018-2032 (USD MILLION)
TABLE 259 CANADA SYNTHETIC OIL IN LUBRICANTS MARKET, BY TYPE, 2018-2032 (USD MILLION)
TABLE 260 CANADA GAS TURBINE OILS IN LUBRICANTS MARKET, BY BASE OIL, 2018-2032 (USD MILLION)
TABLE 261 CANADA MINERAL OIL IN LUBRICANTS MARKET, BY TYPE, 2018-2032 (USD MILLION)
TABLE 262 CANADA SYNTHETIC OIL IN LUBRICANTS MARKET, BY TYPE, 2018-2032 (USD MILLION)
TABLE 263 CANADA HEAT TRANSFER OILS IN LUBRICANTS MARKET, BY BASE OIL, 2018-2032 (USD MILLION)
TABLE 264 CANADA MINERAL OIL IN LUBRICANTS MARKET, BY TYPE, 2018-2032 (USD MILLION)
TABLE 265 CANADA SYNTHETIC OIL IN LUBRICANTS MARKET, BY TYPE, 2018-2032 (USD MILLION)
TABLE 266 CANADA RUST PREVENTIVE OILS IN LUBRICANTS MARKET, BY BASE OIL, 2018-2032 (USD MILLION)
TABLE 267 CANADA MINERAL OIL IN LUBRICANTS MARKET, BY TYPE, 2018-2032 (USD MILLION)
TABLE 268 CANADA SYNTHETIC OIL IN LUBRICANTS MARKET, BY TYPE, 2018-2032 (USD MILLION)
TABLE 269 CANADA OTHERS IN LUBRICANTS MARKET, BY BASE OIL, 2018-2032 (USD MILLION)
TABLE 270 CANADA MINERAL OIL IN LUBRICANTS MARKET, BY TYPE, 2018-2032 (USD MILLION)
TABLE 271 CANADA SYNTHETIC OIL IN LUBRICANTS MARKET, BY TYPE, 2018-2032 (USD MILLION)
TABLE 272 CANADA LUBRICANTS MARKET, BY BASE OIL, 2018-2032 (USD MILLION)
TABLE 273 CANADA MINERAL OIL IN LUBRICANTS MARKET, BY TYPE, 2018-2032 (USD MILLION)
TABLE 274 CANADA SYNTHETIC OIL IN LUBRICANTS MARKET, BY TYPE, 2018-2032 (USD MILLION)
TABLE 275 CANADA LUBRICANTS MARKET, BY SALES CHANNEL, 2018-2032 (USD MILLION)
TABLE 276 CANADA B2B IN LUBRICANTS MARKET, BY TYPE, 2018-2032 (USD MILLION)
TABLE 277 CANADA B2C IN LUBRICANTS MARKET, BY TYPE, 2018-2032 (USD MILLION)
TABLE 278 CANADA LUBRICANTS MARKET, BY END-USE, 2018-2032 (USD MILLION)
TABLE 279 CANADA AUTOMOBILE & TRANSPORTATION IN LUBRICANTS MARKET, BY VEHICLE TYPE, 2018-2032 (USD MILLION)
TABLE 280 CANADA COMMERCIAL VEHICLES IN LUBRICANTS MARKET, BY TYPE, 2018-2032 (USD MILLION)
TABLE 281 CANADA TRUCKS IN LUBRICANTS MARKET, BY VEHICLE TYPE, 2018-2032 (USD MILLION)
TABLE 282 CANADA PASSENGER VEHICLES IN LUBRICANTS MARKET, BY TYPE, 2018-2032 (USD MILLION)
List of Figure
FIGURE 1 NORTH AMERICA LUBRICANT MARKET: SEGMENTATION
FIGURE 2 NORTH AMERICA LUBRICANTS MARKET: DATA TRIANGULATION
FIGURE 3 NORTH AMERICA LUBRICANTS MARKET: DROC ANALYSIS
FIGURE 4 NORTH AMERICA LUBRICANTS MARKET: NORTH AMERICA VS. REGIONAL MARKET ANALYSIS
FIGURE 5 NORTH AMERICA LUBRICANTS MARKET: COMPANY RESEARCH ANALYSIS
FIGURE 6 NORTH AMERICA LUBRICANTS MARKET: INTERVIEW DEMOGRAPHICS
FIGURE 7 NORTH AMERICA LUBRICANTS MARKET: DBMR MARKET POSITION GRID
FIGURE 8 NORTH AMERICA LUBRICANTS MARKET: VENDOR SHARE ANALYSIS
FIGURE 9 NORTH AMERICA LUBRICANTS MARKET: SEGMENTATION
FIGURE 10 NORTH AMERICA LUBRICANTS MARKET: EXECUTIVE SUMMARY
FIGURE 11 TWELVE SEGMENTS COMPRISE THE NORTH AMERICA LUBRICANTS MARKET, BY PRODUCT (2024)
FIGURE 12 STRATEGIC DECISIONS
FIGURE 13 GROWTH IN AUTOMOTIVE PRODUCTION & VEHICLE FLEETS IS EXPECTED TO DRIVE THE NORTH AMERICA LUBRICANTS MARKET IN THE FORECAST PERIOD OF 2025 TO 2032
FIGURE 14 ENGINE OILS SEGMENT IS EXPECTED TO ACCOUNT FOR THE LARGEST SHARE OF THE NORTH AMERICA LUBRICANTS MARKET IN 2025 & 2032
FIGURE 15 DRIVERS, RESTRAINTS, OPPORTUNITIES AND CHALLENGES OF THE NORTH AMERICA LUBRICANTS MARKET
FIGURE 16 NORTH AMERICA LUBRICANTS MARKET: BY PRODUCT, 2024
FIGURE 17 NORTH AMERICA LUBRICANTS MARKET: BY BASE OIL, 2024
FIGURE 18 NORTH AMERICA LUBRICANTS MARKET: BY SALES CHANNEL, 2024
FIGURE 19 NORTH AMERICA LUBRICANTS MARKET: BY END-USE, 2024
FIGURE 20 NORTH AMERICA LUBRICANTS MARKET: SNAPSHOT (2024)
FIGURE 21 NORTH AMERICA LUBRICANTS MARKET: COMPANY SHARE 2024 (%)
North America Lubricants Market, Supply Chain Analysis and Ecosystem Framework
To support market growth and help clients navigate the impact of geopolitical shifts, DBMR has integrated in-depth supply chain analysis into its North America Lubricants Market research reports. This addition empowers clients to respond effectively to global changes affecting their industries. The supply chain analysis section includes detailed insights such as North America Lubricants Market consumption and production by country, price trend analysis, the impact of tariffs and geopolitical developments, and import and export trends by country and HSN code. It also highlights major suppliers with data on production capacity and company profiles, as well as key importers and exporters. In addition to research, DBMR offers specialized supply chain consulting services backed by over a decade of experience, providing solutions like supplier discovery, supplier risk assessment, price trend analysis, impact evaluation of inflation and trade route changes, and comprehensive market trend analysis.
Data collection and base year analysis are done using data collection modules with large sample sizes. The stage includes obtaining market information or related data through various sources and strategies. It includes examining and planning all the data acquired from the past in advance. It likewise envelops the examination of information inconsistencies seen across different information sources. The market data is analysed and estimated using market statistical and coherent models. Also, market share analysis and key trend analysis are the major success factors in the market report. To know more, please request an analyst call or drop down your inquiry.
The key research methodology used by DBMR research team is data triangulation which involves data mining, analysis of the impact of data variables on the market and primary (industry expert) validation. Data models include Vendor Positioning Grid, Market Time Line Analysis, Market Overview and Guide, Company Positioning Grid, Patent Analysis, Pricing Analysis, Company Market Share Analysis, Standards of Measurement, Global versus Regional and Vendor Share Analysis. To know more about the research methodology, drop in an inquiry to speak to our industry experts.
Data Bridge Market Research is a leader in advanced formative research. We take pride in servicing our existing and new customers with data and analysis that match and suits their goal. The report can be customized to include price trend analysis of target brands understanding the market for additional countries (ask for the list of countries), clinical trial results data, literature review, refurbished market and product base analysis. Market analysis of target competitors can be analyzed from technology-based analysis to market portfolio strategies. We can add as many competitors that you require data about in the format and data style you are looking for. Our team of analysts can also provide you data in crude raw excel files pivot tables (Fact book) or can assist you in creating presentations from the data sets available in the report.


