
North America Lyophilized Injectable Drugs Market
Market Size in USD Billion
 USD
2.63 Billion
USD
4.09 Billion
2024
2032
USD
2.63 Billion
USD
4.09 Billion
2024
2032
| 2025 - 2032 | |
| USD 2.63 Billion | |
| USD 4.09 Billion | |
| % | |
|
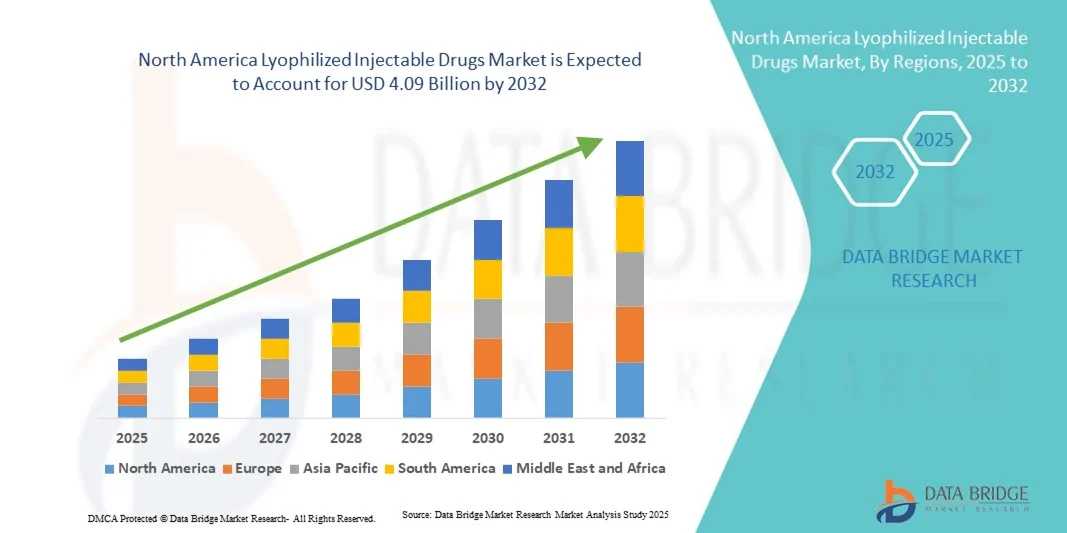
North America Lyophilized Injectable Drugs Market Size
- The North America lyophilized injectable drugs market size was valued at USD 2.63 billion in 2024 and is expected to reach USD 4.09 billion by 2032, at a CAGR of 5.7% during the forecast period
- The market growth is primarily driven by the increasing demand for stable, long-shelf-life formulations and the rising prevalence of chronic and infectious diseases, which necessitate effective injectable therapeutics
- Moreover, the expanding biologics and biosimilars pipeline, coupled with technological advancements in lyophilization processes and packaging systems, is strengthening the adoption of lyophilized injectables across pharmaceutical and biotechnology sectors. These trends are collectively propelling the market’s expansion throughout North America
North America Lyophilized Injectable Drugs Market Analysis
- Lyophilized injectable drugs, formulated through freeze-drying to enhance product stability, solubility, and shelf life, are increasingly crucial in the pharmaceutical and biotechnology industries for biologics, vaccines, and complex small molecules that require long-term preservation
- The rising demand for lyophilized injectable drugs is primarily fueled by the increasing prevalence of chronic and infectious diseases, expanding biologics and biosimilars pipeline, and growing need for temperature-stable formulations that ensure drug efficacy during storage and transport
- The United States dominated the North America lyophilized injectable drugs market with the largest revenue share of 80.1% in 2024, attributed to advanced manufacturing infrastructure, strong R&D capabilities, and a significant presence of leading pharmaceutical and biotechnology firms focused on sterile injectable production
- Canada is expected to be the fastest-growing country in the North America lyophilized injectable drugs market during the forecast period, supported by increasing investments in biopharmaceutical research and expansion of contract manufacturing facilities
- The vials segment dominated the North America lyophilized injectable drugs market with a market share of 43.9% in 2024, driven by their widespread use in hospitals and laboratories for secure storage, easy handling, and compatibility with a wide range of injectable formulations
Report Scope and North America Lyophilized Injectable Drugs Market Segmentation
|
Attributes |
North America Lyophilized Injectable Drugs Key Market Insights |
|
Segments Covered |
|
|
Countries Covered |
North America
|
|
Key Market Players |
|
|
Market Opportunities |
|
|
Value Added Data Infosets |
In addition to the insights on market scenarios such as market value, growth rate, segmentation, geographical coverage, and major players, the market reports curated by the Data Bridge Market Research also include in-depth expert analysis, patient epidemiology, pipeline analysis, pricing analysis, and regulatory framework |
North America Lyophilized Injectable Drugs Market Trends
Rising Adoption of Automated Lyophilization and Single-Use Technologies
- A significant and accelerating trend in the North America lyophilized injectable drugs market is the integration of automated lyophilization systems and single-use technologies, enhancing process efficiency, sterility assurance, and cost-effectiveness in pharmaceutical manufacturing
- For instance, OPTIMA Packaging Group introduced advanced automated lyophilization lines that minimize manual handling and contamination risk, improving overall production yield and product stability. Similarly, GEA Group AG has expanded its single-use freeze-drying solutions to streamline small-batch and clinical-scale manufacturing
- Automation in lyophilization enables real-time monitoring, precise temperature control, and data-driven optimization, significantly reducing variability in drying cycles and improving product uniformity across large-scale batches. For instance, SP Scientific implements AI-enabled process control systems that learn from previous cycles to ensure consistent product quality and cycle reproducibility
- The adoption of automated and modular lyophilization systems allows manufacturers to enhance flexibility, scalability, and compliance with stringent regulatory standards, particularly for high-value biologics and vaccines requiring precise freeze-drying conditions
- This trend toward technologically advanced, data-integrated, and modular lyophilization processes is transforming the injectable drug manufacturing landscape across North America, driving efficiency and reliability in sterile drug production. Consequently, companies such as Baxter BioPharma Solutions and Lonza are investing heavily in automated lyophilization suites equipped with robotics and real-time analytics capabilities
- The growing demand for high-quality, stable, and rapidly reconstituted injectable formulations is fueling the widespread adoption of automated and single-use lyophilization technologies across contract manufacturing organizations and major pharmaceutical firms
North America Lyophilized Injectable Drugs Market Dynamics
Driver
Expanding Biologics Pipeline and Demand for Long-Term Stability Solutions
- The increasing focus on biologics, biosimilars, and peptide-based therapeutics, combined with the rising prevalence of chronic diseases, is a major driver accelerating demand for lyophilized injectable drugs across North America
- For instance, in February 2024, Pfizer announced the expansion of its sterile injectable manufacturing facility in Michigan to increase lyophilization capacity for biologics and mRNA-based drugs, reflecting growing demand for stable, long-shelf-life products
- As biologic drugs are highly sensitive to temperature and moisture, lyophilization provides enhanced stability, maintaining product efficacy and extending shelf life, making it the preferred formulation approach for injectables
- Furthermore, the growing number of FDA approvals for lyophilized drugs and the expansion of biopharmaceutical R&D programs are fueling market growth by encouraging investment in advanced formulation technologies
- The widespread use of lyophilized injectables in oncology, autoimmune diseases, and infectious disease treatments underscores their importance in modern therapeutics, providing a reliable solution for storage and global distribution. The shift toward biologics and precision medicine is expected to further strengthen demand for advanced lyophilized drug products
- The increasing collaboration between pharmaceutical companies and contract development and manufacturing organizations (CDMOs) specializing in lyophilization services is further enhancing capacity, technological innovation, and market expansion across the region
Restraint/Challenge
High Production Costs and Stringent Regulatory Compliance Requirements
- The complex and capital-intensive nature of lyophilization processes, coupled with the need for specialized equipment and highly controlled environments, presents a significant challenge to widespread adoption across small and mid-sized manufacturers
- For instance, establishing a compliant lyophilization suite requires multi-million-dollar investments in vacuum chambers, cleanroom infrastructure, and validation systems, creating financial barriers for emerging biotech firms
- Maintaining regulatory compliance with stringent FDA and EMA quality standards adds to the operational burden, as each lyophilized formulation requires extensive validation, stability testing, and process documentation. For instance, regulatory delays or failed validation batches can significantly impact production timelines and overall profitability for drug developers
- The energy-intensive nature of freeze-drying, along with the technical expertise required to optimize drying cycles, further increases operational costs and limits scalability for manufacturers with constrained resources
- In addition, extended cycle times and batch-based processes reduce throughput compared to liquid injectables, leading to longer lead times and higher production expenses that can affect competitive pricing. While continuous and automated lyophilization technologies are emerging, widespread implementation remains gradual due to cost and technical challenges
- Overcoming these constraints through process optimization, increased automation, and strategic partnerships with CDMOs offering advanced lyophilization capabilities will be essential for improving efficiency and reducing production costs in the long term
North America Lyophilized Injectable Drugs Market Scope
The market is segmented on the basis of packaging, drug class, form, indication, route of administration, end user, and distribution channel.
- By Packaging
On the basis of packaging, the North America lyophilized injectable drugs market is segmented into vials, dual-chamber syringes, dual-chamber cartridges, and others. Vials dominated the market in 2024 with the largest revenue share, attributed to their broad compatibility with various lyophilized formulations and cost-effective manufacturing. Vials provide enhanced protection against moisture and contamination, extending the shelf life of temperature-sensitive injectables such as biologics and vaccines. The pharmaceutical industry continues to favor vials due to their proven efficiency in freeze-drying processes and widespread acceptance in hospital and institutional use. Moreover, the extensive availability of glass and polymer vial options supports flexibility for manufacturers and healthcare facilities asuch as, sustaining this segment’s dominance in the region.
Dual-Chamber Syringes are projected to witness the fastest growth rate from 2025 to 2032. The rising preference for ready-to-use injectable formats among healthcare providers and patients is driving adoption. Dual-chamber syringes enable immediate drug reconstitution before administration, reducing preparation time and contamination risks. These devices are particularly suitable for emergency care and biologic therapies requiring rapid delivery. Their patient-friendly design also supports self-administration in home healthcare environments, aligning with the growing trend toward personalized and convenient drug delivery systems in North America.
- By Drug Class
On the basis of drug class, the market is segmented into anti-infective, antineoplastic, diuretics, proton pump inhibitor, anesthetic, anticoagulant, NSAIDs, corticosteroids, and others. Antineoplastic drugs dominated the market in 2024 owing to the increasing burden of cancer and the critical role of lyophilization in stabilizing oncology injectables. Many monoclonal antibodies and cytotoxic agents require lyophilized forms to maintain potency and extend shelf life. The region’s advanced oncology infrastructure and ongoing clinical trials for injectable cancer biologics further reinforce this segment’s leadership. Rising demand for targeted and immune-oncology therapies continues to boost the need for stable lyophilized antineoplastic products across North America.
Anti-Infective drugs are anticipated to experience the fastest growth from 2025 to 2032. Growing antimicrobial resistance and increased awareness of infection management have elevated demand for stable, long-lasting antibiotic injectables. Lyophilization enhances the stability of β-lactam, glycopeptide, and macrolide formulations, ensuring effectiveness in critical care settings. Moreover, frequent infectious disease outbreaks and hospital-acquired infections have accelerated the shift toward lyophilized anti-infectives that offer longer storage and reduced wastage, strengthening this segment’s growth trajectory.
- By Form
On the basis of form, the market is bifurcated into powder and liquid. Powder formulations dominated the market in 2024 due to their superior chemical and physical stability. These formulations are less prone to degradation and microbial contamination, making them ideal for biologics, peptides, and vaccines. Powdered lyophilized injectables also reduce the need for cold-chain transportation, lowering logistical costs for pharmaceutical manufacturers. Their extended shelf life and consistent performance across varying environmental conditions make them the preferred choice for large-scale production and hospital procurement in North America.
Liquid formulations are projected to grow at the fastest rate from 2025 to 2032, driven by the expanding demand for ready-to-administer and prefilled injectable products. Liquid lyophilized drugs simplify administration by minimizing preparation steps and reducing handling errors. Advancements in aseptic processing and cryo-protective technologies have improved the stability of liquid injectables, expanding their applicability in chronic disease therapies. In addition, increasing adoption of liquid formulations in personalized medicine and home-based care settings supports their rapid growth.
- By Indication
On the basis of indication, the market is segmented into oncology, autoimmune diseases, hormonal disorders, respiratory diseases, gastrointestinal disorders, dermatological disorders, ophthalmic diseases, and others. Oncology was the leading indication in 2024, accounting for the largest market share. The dominance of this segment stems from the high prevalence of cancer and the necessity of lyophilized drugs in chemotherapy and biologic formulations. Lyophilization ensures the stability of complex molecules such as antibodies and peptides, which are integral to modern oncology treatments. The growing focus on biosimilars and targeted therapies, combined with strong oncology R&D pipelines in the U.S. and Canada, continues to support this segment’s market leadership.
Autoimmune Diseases are expected to be the fastest-growing indication segment through 2032. The increasing incidence of conditions such as rheumatoid arthritis, lupus, and multiple sclerosis has created strong demand for biologic injectables. Lyophilized drugs are essential for maintaining protein stability and therapeutic efficacy in these chronic treatments. The rise of subcutaneous formulations and home-administered biologics also drives this segment’s expansion. Moreover, patient preference for self-care solutions and expanding reimbursement coverage are supporting market acceleration in this category.
- By Route of Administration
On the basis of route of administration, the market is segmented into intravenous/infusion, intramuscular, and others. Intravenous/Infusion administration dominated the market in 2024, supported by its widespread use in hospitals for oncology, anti-infective, and emergency therapies. This route allows precise dosing and rapid systemic absorption, crucial for critical care treatments. Lyophilized injectables are frequently reconstituted for intravenous use, offering better control over sterility and dosage accuracy. The presence of well-developed infusion infrastructure and skilled nursing staff across North America further contributes to this segment’s continued dominance.
Intramuscular administration is projected to record the fastest CAGR from 2025 to 2032. Increasing use of intramuscular formulations for vaccines, hormonal therapies, and long-acting depot injectables is fueling this growth. Lyophilized forms offer extended stability and enable sustained release for improved patient compliance. The segment also benefits from rising vaccination initiatives, particularly for influenza, HPV, and emerging infectious diseases, making intramuscular lyophilized injectables a growing focus in both preventive and therapeutic medicine.
- By End User
On the basis of end user, the market is segmented into hospitals, clinics, home healthcare, and others. Hospitals dominated the market in 2024, attributed to their extensive use of lyophilized injectables for oncology, infectious diseases, and critical care. Hospitals maintain large-scale procurement through direct tendering systems, ensuring steady supply for inpatient treatments. Lyophilized formulations are preferred in this setting for their longer shelf life, sterility assurance, and cost-effective inventory management. Furthermore, the integration of automated pharmacy systems and sterile compounding units enhances hospital-level utilization of these products across North America.
Home Healthcare is anticipated to grow at the fastest pace from 2025 to 2032. The shift toward self-administration and at-home treatment of chronic illnesses is driving the demand for convenient, patient-friendly lyophilized injectables. Prefilled dual-chamber syringes and auto-injectors allow easy reconstitution and use without professional supervision. Expanding reimbursement policies for home infusion services and the rising elderly population further reinforce this trend, marking a strong shift toward decentralized care delivery models.
- By Distribution Channel
On the basis of distribution channel, the market is segmented into direct tender, retail sales, and others. Direct Tender distribution dominated the market in 2024, supported by large-volume procurement by hospitals, government agencies, and healthcare systems. This channel ensures stable supply, negotiated pricing, and consistent product quality across institutional buyers. Pharmaceutical manufacturers prefer direct tender agreements to strengthen relationships with major healthcare providers and optimize logistics efficiency. The trend is particularly strong in the U.S., where group purchasing organizations (GPOs) facilitate centralized bulk orders for lyophilized injectables.
Retail Sales are expected to witness the fastest growth during 2025–2032, driven by expanding specialty pharmacy networks and increasing patient access to biologic injectables. Improved cold-chain logistics and digital pharmacy platforms enable safe retail distribution of temperature-sensitive lyophilized drugs. The growing use of chronic disease injectables, coupled with patient support programs, enhances sales through retail and online pharmacy channels. This segment’s growth reflects the broader shift toward outpatient and self-managed therapy environments across North America.
North America Lyophilized Injectable Drugs Market Regional Analysis
- The United States dominated the North America lyophilized injectable drugs market with the largest revenue share of 80.1% in 2024, attributed to advanced manufacturing infrastructure, strong R&D capabilities, and a significant presence of leading pharmaceutical and biotechnology firms focused on sterile injectable production
- The region’s leadership is supported by advanced clinical trial activity, numerous biotech hubs and large contract development & manufacturing organizations (CDMOs) that specialize in lyophilization and aseptic filling, ensuring rapid scale-up from lab to commercial volumes
- Strong healthcare infrastructure and high hospital and specialty-clinic procurement, combined with favorable reimbursement frameworks and centralized purchasing by large health systems, sustain demand for stable, long-shelf-life lyophilized injectables
U.S. Lyophilized Injectable Drugs Market Insight
The U.S. lyophilized injectable drugs market captured the largest revenue share of 80.1% in 2024 within North America, fueled by a well-established pharmaceutical and biotechnology ecosystem. The country’s dominance is driven by extensive biologics and biosimilars production, strong clinical research infrastructure, and the presence of leading CDMOs specializing in lyophilization technology. Growing demand for stable injectable formulations in oncology, autoimmune, and infectious disease treatments continues to support market growth. In addition, favorable FDA approvals, increased adoption of personalized therapies, and advancements in sterile filling and freeze-drying processes are enhancing product innovation. The shift toward ready-to-use and dual-chamber delivery systems further strengthens the U.S. market’s leadership.
Canada Lyophilized Injectable Drugs Market Insight
The Canada lyophilized injectable drugs market is projected to expand at a steady CAGR during the forecast period, supported by the country’s rising healthcare expenditure and strong government focus on improving domestic drug manufacturing capacity. The increasing incidence of chronic diseases such as cancer and autoimmune disorders is boosting demand for biologic and specialty injectable drugs. Canadian pharmaceutical firms are increasingly investing in freeze-drying technologies and cold-chain infrastructure to ensure product quality and extended shelf life. Moreover, collaborations between multinational firms and local CDMOs are enhancing the production of sterile injectable biologics. Growing preference for prefilled and reconstitutable formulations also supports steady market growth.
Mexico Lyophilized Injectable Drugs Market Insight
The Mexico lyophilized injectable drugs market is anticipated to grow at a significant CAGR throughout the forecast period, driven by expanding healthcare access and growing pharmaceutical outsourcing. Mexico’s cost-efficient manufacturing environment and proximity to the U.S. are attracting investment from global drug producers seeking regional production capabilities. Rising prevalence of infectious and chronic diseases is increasing demand for stable, easy-to-transport injectable medications. The government’s initiatives to strengthen domestic biologics manufacturing and streamline regulatory pathways are further stimulating market growth. In addition, improved healthcare infrastructure and an expanding private hospital network are fostering greater adoption of lyophilized injectables across therapeutic categories.
North America Lyophilized Injectable Drugs Market Share
The North America Lyophilized Injectable Drugs industry is primarily led by well-established companies, including:
- Pfizer Inc. (U.S.)
- Merck & Co., Inc. (U.S.)
- Johnson & Johnson Services, Inc. (U.S.)
- Amgen Inc. (U.S.)
- Catalent, Inc. (U.S.)
- Thermo Fisher Scientific Inc. (U.S.)
- Lonza (Switzerland)
- Baxter. (U.S.)
- Fresenius Kabi AG (U.S.)
- Grifols, S.A. (Spain)
- Octapharma USA, Inc. (U.S.)
- Emergent BioSolutions Inc. (U.S.)
- AbbVie Inc. (U.S.)
- Gilead Sciences, Inc. (U.S.)
- Novartis AG (Switzerland)
- Bristol-Myers Squibb Company (U.S.)
- Regeneron Pharmaceuticals, Inc. (U.S.)
- Takeda Pharmaceutical Company Limited (Japan)
- Sandoz International GmbH (Germany)
- Biogen Inc. (U.S.)
What are the Recent Developments in North America Lyophilized Injectable Drugs Market?
- In March 2025, Avenacy announced the launch of five additional injectable antibiotic products in the U.S. market (Ampicillin, Ampicillin/Sulbactam, Nafcillin, Penicillin G Potassium, Piperacillin/Tazobactam) several of which are lyophilized/vial formats representing combined U.S. sales of about USD 175 million for the preceding 12 months. This move shows growth in generic injectable supply, which underpins demand for lyophilized injectable packaging, manufacturing, and cold-chain logistics in North America
- In September 2024, Amneal Pharmaceuticals and Shilpa Medicare received U.S. FDA approval for BORUZU™ (bortezomib injection), the first “ready-to-use” formulation of bortezomib (proteasome inhibitor) for subcutaneous or IV use switching away from the previous lyophilized-powder format requiring reconstitution. This development is important because it illustrates a transition within oncology injectables from lyophilized powder formats to more convenient pre-filled or ready-use formats—in the North American market
- In April 2024, Octapharma USA announced that the U.S. Food & Drug Administration (FDA) granted Orphan Drug Exclusivity to wilate (von Willebrand Factor/Coagulation Factor VIII Complex a lyophilized powder for solution for IV injection) for routine prophylaxis in patients (≥ 6 years) with any type of von Willebrand disease (VWD). This is significant because it reflects how lyophilized injectable formulations continue to be important in rare-disease and haemophilia-type biotherapeutic areas
- In January 2024, Avenacy announced the commercial launch of Melphalan Hydrochloride for Injection in the U.S. market. This product is a generic therapeutic equivalent of Alkeran and is provided as a lyophilized powder kit (50 mg vial of active plus 10 mL diluent) that is room-temperature stable, improving transportability and simplifying hospital logistics
- In January 2024, Avenacy also launched Bivalirudin for Injection in the U.S., a lyophilized powder single-dose vial (250 mg) serving as a generic equivalent of Angiomax for anticoagulation in PCI settings including patients with heparin-induced thrombocytopenia. This underscores increased activity in generics of lyophilized products in cardiovascular indications an area typically less saturated compared to oncology, signaling diversification of lyophilized injectable formats beyond biologics
SKU-

- Interactive Data Analysis Dashboard
- Company Analysis Dashboard for high growth potential opportunities
- Research Analyst Access for customization & queries
- Competitor Analysis with Interactive dashboard
- Latest News, Updates & Trend analysis
- Harness the Power of Benchmark Analysis for Comprehensive Competitor Tracking
Data collection and base year analysis are done using data collection modules with large sample sizes. The stage includes obtaining market information or related data through various sources and strategies. It includes examining and planning all the data acquired from the past in advance. It likewise envelops the examination of information inconsistencies seen across different information sources. The market data is analysed and estimated using market statistical and coherent models. Also, market share analysis and key trend analysis are the major success factors in the market report. To know more, please request an analyst call or drop down your inquiry.
The key research methodology used by DBMR research team is data triangulation which involves data mining, analysis of the impact of data variables on the market and primary (industry expert) validation. Data models include Vendor Positioning Grid, Market Time Line Analysis, Market Overview and Guide, Company Positioning Grid, Patent Analysis, Pricing Analysis, Company Market Share Analysis, Standards of Measurement, Global versus Regional and Vendor Share Analysis. To know more about the research methodology, drop in an inquiry to speak to our industry experts.
Data Bridge Market Research is a leader in advanced formative research. We take pride in servicing our existing and new customers with data and analysis that match and suits their goal. The report can be customized to include price trend analysis of target brands understanding the market for additional countries (ask for the list of countries), clinical trial results data, literature review, refurbished market and product base analysis. Market analysis of target competitors can be analyzed from technology-based analysis to market portfolio strategies. We can add as many competitors that you require data about in the format and data style you are looking for. Our team of analysts can also provide you data in crude raw excel files pivot tables (Fact book) or can assist you in creating presentations from the data sets available in the report.


