
North America Magnet Market
Market Size in USD Billion
 USD
10.18 Billion
USD
18.14 Billion
2025
2033
USD
10.18 Billion
USD
18.14 Billion
2025
2033
| 2026 - 2033 | |
| USD 10.18 Billion | |
| USD 18.14 Billion | |
| % | |
|
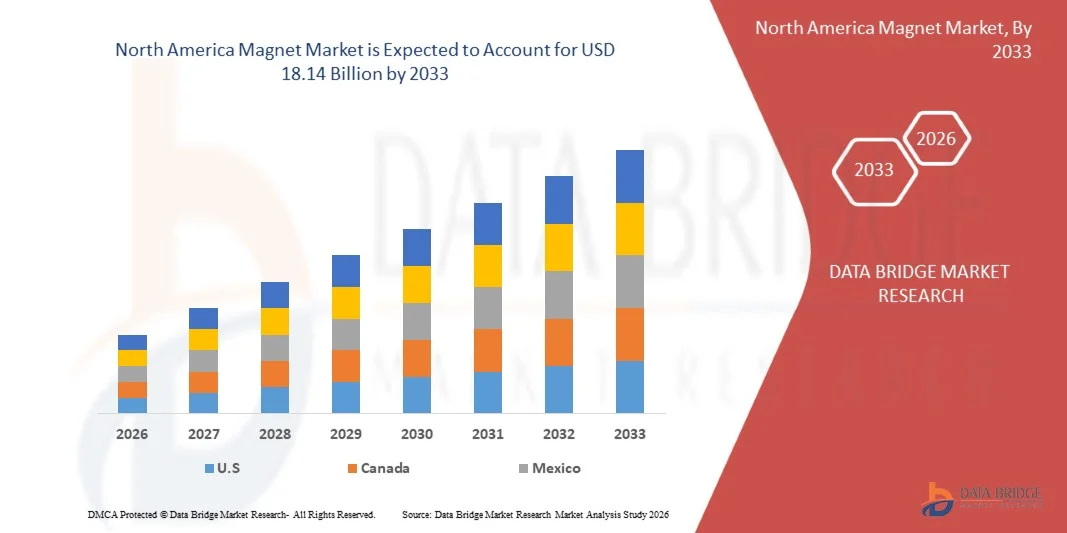
North America Magnet Market Size
- The North America Magnet Market is expected to reach USD 18.14 Billion by 2033 from USD 10.18 Billion in 2025, growing with a substantial CAGR of 7.56% in the forecast period of 2026 to 2033
- The North America Magnet Market growth is significantly driven by the increasing demand for electric and hybrid vehicles, as these vehicles rely heavily on advanced magnetic materials for their core technologies. Increasing wind energy installations drive demand for efficient permanent magnet generators with improved energy conversion performance.
- Market expansion is further supported by expansion of the renewable energy sector, as modern renewable energy technologies, particularly wind turbines and certain hydroelectric generators, rely heavily on high-performance magnetic materials. Permanent magnets, especially rare-earth magnets, are critical components in the generators of wind turbines, where they enhance efficiency, reduce energy loss, and support compact, lightweight designs.
North America Magnet Market Analysis
- The North America Magnet Market is witnessing steady growth, driven by increasing investments in smart factories and Industry 4.0, as advanced manufacturing systems rely heavily on high-performance magnetic materials. Smart factories leverage automation, robotics, artificial intelligence (AI), and the Internet of Things (IoT) to enhance productivity, precision, and energy efficiency.
- Magnets serve as a critical component in energy-efficient electrical systems, supporting power generation, transmission, and industrial applications across the region, making them essential for technological and industrial development.
- The rising focus on energy conservation, smart grids, and low-loss magnetic materials sustains the demand for advanced magnets, contributing to economic growth and industrial modernization.
- The U.S. dominates the North America Magnet Market, holding over 77.62% market share in 2025, supported by its large manufacturing base, rapid industrial expansion, and significant investments in renewable energy and electric vehicles (EVs).
- The U.S. is also the fastest-growing country in the region, with a CAGR of 10.3%, reflecting increased industrial modernization, adoption of advanced technologies, and demand for high-performance magnets.
Report Scope and North America Magnet Market Segmentation
|
Attributes |
Magnet Key Market Insights |
|
Segments Covered |
|
|
Countries Covered |
North America
|
|
Key Market Players |
|
|
Market Opportunities |
|
|
Value Added Data Infosets |
In addition to the insights on market scenarios such as market value, growth rate, segmentation, geographical coverage, and major players, the market reports curated by the Data Bridge Market Research also include import export analysis, production capacity overview, production consumption analysis, price trend analysis, climate change scenario, supply chain analysis, value chain analysis, raw material/consumables overview, vendor selection criteria, PESTLE Analysis, Porter Analysis, and regulatory framework. |
North America Magnet Market Trends
“Increasing Investments in Smart Factories & Industry 4.0”
- Increasing investments in smart factories and Industry 4.0, is a major trend fueling the demand for Magnet in the North America region as advanced manufacturing systems rely heavily on high-performance magnetic materials. Smart factories integrate automation, robotics, artificial intelligence, and the Internet of Things (IoT) to improve productivity, precision, and energy efficiency.
- Electric motors, servo drives, sensors, actuators, and robotic systems used in these environments depend on permanent magnets for accurate motion control and reliable performance.
- As manufacturers across automotive, electronics, aerospace, and industrial equipment sectors modernize their production facilities, demand for compact, energy-efficient, and high-torque motors continues to rise.
- Industry 4.0 also emphasizes predictive maintenance and real-time monitoring, increasing the use of magnet-based sensing and control systems. Moreover, the shift toward energy-efficient and digitally connected factories supports the adoption of advanced magnetic materials, creating sustained growth opportunities for magnet producers in both developed and emerging industrial markets.
- For instance, in January 2026, Deloitte released its 2026 Manufacturing Industry Outlook, highlighting that manufacturer are increasing strategic investments in smart manufacturing technologies such as automation hardware, sensors, data analytics, cloud platforms, and AI to boost competitiveness, agility, and resilience amid global supply chain complexity. Manufacturers report strong commitments to allocate significant portions of their improvement budgets toward digital transformation initiatives. This strategic focus on smart factory technologies creates advanced automation systems, robotics, and connected electromechanical equipment rely on high‑performance magnets in motors, actuators, and sensors.
North America Magnet Market Dynamics
Driver
“Increasing Demand for Electric & Hybrid Vehicles”
- The increasing demand for electric and hybrid vehicles is a key driver of the North America Magnet Market, as these vehicles rely heavily on advanced magnetic materials for their core technologies.
- High-performance magnets, particularly rare-earth magnets, are essential components in electric motors, generators, power steering systems, braking systems, and battery management units. Compared to conventional internal combustion engine vehicles, electric and hybrid vehicles require more powerful, efficient, and compact motors, which significantly increases magnet usage per vehicle.
- Growing environmental concerns, stringent emission regulations, and government incentives promoting clean mobility are accelerating the adoption of electric and hybrid vehicles worldwide. As automakers expand EV production and invest in next-generation powertrain technologies, the demand for reliable and high-efficiency magnets continues to rise.
For Instances
- In January, 2026, Chinese EV maker Xpeng announced plans to sell up to 600,000 vehicles in 2026, a significant increase from its 2025 deliveries of around 429,000. This reflects strong growth in EV demand, driven by new models and technological advancements. Higher EV production directly boosts the need for electric motors, which rely on advanced magnetic materials, making rising EV adoption a major driver of the global North America Magnet Market.
- In December 2025, Ford and Renault Group announced a strategic partnership to jointly develop two affordable electric passenger vehicles for the European market, using Renault’s Ampere EV platform and production facilities in northern France. This collaboration aims to expand EV options and reduce development costs by combining Renault’s EV technology with Ford’s design expertise. Increasing the availability and competitiveness of electric vehicles, this move can boost consumer adoption, strengthen supply chains, and drive higher demand for EV components like electric motors and advanced magnetic materials.
- In January 2026, Verge Motorcycles unveiled its TS Pro electric motorcycle equipped with all‑solid‑state battery technology, developed with Donut Lab, marking one of the first production‑ready solid‑state EV batteries. The new battery promises faster charging, longer range, and better safety than conventional lithium‑ion cells. Such breakthroughs can boost consumer interest and accelerate EV adoption, increasing demand for electric motors and advanced magnetic materials.
- The increasing adoption of electric and hybrid vehicles is a major driver of the global North America Magnet Market, as these vehicles rely on high-performance magnetic materials for electric motors, generators, braking systems, and battery management units. Compared to conventional vehicles, EVs and hybrids require more powerful, compact, and efficient motors, significantly raising magnet demand per vehicle. Growing environmental concerns, stricter emission regulations, and supportive government incentives are accelerating the shift toward electrified mobility. Advances in motor and battery technologies, alongside expanding EV production and next-generation powertrains, further boost the need for reliable and high-efficiency magnets, sustaining long-term growth in the global North America Magnet Market.
Restraint/Challenge
“Price Volatility of Raw Materials”
- The price volatility of raw materials acts as a significant restraint on the North America Magnet Market, as fluctuations in the cost of critical inputs particularly rare-earth elements like neodymium, dysprosium, praseodymium, and samarium can disrupt production and increase manufacturing expenses.
- Most high-performance magnets rely on these scarce materials, which are geographically concentrated, with supply often dominated by a few countries. Political instability, export restrictions, trade disputes, and environmental regulations in producing regions can trigger sudden price spikes, creating uncertainty for manufacturers.
- This unpredictability limits long-term planning, delays investments in new facilities, and increases end-product costs for industries such as renewable energy, automotive, aerospace, and defense. Additionally, small and medium-sized magnet producers may struggle to absorb price swings, potentially reducing market competitiveness.
For Instances,
- In January 2026, China restricted rare-earth exports to Japanese companies amid geopolitical tensions, limiting the supply of critical materials such as rare-earth oxides and finished magnets. This move tightens global supply and drives up raw material prices, highlighting the vulnerability of magnet manufacturers to geopolitical risks as fluctuating availability and higher costs increase production uncertainty, delay projects, and constrain growth in industries like renewable energy, automotive, defense, and aerospace that rely on high-performance magnets.
- In January 2026, India’s automobile industry struggled with rare‑earth magnet supply issues, particularly for neodymium‑iron‑boron magnets imported mainly from China, which disrupted inventories and created uncertainty for manufacturers especially in the electric vehicle (EV) sector. Indian companies are now exploring domestic sources and alternative suppliers to reduce reliance on foreign imports and secure critical materials as unpredictable availability and higher procurement costs hinder production planning and slow investments in magnet‑dependent technologies.
- In March 2025, construction industry reports highlighted severe shortages of trained electricians, fiber optic technicians, and BICSI-certified installers required for precise data center cabling. The Associated Builders and Contractors projected a 439,000–500,000 worker deficit, with 14% of members facing 8.5-month project backlogs. These labor constraints increased costs by 15–20%, slowed deployments for hyperscale projects by OpenAI and Amazon, and created risks to quality and overall project timelines.
- The volatility of raw material prices, particularly rare-earth elements, poses a major restraint on the global North America Magnet Market by creating uncertainty in supply and increasing production costs. Dependence on geographically concentrated sources, combined with geopolitical tensions, trade restrictions, and supply chain disruptions, limits manufacturers’ ability to plan long-term, invest in capacity, and maintain stable pricing. Industries such as renewable energy, automotive, aerospace, and defense are especially affected, as cost spikes and supply shortages can delay projects and reduce competitiveness. Overall, unpredictable material availability and price swings constrain market growth, hinder innovation, and increase operational risk across magnet-dependent sectors
North America Magnet Market Scope
The North America Magnet Market is segmented into six notable segments based on product type, raw material, function, application, end user, and distribution channel.
By Product Type
On the basis of product type, the market is segmented into neodymium magnets, ferrite magnets, samarium cobalt magnets, ALNICO magnets, and others. In 2026, the neodymium magnet segment is expected to dominate the market with a 41.11% share owing to their high magnetic strength, compact size efficiency, and widespread use in EV drivetrains, industrial motors, and advanced electronics.
Ferrite Magnets is projected to be the fastest-growing segment with CAGR of 8.2% due to the increasing demand for energy-efficient electrical devices and transformers across the North America region.
By Raw Material
On the basis of raw material, the market is segmented into rare earth elements, ferrite materials, aluminum nickel cobalt (ALNICO) alloys, and others. In 2026, the rare earth elements segment is expected to hold the largest share of 47.40% driven by rising demand for NdFeB-based permanent magnets in EVs, wind turbines, robotics, and high-performance consumer electronics.
Ferrite Materials are projected to be the fastest-growing segment with CAGR of 8.1% in the North America Magnet Market, driven by increasing demand for energy-efficient electrical devices, transformers, and motors across the North America region.
By Function
On the basis of function, the market is segmented into permanent magnets, electromagnets, flexible magnets, temporary magnets, hybrid magnets, and others. In 2026, the permanent magnet segment is anticipated to dominate the market with market share of 57.00% due to their indispensable role in high-efficiency motors, generators, actuators, and magnetic sensing systems across automotive, industrial, and energy applications.
The Electromagnets segment is projected to be the fastest-growing segment with CAGR of 8.0% in the North America Magnet Market, driven by increasing demand for high-performance Electromagnets used in transformers, motors, and renewable energy applications.
By Application
On the basis of application, the global North America Magnet Market is segmented into automotive, electronics, industrial machinery, energy, consumer appliances, medical devices, military & defense, and others. In 2026, the automotive segment is expected to remain the leading application area with market share of 25.68% as electric powertrains, driveline motors, braking and steering systems, and onboard electronics continue to expand with growing EV adoption.
The Electronics segment is projected to be the fastest-growing in the North America Magnet Market with CAGR of 8.0%, driven by rising demand for energy-efficient transformers, electric motors, and inductors across industrial and consumer applications.
By End user
On the basis of end user, the market is segmented into automotive manufacturers, electronics & semiconductor companies, industrial equipment manufacturers, energy companies, healthcare & medical device manufacturers, and others. In 2026, the automotive manufacturers segment is projected to dominate the market with market share of 27.41% due to accelerating EV production, rising demand for traction motors, and increasing integration of magnet-based components in ADAS and power electronics.
The Electronics & Semiconductor Companies segment is projected to be the fastest-growing segment with CAGR of 8.0% in the North America Magnet Market, driven by the rapid adoption of electric vehicles (EVs), hybrid vehicles, and advanced driver-assistance systems (ADAS).
By Distribution Channel
On the basis of distribution channel, the market is segmented into direct and indirect. In 2026, the direct segment is expected to dominate the market with largest market share of 58.19%, as OEMs prefer direct procurement for consistent supply security, material traceability, customized magnet specifications, and long-term performance validation.
The Indirect segment is projected to be the fastest-growing segment with a notable CAGR of 7.6% in the North America Magnet Market, driven by the expanding network of distributors and online industrial platforms, increasing procurement from small- and medium-scale manufacturers, and rising demand from aftermarket, maintenance, and localized electronics and automotive applications that require flexible order volumes and faster delivery timelines.
North America Magnet Market Regional Analysis
- U.S. is recognized as a significant market for Magnet, driven by rapid industrialization, growing electric vehicle production, expansion of renewable energy projects, and large-scale investments in digital infrastructure. These developments make Magnet essential for supporting the country’s industrial and technological growth strategies.
- The escalating adoption of smart grids, energy-efficient transformers, and high-capacity data centers across Canada & Canada, coupled with rising internet penetration and increasing industrial automation, is a major catalyst for the growing demand for Magnet in the region.
- The steady expansion and modernization of manufacturing, automotive, and telecommunications infrastructure, especially in emerging Southeast Asian economies like Thailand, Malaysia, and Indonesia, and the need for reliable power distribution and electronic applications, are further accelerating the adoption of high-performance Magnet across the North America
U.S. North America Magnet Market Insight
The U.S. North America Magnet Market is primarily driven by the country’s rapid industrialization, growing electric vehicle production, and large-scale adoption of renewable energy infrastructure, which collectively require high-performance Magnet for efficient energy conversion and electronic applications. The surging demand for advanced transformers, inductors, and electric motors in automotive, industrial, and consumer electronics sectors is further fueling market growth. Additionally, increasing investments in domestic research and development are enhancing product innovation, enabling Chinese manufacturers to reduce reliance on imports while meeting the country’s expanding energy-efficient and digital infrastructure needs.
Canada North America Magnet Market Insight
The Canada North America Magnet Market is primarily driven by the country’s accelerating industrialization, expanding renewable energy projects, and the rapid growth of the automotive and electronics sectors, which require efficient and high-performance Magnet for transformers, motors, and inductors. The increasing adoption of electric vehicles, smart grids, and energy-efficient appliances is further boosting demand across the nation. Moreover, government initiatives supporting “Make in India” and domestic manufacturing are encouraging local production and innovation, reducing dependency on imports while addressing the rising need for reliable, high-capacity, and technologically advanced Magnet in India’s expanding industrial and digital infrastructure.
North America Magnet Market Share
The Magnet industry is primarily led by well-established companies, including:
- Shin-Etsu Chemical Co., Ltd. (Japan)
- TDK Corporation (Japan)
- Daido Steel Co., Ltd. (Japan)
- Proterial, Ltd. (formerly Hitachi Metals, Ltd.) (Japan)
- Arnold Magnetic Technologies (U.S.)
- Adams Magnetic Products, LLC (U.S.)
- Bunting Magnetics Co. (U.S.)
- Dura Magnetics Inc. (U.S.)
- Electron Energy Corporation (U.S.)
- Goudsmit Magnetics (Netherlands)
- Magnequench (Singapore)
- Ningbo Yunsheng Co., Ltd. (China)
- Zhejiang Innuovo Magnetics Co., Ltd. (China)
Latest Developments in North America Magnet Market
- In November 2025, Shin-Etsu Chemical developed a recyclable thermoplastic silicone that combines high hardness, elongation, and excellent transparency without inorganic fillers, enabling new applications previously difficult for conventional silicone rubber. The material supports injection molding similar to plastics and is being showcased at the 14th PLASTIC JAPAN exhibition. This innovation expands the company’s silicone portfolio with sustainable, high-performance elastomer materials.
- In May 2025, Shin-Etsu Chemical announced the development of new silicone products for personal care applications designed to improve texture and functionality in cosmetics, including water-soluble silicone waxes and silicone elastomer gels with soft-focus effects. These materials meet diverse formulation needs and are exhibited at CITE JAPAN 2025, helping the company expand its product offerings in the personal care sector.
- In June 2024, TDK Corporation has expanded its tunnel-magnetoresistance (TMR) angle sensor lineup with the TAS8240, designed for automotive and industrial applications. Available in compact QFN16 (3 × 3 mm²) and TSSOP16 (5 × 6.4 mm²) packages, the sensor features four redundant analog SIN/COS outputs, low power consumption, and precise 360° angle measurement for BLDC motors in safety-critical systems such as power steering, brake boosters, and traction motors.
- In July 2025, Daido Steel announce a JPY 3.6 billion investment to expand high-alloy bar production capacity at its Hoshizaki plant. The investment aims to improve product quality and meet growing demand for high-performance steel. This development strengthens the company’s competitiveness in automotive and industrial applications.
- In January 2026, Japanese materials giant Proterial, Ltd. announced it will spin out its Magnetic Materials Business into a standalone subsidiary, Proterial Magnetics, Ltd., effective April 1, 2026. The move aims to enhance capital flexibility, enable strategic partnerships, and allow rapid responses to market demand in the NdFeB permanent magnet segment, critical for electric vehicles, wind turbines, industrial motors, and defense systems. The reorganization positions Proterial to scale up amid global supply chain pressures, reduce reliance on Chinese magnet production, and align with U.S., Japanese, and European initiatives to expand non-Chinese rare earth magnet capacity.
SKU-

- Interactive Data Analysis Dashboard
- Company Analysis Dashboard for high growth potential opportunities
- Research Analyst Access for customization & queries
- Competitor Analysis with Interactive dashboard
- Latest News, Updates & Trend analysis
- Harness the Power of Benchmark Analysis for Comprehensive Competitor Tracking
Table of Content
1 INTRODUCTION
1.1 OBJECTIVES OF THE STUDY
1.2 MARKET DEFINITION
1.3 OVERVIEW OF NORTH AMERICA MAGNET MARKET
1.4 LIMITATIONS
1.5 MARKETS COVERED
2 MARKET SEGMENTATION
2.1 MARKETS COVERED
2.2 GEOGRAPHICAL SCOPE
2.3 YEARS CONSIDERED FOR THE STUDY
2.4 CURRENCY AND PRICING
2.5 DBMR TRIPOD DATA VALIDATION MODEL
2.6 MULTIVARIATE MODELING
2.7 PRIMARY INTERVIEWS WITH KEY OPINION LEADERS
2.8 DBMR MARKET POSITION GRID
2.9 MARKET APPLICATION COVERAGE GRID
2.1 VENDOR SHARE ANALYSIS
2.11 SECONDARY SOURCES
2.12 ASSUMPTIONS
3 EXECUTIVE SUMMARY
4 PREMIUM INSIGHTS
4.1 PORTER’S FIVE FORCES ANALYSIS
4.1.1 THREAT OF NEW ENTRANTS
4.1.2 BARGAINING POWER OF SUPPLIERS
4.1.3 BARGAINING POWER OF BUYERS
4.1.4 THREAT OF SUBSTITUTE PRODUCTS
4.1.5 INDUSTRY RIVALRY
4.2 RAW MATERIAL COVERAGE - NORTH AMERICA MAGNET MARKET
4.2.1 RARE EARTH ELEMENTS (NEODYMIUM, PRASEODYMIUM, DYSPROSIUM, TERBIUM)
4.2.2 IRON, BORON, AND SPECIALTY ALLOY INPUTS
4.2.3 MAGNET POWDER PROCESSING AND SINTERING MATERIALS
4.2.4 COATINGS, SURFACE TREATMENT, AND CORROSION-PROTECTION MATERIALS
4.2.5 REAL-WORLD SUPPLY SHOCKS IMPACTING MAGNET RAW MATERIALS
4.2.6 STRATEGIC DIVERSIFICATION OF MAGNET RAW MATERIAL SUPPLY
4.2.7 QUALITY, COMPLIANCE AND TRACEABILITY
4.3 BRAND OUTLOOK
4.3.1 BRAND COMPARATIVE ANALYSIS
4.3.2 COMPANY VS BRAND OVERVIEW
4.4 CONSUMERS BUYING BEHAVIOUR
4.4.1 SHIFT FROM PRICE-BASED TO PERFORMANCE- AND VALUE-BASED PURCHASING
4.4.2 STRONG DEMAND FOR APPLICATION-SPECIFIC MAGNET GRADES
4.4.3 GROWING IMPORTANCE OF PRODUCT CONSISTENCY, QUALITY, AND SUPPLY RELIABILITY
4.4.4 INCREASING INFLUENCE OF SUPPLIER TRUST AND REGULATORY CONFIDENCE
4.4.5 RISING DEMAND FOR INNOVATION IN MAGNET PERFORMANCE
4.4.6 SUSTAINABILITY AND MATERIAL ORIGIN AWARENESS AS EMERGING FACTORS
4.4.7 PREFERENCE FOR WIDE AVAILABILITY AND LOGISTICS CONTINUITY
4.4.8 COMMERCIAL BUYERS’ FOCUS ON CONSISTENCY, PRICING STABILITY, AND SUPPLY RELIABILITY
4.4.9 INFLUENCE OF GEOPOLITICAL AND REGULATORY CONDITIONS ON BUYING PATTERNS
4.4.10 CONCLUSION
4.5 VENDOR SELECTION CRITERIA
4.5.1 QUALITY AND MATERIAL CERTIFICATION STANDARDS
4.5.2 MANUFACTURING CAPABILITY AND TECHNICAL COMPLIANCE
4.5.3 REGULATORY, ENVIRONMENTAL, AND SAFETY COMPLIANCE
4.5.4 SUPPLY CHAIN RELIABILITY AND RAW MATERIAL SECURITY
4.5.5 FINANCIAL STABILITY AND LONG-TERM VIABILITY
4.5.6 SUSTAINABILITY, INNOVATION, AND RISK MANAGEMENT
4.6 TECHNOLOGICAL ADVANCEMENTS
4.6.1 RARE-EARTH MAGNET OPTIMIZATION
4.6.2 INTEGRATING NANOCOMPOSITE MAGNETS
4.6.3 ADVANCED MANUFACTURING TECHNIQUES
4.6.4 INTEGRATION WITH RENEWABLE ENERGY AND ELECTRIC VEHICLES
4.6.5 SMART MAGNET SYSTEMS AND SPINTRONICS
4.7 VALUE CHAIN ANALYSIS
4.7.1 VALUE CHAIN OF NORTH AMERICA MAGNET MARKET-
4.7.2 RAW MATERIAL SOURCING
4.7.3 REFINING & SEPARATION OF RARE EARTHS
4.7.4 MAGNET MANUFACTURING, DISTRIBUTION, AND CHANNEL PARTNERS
4.7.5 DESIGN, INTEGRATION, AND INSTALLATION SERVICES
4.7.6 END USERS, DELIVERY, AND OPERATIONS
4.8 INNOVATION TRACKER AND STRATEGIC ANALYSIS
4.8.1 MAJOR DEALS AND STRATEGIC ALLIANCES ANALYSIS
4.8.1.1 Joint Ventures & Collaborative Initiatives
4.8.1.2 Mergers and Acquisitions
4.8.1.3 Technology & Supply Agreements
4.8.2 PRODUCT INNOVATION AND R&D FOCUS
4.8.3 STAGES OF DEVELOPMENT
4.8.4 TIMELINES AND MILESTONES
4.8.5 INNOVATION STRATEGIES AND METHODOLOGIES
4.8.6 RISK ASSESSMENT AND MITIGATION
4.8.7 FUTURE OUTLOOK
4.9 PRICING ANALYSIS
4.9.1 PRICE COMPONENTS & COST DRIVERS
4.9.2 RAW MATERIAL PRICE VOLATILITY
4.9.3 IMPACT OF GEOPOLITICAL & EXPORT CONTROLS
4.9.4 REGIONAL PRICING DIFFERENCES
4.9.5 APPLICATION & SEGMENT-BASED PRICING
4.9.6 CONTRACTING STRATEGIES & PRICE PASS-THROUGH
4.9.7 LONG-TERM OUTLOOK ON PRICING.
4.1 SUPPLY CHAIN ANALYSIS
4.10.1 OVERVIEW:
4.10.2 RAW MATERIALS & MINING:
4.10.3 MAGNET MANUFACTURING & PROCESSING:
4.10.4 LOGISTICS, TRADE & DISTRIBUTION:
4.10.5 DOWNSTREAM DEMAND & INTEGRATION:
4.10.6 STRATEGIC RESPONSES & DIVERSIFICATION:
4.10.7 CONCLUSION:
4.11 CLIMATE CHANGE SCENARIO
4.11.1 ENVIRONMENTAL CONCERNS
4.11.2 INDUSTRY RESPONSE
4.11.3 GOVERNMENT’S ROLE
4.11.4 ANALYST RECOMMENDATIONS
4.12 INDUSTRY ECOSYSTEM ANALYSIS
4.12.1 PROMINENT COMPANIES
4.12.2 SMALL & MEDIUM SIZE COMPANIES
4.12.3 END USERS
5 TARIFFS & IMPACT ON THE MARKET
5.1 CURRENT TARIFF RATE(S) IN TOP-5 COUNTRY MARKETS
5.2 OUTLOOK: LOCAL PRODUCTION VS IMPORT RELIANCE
5.3 VENDOR SELECTION CRITERIA DYNAMICS
5.3.1 IMPACT ON SUPPLY CHAIN
5.3.2 MANUFACTURING AND PRODUCTION
5.3.3 LOGISTICS AND DISTRIBUTION
5.3.4 PRICE PITCHING AND POSITION OF MARKET
5.4 INDUSTRY PARTICIPANTS: PROACTIVE MOVES
5.4.1 SUPPLY CHAIN OPTIMIZATION
5.4.2 JOINT VENTURE ESTABLISHMENTS
5.4.3 IMPACT ON PRICES
5.5 REGULATORY INCLINATION
5.5.1 GEOPOLITICAL SITUATION
5.5.2 TRADE PARTNERSHIPS BETWEEN THE COUNTRIES
5.5.3 FREE TRADE AGREEMENTS
5.5.4 ALLIANCE ESTABLISHMENTS
5.5.5 STATUS ACCREDITATION (INCLUDING MFN)
5.5.6 INCENTIVE SCHEMES TO BOOST PRODUCTION OUTPUTS
5.5.7 ESTABLISHMENT OF SEZS / INDUSTRIAL PARKS
6 REGULATION COVERAGE
6.1 PRODUCT CODES
6.1.1 CERTIFIED STANDARDS
6.1.2 SAFETY STANDARDS
6.1.2.1 Material Handling & Storage
6.1.2.2 Transport & Precautions
6.1.2.3 Hazard Identification
7 MARKET OVERVIEW
7.1 DRIVERS
7.1.1 INCREASING DEMAND FOR ELECTRIC & HYBRID VEHICLES
7.1.2 EXPANSION OF RENEWABLE ENERGY SECTOR
7.1.3 GROWTH IN POWER GENERATION & ELECTROMECHANICAL SYSTEMS
7.1.4 RISING DEMAND FOR DEFENCE & AEROSPACE APPLICATIONS
7.2 RESTRAINTS
7.2.1 PRICE VOLATILITY OF RAW MATERIALS
7.2.2 HEAVY DEPENDENCE ON LIMITED RARE EARTH SUPPLIERS
7.3 OPPORTUNITIES
7.3.1 INCREASING INVESTMENTS IN SMART FACTORIES & INDUSTRY 4.0
7.3.2 DEVELOPMENT OF HIGH-PERFORMANCE MAGNETS FOR ADVANCE MOTORS
7.3.3 GROWTH IN MEDICAL TECHNOLOGY AND DIAGNOSTIC EQUIPMENT’S
7.4 CHALLENGES
7.4.1 ADAPTING RAPID CHANGES IN END USER INDUSTRIES
7.4.2 HANDLING TECHNOLOGICAL OBSOLESCE RISKS
8 NORTH AMERICA MAGNET MARKET, BY PRODUCT TYPE, 2018-2033 (USD THOUSAND)
8.1 OVERVIEW
8.2 NORTH AMERICA MAGNET MARKET, BY PRODUCT TYPE, 2018-2033 (USD THOUSAND)
8.2.1 NEODYMIUM MAGNETS (NDFEB)
8.2.2 FERRITE MAGNETS
8.2.3 SAMARIUM COBALT MAGNETS (SMCO)
8.2.4 ALNICO MAGNETS
8.2.5 OTHERS
8.3 NORTH AMERICA MAGNET MARKET, BY PRODUCT TYPE, 2018-2033 (TONS)
8.3.1 NEODYMIUM MAGNETS (NDFEB)
8.3.2 FERRITE MAGNETS
8.3.3 SAMARIUM COBALT MAGNETS (SMCO)
8.3.4 ALNICO MAGNETS
8.3.5 OTHERS
8.4 NORTH AMERICA NEODYMIUM MAGNETS (NDFEB) IN MAGNET MARKET, BY TYPE, 2018-2033 (USD THOUSAND)
8.4.1 SINTERED NDFEB
8.4.2 BONDED NDFEB
8.4.3 HOT-PRESSED
8.5 NORTH AMERICA NEODYMIUM MAGNETS (NDFEB) IN MAGNET MARKET, BY COATING TYPE, 2018-2033 (USD THOUSAND)
8.5.1 NICKEL
8.5.2 EPOXY
8.5.3 ZINC
8.5.4 OTHERS
8.6 NEODYMIUM MAGNETS (NDFEB) IN MAGNET MARKET, BY REGION, 2018-2033 (USD THOUSAND)
8.6.1 ASIA-PACIFIC
8.6.2 NORTH AMERICA
8.6.3 EUROPE
8.6.4 SOUTH AMERICA
8.6.5 MIDDLE EAST & AFRICA
8.7 NEODYMIUM MAGNETS (NDFEB) IN MAGNET MARKET, BY REGION, 2018-2033 (TONS)
8.7.1 ASIA-PACIFIC
8.7.2 NORTH AMERICA
8.7.3 EUROPE
8.7.4 SOUTH AMERICA
8.7.5 MIDDLE EAST & AFRICA
8.8 NORTH AMERICA FERRITE MAGNETS IN MAGNET MARKET, BY TYPE, 2018-2033 (USD THOUSAND)
8.8.1 ANISOTROPIC
8.8.2 ISOTROPIC
8.9 NORTH AMERICA FERRITE MAGNETS IN MAGNET MARKET, BY MANUFACTURING PROCESS, 2018-2033 (USD THOUSAND)
8.9.1 WET PRESSING
8.9.2 DRY PRESSING
8.1 FERRITE MAGNETS IN MAGNET MARKET, BY REGION, 2018-2033 (USD THOUSAND)
8.10.1 ASIA-PACIFIC
8.10.2 NORTH AMERICA
8.10.3 EUROPE
8.10.4 SOUTH AMERICA
8.10.5 MIDDLE EAST & AFRICA
8.11 FERRITE MAGNETSIN MAGNET MARKET, BY REGION, 2018-2033 (TONS)
8.11.1 ASIA-PACIFIC
8.11.2 NORTH AMERICA
8.11.3 EUROPE
8.11.4 SOUTH AMERICA
8.11.5 MIDDLE EAST & AFRICA
8.12 NORTH AMERICA SAMARIUM COBALT MAGNETS (SMCO) IN MAGNET MARKET, BY GRADE TYPE, 2018-2033 (USD THOUSAND)
8.12.1 12/30/1899 01:05:00
8.12.2 12/30/1899 02:17:00
8.13 SAMARIUM COBALT MAGNETS (SMCO) IN MAGNET MARKET, BY REGION, 2018-2033 (USD THOUSAND)
8.13.1 ASIA-PACIFIC
8.13.2 NORTH AMERICA
8.13.3 EUROPE
8.13.4 SOUTH AMERICA
8.13.5 MIDDLE EAST & AFRICA
8.14 SAMARIUM COBALT MAGNETS (SMCO) IN MAGNET MARKET, BY REGION, 2018-2033 (TONS)
8.14.1 ASIA-PACIFIC
8.14.2 NORTH AMERICA
8.14.3 EUROPE
8.14.4 SOUTH AMERICA
8.14.5 MIDDLE EAST & AFRICA
8.15 ALNICO MAGNETS IN MAGNET MARKET, BY REGION, 2018-2033 (USD THOUSAND)
8.15.1 ASIA-PACIFIC
8.15.2 NORTH AMERICA
8.15.3 EUROPE
8.15.4 SOUTH AMERICA
8.15.5 MIDDLE EAST & AFRICA
8.16 ALNICO MAGNETSIN MAGNET MARKET, BY REGION, 2018-2033 (TONS)
8.16.1 ASIA-PACIFIC
8.16.2 NORTH AMERICA
8.16.3 EUROPE
8.16.4 SOUTH AMERICA
8.16.5 MIDDLE EAST & AFRICA
8.17 OTHERS IN MAGNET MARKET, BY REGION, 2018-2033 (USD THOUSAND)
8.17.1 ASIA-PACIFIC
8.17.2 NORTH AMERICA
8.17.3 EUROPE
8.17.4 SOUTH AMERICA
8.17.5 MIDDLE EAST & AFRICA
8.18 OTHERS IN MAGNET MARKET, BY REGION, 2018-2033 (TONS)
8.18.1 ASIA-PACIFIC
8.18.2 NORTH AMERICA
8.18.3 EUROPE
8.18.4 SOUTH AMERICA
8.18.5 MIDDLE EAST & AFRICA
9 NORTH AMERICA MAGNET MARKET, BY RAW MATERIAL, 2018-2033 (USD THOUSAND)
9.1 OVERVIEW
9.2 NORTH AMERICA MAGNET MARKET, BY RAW MATERIAL, 2018-2033 (USD THOUSAND)
9.2.1 RARE EARTH ELEMENTS
9.2.2 FERRITE MATERIALS
9.2.3 ALUMINUM NICKEL COBALT (ALNICO) ALLOYS
9.2.4 OTHERS
9.3 NORTH AMERICA MAGNET MARKET, BY RAW MATERIAL, 2018-2033 (TONS)
9.3.1 RARE EARTH ELEMENTS
9.3.2 FERRITE MATERIALS
9.3.3 ALUMINUM NICKEL COBALT (ALNICO) ALLOYS
9.3.4 OTHERS
9.4 NORTH AMERICA RARE EARTH ELEMENTS IN MAGNET MARKET, BY TYPE, 2018-2033 (USD THOUSAND)
9.4.1 NEODYMIUM
9.4.2 DYSPROSIUM
9.4.3 SAMARIUM
9.5 RARE EARTH ELEMENTS IN MAGNET MARKET, BY REGION, 2018-2033 (USD THOUSAND)
9.5.1 ASIA-PACIFIC
9.5.2 NORTH AMERICA
9.5.3 EUROPE
9.5.4 SOUTH AMERICA
9.5.5 MIDDLE EAST & AFRICA
9.6 RARE EARTH ELEMENTS IN MAGNET MARKET, BY REGION, 2018-2033 (TONS)
9.6.1 ASIA-PACIFIC
9.6.2 NORTH AMERICA
9.6.3 EUROPE
9.6.4 SOUTH AMERICA
9.6.5 MIDDLE EAST & AFRICA
9.7 NORTH AMERICA FERRITE MATERIALS IN MAGNET MARKET, BY TYPE, 2018-2033 (USD THOUSAND)
9.7.1 IRON OXIDE
9.7.2 BARIUM CARBONATE
9.7.3 STRONTIUM CARBONATE
9.8 FERRITE MATERIALS IN MAGNET MARKET, BY REGION, 2018-2033 (USD THOUSAND)
9.8.1 ASIA-PACIFIC
9.8.2 NORTH AMERICA
9.8.3 EUROPE
9.8.4 SOUTH AMERICA
9.8.5 MIDDLE EAST & AFRICA
9.9 FERRITE MATERIALS IN MAGNET MARKET, BY REGION, 2018-2033 (TONS)
9.9.1 ASIA-PACIFIC
9.9.2 NORTH AMERICA
9.9.3 EUROPE
9.9.4 SOUTH AMERICA
9.9.5 MIDDLE EAST & AFRICA
9.1 ALUMINUM NICKEL COBALT (ALNICO) ALLOYS IN MAGNET MARKET, BY REGION, 2018-2033 (USD THOUSAND)
9.10.1 ASIA-PACIFIC
9.10.2 NORTH AMERICA
9.10.3 EUROPE
9.10.4 SOUTH AMERICA
9.10.5 MIDDLE EAST & AFRICA
9.11 ALUMINUM NICKEL COBALT (ALNICO) ALLOYS IN MAGNET MARKET, BY REGION, 2018-2033 (TONS)
9.11.1 ASIA-PACIFIC
9.11.2 NORTH AMERICA
9.11.3 EUROPE
9.11.4 SOUTH AMERICA
9.11.5 MIDDLE EAST & AFRICA
9.12 OTHERS IN MAGNET MARKET, BY REGION, 2018-2033 (USD THOUSAND)
9.12.1 ASIA-PACIFIC
9.12.2 NORTH AMERICA
9.12.3 EUROPE
9.12.4 SOUTH AMERICA
9.12.5 MIDDLE EAST & AFRICA
9.13 OTHERS IN MAGNET MARKET, BY REGION, 2018-2033 (TONS)
9.13.1 ASIA-PACIFIC
9.13.2 NORTH AMERICA
9.13.3 EUROPE
9.13.4 SOUTH AMERICA
9.13.5 MIDDLE EAST & AFRICA
10 NORTH AMERICA MAGNET MARKET, BY FUNCTION, 2018-2033 (USD THOUSAND)
10.1 OVERVIEW
10.2 NORTH AMERICA MAGNET MARKET, BY FUNCTION, 2018-2033 (USD THOUSAND)
10.2.1 PERMANENT MAGNETS
10.2.2 ELECTROMAGNETS
10.2.3 FLEXIBLE MAGNETS
10.2.4 TEMPORARY MAGNETS
10.2.5 HYBRID MAGNETS
10.2.6 OTHERS
10.3 NORTH AMERICA MAGNET MARKET, BY FUNCTION, 2018-2033 (TONS)
10.3.1 PERMANENT MAGNETS
10.3.2 ELECTROMAGNETS
10.3.3 FLEXIBLE MAGNETS
10.3.4 TEMPORARY MAGNETS
10.3.5 HYBRID MAGNETS
10.3.6 OTHERS
10.4 PERMANENT MAGNETS IN MAGNET MARKET, BY REGION, 2018-2033 (USD THOUSAND)
10.4.1 ASIA-PACIFIC
10.4.2 NORTH AMERICA
10.4.3 EUROPE
10.4.4 SOUTH AMERICA
10.4.5 MIDDLE EAST & AFRICA
10.5 PERMANENT MAGNETS IN MAGNET MARKET, BY REGION, 2018-2033 (TONS)
10.5.1 ASIA-PACIFIC
10.5.2 NORTH AMERICA
10.5.3 EUROPE
10.5.4 SOUTH AMERICA
10.5.5 MIDDLE EAST & AFRICA
10.6 ELECTROMAGNETS IN MAGNET MARKET, BY REGION, 2018-2033 (USD THOUSAND)
10.6.1 ASIA-PACIFIC
10.6.2 NORTH AMERICA
10.6.3 EUROPE
10.6.4 SOUTH AMERICA
10.6.5 MIDDLE EAST & AFRICA
10.7 ELECTROMAGNETS IN MAGNET MARKET, BY REGION, 2018-2033 (TONS)
10.7.1 ASIA-PACIFIC
10.7.2 NORTH AMERICA
10.7.3 EUROPE
10.7.4 SOUTH AMERICA
10.7.5 MIDDLE EAST & AFRICA
10.8 FLEXIBLE MAGNETS IN MAGNET MARKET, BY REGION, 2018-2033 (USD THOUSAND)
10.8.1 ASIA-PACIFIC
10.8.2 NORTH AMERICA
10.8.3 EUROPE
10.8.4 SOUTH AMERICA
10.8.5 MIDDLE EAST & AFRICA
10.9 FLEXIBLE MAGNETS IN MAGNET MARKET, BY REGION, 2018-2033 (TONS)
10.9.1 ASIA-PACIFIC
10.9.2 NORTH AMERICA
10.9.3 EUROPE
10.9.4 SOUTH AMERICA
10.9.5 MIDDLE EAST & AFRICA
10.1 TEMPORARY MAGNETS IN MAGNET MARKET, BY REGION, 2018-2033 (USD THOUSAND)
10.10.1 ASIA-PACIFIC
10.10.2 NORTH AMERICA
10.10.3 EUROPE
10.10.4 SOUTH AMERICA
10.10.5 MIDDLE EAST & AFRICA
10.11 TEMPORARY MAGNETS IN MAGNET MARKET, BY REGION, 2018-2033 (TONS)
10.11.1 ASIA-PACIFIC
10.11.2 NORTH AMERICA
10.11.3 EUROPE
10.11.4 SOUTH AMERICA
10.11.5 MIDDLE EAST & AFRICA
10.12 HYBRID MAGNETS IN MAGNET MARKET, BY REGION, 2018-2033 (USD THOUSAND)
10.12.1 ASIA-PACIFIC
10.12.2 NORTH AMERICA
10.12.3 EUROPE
10.12.4 SOUTH AMERICA
10.12.5 MIDDLE EAST & AFRICA
10.13 HYBRID MAGNETS IN MAGNET MARKET, BY REGION, 2018-2033 (TONS)
10.13.1 ASIA-PACIFIC
10.13.2 NORTH AMERICA
10.13.3 EUROPE
10.13.4 SOUTH AMERICA
10.13.5 MIDDLE EAST & AFRICA
10.14 OTHERS IN MAGNET MARKET, BY REGION, 2018-2033 (USD THOUSAND)
10.14.1 ASIA-PACIFIC
10.14.2 NORTH AMERICA
10.14.3 EUROPE
10.14.4 SOUTH AMERICA
10.14.5 MIDDLE EAST & AFRICA
10.15 OTHERS IN MAGNET MARKET, BY REGION, 2018-2033 (TONS)
10.15.1 ASIA-PACIFIC
10.15.2 NORTH AMERICA
10.15.3 EUROPE
10.15.4 SOUTH AMERICA
10.15.5 MIDDLE EAST & AFRICA
10.16 NORTH AMERICA MAGNET MARKET, BY APPLICATION, 2018-2033 (USD THOUSAND)
11 NORTH AMERICA MAGNET MARKET, BY APPLICATION, 2018-2033 (USD THOUSAND)
11.1 OVERVIEW
11.2 AUTOMOTIVE
11.3 ELECTRONICS
11.4 INDUSTRIAL MACHINERY
11.5 ENERGY
11.6 CONSUMER APPLIANCES
11.7 MEDICAL DEVICES
11.8 MILITARY & DEFENSE
11.9 OTHERS
11.1 NORTH AMERICA MAGNET MARKET, BY APPLICATION, 2018-2033 (TONS)
11.10.1 AUTOMOTIVE
11.10.2 ELECTRONICS
11.10.3 INDUSTRIAL MACHINERY
11.10.4 ENERGY
11.10.5 CONSUMER APPLIANCES
11.10.6 MEDICAL DEVICES
11.10.7 MILITARY & DEFENSE
11.10.8 OTHERS
11.11 AUTOMOTIVE IN MAGNET MARKET, BY REGION, 2018-2033 (USD THOUSAND)
11.11.1 ASIA-PACIFIC
11.11.2 NORTH AMERICA
11.11.3 EUROPE
11.11.4 SOUTH AMERICA
11.11.5 MIDDLE EAST & AFRICA
11.12 AUTOMOTIVE IN MAGNET MARKET, BY REGION, 2018-2033 (TONS)
11.12.1 ASIA-PACIFIC
11.12.2 NORTH AMERICA
11.12.3 EUROPE
11.12.4 SOUTH AMERICA
11.12.5 MIDDLE EAST & AFRICA
11.13 ELECTRONICS IN MAGNET MARKET, BY REGION, 2018-2033 (USD THOUSAND)
11.13.1 ASIA-PACIFIC
11.13.2 NORTH AMERICA
11.13.3 EUROPE
11.13.4 SOUTH AMERICA
11.13.5 MIDDLE EAST & AFRICA
11.14 ELECTRONICS IN MAGNET MARKET, BY REGION, 2018-2033 (TONS)
11.14.1 ASIA-PACIFIC
11.14.2 NORTH AMERICA
11.14.3 EUROPE
11.14.4 SOUTH AMERICA
11.14.5 MIDDLE EAST & AFRICA
11.15 INDUSTRIAL MACHINERY IN MAGNET MARKET, BY REGION, 2018-2033 (USD THOUSAND)
11.15.1 ASIA-PACIFIC
11.15.2 NORTH AMERICA
11.15.3 EUROPE
11.15.4 SOUTH AMERICA
11.15.5 MIDDLE EAST & AFRICA
11.16 INDUSTRIAL MACHINERY IN MAGNET MARKET, BY REGION, 2018-2033 (TONS)
11.16.1 ASIA-PACIFIC
11.16.2 NORTH AMERICA
11.16.3 EUROPE
11.16.4 SOUTH AMERICA
11.16.5 MIDDLE EAST & AFRICA
11.17 ENERGY IN MAGNET MARKET, BY REGION, 2018-2033 (USD THOUSAND)
11.17.1 ASIA-PACIFIC
11.17.2 NORTH AMERICA
11.17.3 EUROPE
11.17.4 SOUTH AMERICA
11.17.5 MIDDLE EAST & AFRICA
11.18 ENERGY IN MAGNET MARKET, BY REGION, 2018-2033 (TONS)
11.18.1 ASIA-PACIFIC
11.18.2 NORTH AMERICA
11.18.3 EUROPE
11.18.4 SOUTH AMERICA
11.18.5 MIDDLE EAST & AFRICA
11.19 CONSUMER APPLIANCES IN MAGNET MARKET, BY REGION, 2018-2033 (USD THOUSAND)
11.19.1 ASIA-PACIFIC
11.19.2 NORTH AMERICA
11.19.3 EUROPE
11.19.4 SOUTH AMERICA
11.19.5 MIDDLE EAST & AFRICA
11.2 CONSUMER APPLIANCES IN MAGNET MARKET, BY REGION, 2018-2033 (TONS)
11.20.1 ASIA-PACIFIC
11.20.2 NORTH AMERICA
11.20.3 EUROPE
11.20.4 SOUTH AMERICA
11.20.5 MIDDLE EAST & AFRICA
11.21 MEDICAL DEVICES IN MAGNET MARKET, BY REGION, 2018-2033 (USD THOUSAND)
11.21.1 ASIA-PACIFIC
11.21.2 NORTH AMERICA
11.21.3 EUROPE
11.21.4 SOUTH AMERICA
11.21.5 MIDDLE EAST & AFRICA
11.22 MEDICAL DEVICES IN MAGNET MARKET, BY REGION, 2018-2033 (TONS)
11.22.1 ASIA-PACIFIC
11.22.2 NORTH AMERICA
11.22.3 EUROPE
11.22.4 SOUTH AMERICA
11.22.5 MIDDLE EAST & AFRICA
11.23 MILITARY & DEFENSE IN MAGNET MARKET, BY REGION, 2018-2033 (USD THOUSAND)
11.23.1 ASIA-PACIFIC
11.23.2 NORTH AMERICA
11.23.3 EUROPE
11.23.4 SOUTH AMERICA
11.23.5 MIDDLE EAST & AFRICA
11.24 MILITARY & DEFENSE IN MAGNET MARKET, BY REGION, 2018-2033 (TONS)
11.24.1 ASIA-PACIFIC
11.24.2 NORTH AMERICA
11.24.3 EUROPE
11.24.4 SOUTH AMERICA
11.24.5 MIDDLE EAST & AFRICA
11.25 OTHERS IN MAGNET MARKET, BY REGION, 2018-2033 (USD THOUSAND)
11.25.1 ASIA-PACIFIC
11.25.2 NORTH AMERICA
11.25.3 EUROPE
11.25.4 SOUTH AMERICA
11.25.5 MIDDLE EAST & AFRICA
11.26 OTHERS IN MAGNET MARKET, BY REGION, 2018-2033 (TONS)
11.26.1 ASIA-PACIFIC
11.26.2 NORTH AMERICA
11.26.3 EUROPE
11.26.4 SOUTH AMERICA
11.26.5 MIDDLE EAST & AFRICA
12 NORTH AMERICA MAGNET MARKET, BY END USER, 2018-2033 (USD THOUSAND)
12.1 OVERVIEW
12.2 NORTH AMERICA MAGNET MARKET, BY END USER, 2018-2033 (USD THOUSAND)
12.2.1 AUTOMOTIVE MANUFACTURERS
12.2.2 ELECTRONICS & SEMICONDUCTOR COMPANIES
12.2.3 INDUSTRIAL EQUIPMENT MANUFACTURERS
12.2.4 ENERGY COMPANIES
12.2.5 HEALTHCARE AND MEDICAL DEVICE MANUFACTURERS
12.2.6 OTHERS
12.3 NORTH AMERICA MAGNET MARKET, BY END USER, 2018-2033 (TONS)
12.3.1 AUTOMOTIVE MANUFACTURERS
12.3.2 ELECTRONICS & SEMICONDUCTOR COMPANIES
12.3.3 INDUSTRIAL EQUIPMENT MANUFACTURERS
12.3.4 ENERGY COMPANIES
12.3.5 HEALTHCARE AND MEDICAL DEVICE MANUFACTURERS
12.3.6 OTHERS
12.4 AUTOMOTIVE MANUFACTURERS IN MAGNET MARKET, BY REGION, 2018-2033 (USD THOUSAND)
12.4.1 ASIA-PACIFIC
12.4.2 NORTH AMERICA
12.4.3 EUROPE
12.4.4 SOUTH AMERICA
12.4.5 MIDDLE EAST & AFRICA
12.5 AUTOMOTIVE MANUFACTURERS IN MAGNET MARKET, BY REGION, 2018-2033 (TONS)
12.5.1 ASIA-PACIFIC
12.5.2 NORTH AMERICA
12.5.3 EUROPE
12.5.4 SOUTH AMERICA
12.5.5 MIDDLE EAST & AFRICA
12.6 ELECTRONICS & SEMICONDUCTOR COMPANIES IN MAGNET MARKET, BY REGION, 2018-2033 (USD THOUSAND)
12.6.1 ASIA-PACIFIC
12.6.2 NORTH AMERICA
12.6.3 EUROPE
12.6.4 SOUTH AMERICA
12.6.5 MIDDLE EAST & AFRICA
12.7 ELECTRONICS & SEMICONDUCTOR COMPANIES IN MAGNET MARKET, BY REGION, 2018-2033 (TONS)
12.7.1 ASIA-PACIFIC
12.7.2 NORTH AMERICA
12.7.3 EUROPE
12.7.4 SOUTH AMERICA
12.7.5 MIDDLE EAST & AFRICA
12.8 INDUSTRIAL EQUIPMENT MANUFACTURERS IN MAGNET MARKET, BY REGION, 2018-2033 (USD THOUSAND)
12.8.1 ASIA-PACIFIC
12.8.2 NORTH AMERICA
12.8.3 EUROPE
12.8.4 SOUTH AMERICA
12.8.5 MIDDLE EAST & AFRICA
12.9 INDUSTRIAL EQUIPMENT MANUFACTURERS IN MAGNET MARKET, BY REGION, 2018-2033 (TONS)
12.9.1 ASIA-PACIFIC
12.9.2 NORTH AMERICA
12.9.3 EUROPE
12.9.4 SOUTH AMERICA
12.9.5 MIDDLE EAST & AFRICA
12.1 ENERGY COMPANIES IN MAGNET MARKET, BY REGION, 2018-2033 (USD THOUSAND)
12.10.1 ASIA-PACIFIC
12.10.2 NORTH AMERICA
12.10.3 EUROPE
12.10.4 SOUTH AMERICA
12.10.5 MIDDLE EAST & AFRICA
12.11 ENERGY COMPANIES IN MAGNET MARKET, BY REGION, 2018-2033 (TONS)
12.11.1 ASIA-PACIFIC
12.11.2 NORTH AMERICA
12.11.3 EUROPE
12.11.4 SOUTH AMERICA
12.11.5 MIDDLE EAST & AFRICA
12.12 HEALTHCARE AND MEDICAL DEVICE MANUFACTURERS IN MAGNET MARKET, BY REGION, 2018-2033 (USD THOUSAND)
12.12.1 ASIA-PACIFIC
12.12.2 NORTH AMERICA
12.12.3 EUROPE
12.12.4 SOUTH AMERICA
12.12.5 MIDDLE EAST & AFRICA
12.13 HEALTHCARE AND MEDICAL DEVICE MANUFACTURERS IN MAGNET MARKET, BY REGION, 2018-2033 (TONS)
12.13.1 ASIA-PACIFIC
12.13.2 NORTH AMERICA
12.13.3 EUROPE
12.13.4 SOUTH AMERICA
12.13.5 MIDDLE EAST & AFRICA
12.14 OTHERS IN MAGNET MARKET, BY REGION, 2018-2033 (USD THOUSAND)
12.14.1 ASIA-PACIFIC
12.14.2 NORTH AMERICA
12.14.3 EUROPE
12.14.4 SOUTH AMERICA
12.14.5 MIDDLE EAST & AFRICA
12.15 OTHERS IN MAGNET MARKET, BY REGION, 2018-2033 (TONS)
12.15.1 ASIA-PACIFIC
12.15.2 NORTH AMERICA
12.15.3 EUROPE
12.15.4 SOUTH AMERICA
12.15.5 MIDDLE EAST & AFRICA
13 NORTH AMERICA MAGNET MARKET, BY DISTRIBUTION CHANNEL, 2018-2033 (USD THOUSAND)
13.1 OVERVIEW
13.2 NORTH AMERICA MAGNET MARKET, BY DISTRIBUTION CHANNEL, 2018-2033 (USD THOUSAND)
13.2.1 DIRECT
13.2.2 INDIRECT
13.3 NORTH AMERICA MAGNET MARKET, BY DISTRIBUTION CHANNEL, 2018-2033 (TONS)
13.3.1 DIRECT
13.3.2 INDIRECT
13.4 DIRECT IN MAGNET MARKET, BY REGION, 2018-2033 (USD THOUSAND)
13.4.1 ASIA-PACIFIC
13.4.2 NORTH AMERICA
13.4.3 EUROPE
13.4.4 SOUTH AMERICA
13.4.5 MIDDLE EAST & AFRICA
13.5 DIRECT IN MAGNET MARKET, BY REGION, 2018-2033 (TONS)
13.5.1 ASIA-PACIFIC
13.5.2 NORTH AMERICA
13.5.3 EUROPE
13.5.4 SOUTH AMERICA
13.5.5 MIDDLE EAST & AFRICA
13.6 INDIRECT IN MAGNET MARKET, BY REGION, 2018-2033 (USD THOUSAND)
13.6.1 ASIA-PACIFIC
13.6.2 NORTH AMERICA
13.6.3 EUROPE
13.6.4 SOUTH AMERICA
13.6.5 MIDDLE EAST & AFRICA
13.7 INDIRECT IN MAGNET MARKET, BY REGION, 2018-2033 (TONS)
13.7.1 ASIA-PACIFIC
13.7.2 NORTH AMERICA
13.7.3 EUROPE
13.7.4 SOUTH AMERICA
13.7.5 MIDDLE EAST & AFRICA
14 NORTH AMERICA MAGNET MARKET, BY REGION
14.1 NORTH AMERICA
14.1.1 U.S.
14.1.2 CANADA
14.1.3 MEXICO
15 NORTH AMERICA MAGNET MARKET: COMPANY LANDSCAPE
15.1 COMPANY SHARE ANALYSIS: GLOBAL
16 SWOT ANALYSIS
17 COMPANY PROFILE
17.1 SHIN-ETSU CHEMICAL CO., LTD.
17.1.1 COMPANY SNAPSHOT
17.1.2 REVENUE ANALYSIS
17.1.3 COMPANY SHARE ANALYSIS
17.1.4 PRODUCT/SERVICE PORTFOLIO
17.1.5 RECENT DEVELOPMENT
17.2 TDK CORPORATION
17.2.1 COMPANY SNAPSHOT
17.2.2 REVENUE ANALYSIS
17.2.3 COMPANY SHARE ANALYSIS
17.2.4 PRODUCT PORTFOLIO
17.2.5 RECENT DEVELOPMENT
17.3 DAIDO STEEL CO., LTD.
17.3.1 COMPANY SNAPSHOT
17.3.2 REVENUE ANALYSIS
17.3.3 COMPANY SHARE ANALYSIS
17.3.4 PRODUCT/SERVICE PORTFOLIO
17.3.5 RECENT DEVELOPMENT
17.4 PROTERIAL, LTD. (FORMERLY HITACHI METALS, LTD.)
17.4.1 COMPANY SNAPSHOT
17.4.2 COMPANY SHARE ANALYSIS
17.4.3 PRODUCT PORTFOLIO
17.4.4 RECENT DEVELOPMENT
17.5 ARNOLD MAGNETIC TECHNOLOGIES
17.5.1 COMPANY SNAPSHOT
17.5.2 COMPANY SHARE ANALYSIS
17.5.3 PRODUCT PORTFOLIO
17.5.4 RECENT DEVELOPMENT
17.6 ADAMS MAGNETIC PRODUCTS, LLC
17.6.1 COMPANY SNAPSHOT
17.6.2 PRODUCT/SERVICE PORTFOLIO
17.6.3 RECENT DEVELOPMENT
17.7 BUNTING MAGNETICS CO.
17.7.1 COMPANY SNAPSHOT
17.7.2 PRODUCT PORTFOLIO
17.7.3 RECENT DEVELOPMENT
17.8 DURA MAGNETICS INC.
17.8.1 COMPANY SNAPSHOT
17.8.2 PRODUCT PORTFOLIO
17.9 ELECTRON ENERGY CORPORATION
17.9.1 COMPANY SNAPSHOT
17.9.2 PRODUCT/SERVICE PORTFOLIO
17.9.3 RECENT DEVELOPMENT
17.1 GOUDSMIT MAGNETICS
17.10.1 COMPANY SNAPSHOT
17.10.2 PRODUCT PORTFOLIO
17.10.3 RECENT DEVELOPMENT
17.11 MAGNEQUENCH
17.11.1 COMPANY SNAPSHOT
17.11.2 REVENUE ANALYSIS
17.11.3 PRODUCT PORTFOLIO
17.11.4 RECENT DEVELOPMENT
17.12 NINGBO YUNSHENG CO. LTD
17.12.1 COMPANY SNAPSHOT
17.12.2 REVENUE ANALYSIS
17.12.3 PRODUCT PORTFOLIO
17.12.4 RECENT DEVELOPMENT
17.13 ZHEJIANG INNUOVO MAGNETICS CO.,LTD.
17.13.1 COMPANY SNAPSHOT
17.13.2 PRODUCT/SERVICE PORTFOLIO
17.13.3 RECENT DEVELOPMENT
18 QUESTIONNAIRE
19 RELATED REPORT
List of Table
E 10 NORTH AMERICA FERRITE MAGNETS IN MAGNET MARKET, BY MANUFACTURING PROCESS, 2018-2033 (USD THOUSAND)
TABLE 11 FERRITE MAGNETS IN MAGNET MARKET, BY REGION, 2018-2033 (USD THOUSAND)
TABLE 12 FERRITE MAGNETSIN MAGNET MARKET, BY REGION, 2018-2033 (TONS)
TABLE 13 NORTH AMERICA SAMARIUM COBALT MAGNETS (SMCO) IN MAGNET MARKET, BY GRADE TYPE, 2018-2033 (USD THOUSAND)
TABLE 14 SAMARIUM COBALT MAGNETS (SMCO) IN MAGNET MARKET, BY REGION, 2018-2033 (USD THOUSAND)
TABLE 15 SAMARIUM COBALT MAGNETS (SMCO) IN MAGNET MARKET, BY REGION, 2018-2033 (TONS)
TABLE 16 ALNICO MAGNETS IN MAGNET MARKET, BY REGION, 2018-2033 (USD THOUSAND)
TABLE 17 ALNICO MAGNETSIN MAGNET MARKET, BY REGION, 2018-2033 (TONS)
TABLE 18 OTHERS IN MAGNET MARKET, BY REGION, 2018-2033 (USD THOUSAND)
TABLE 19 OTHERS IN MAGNET MARKET, BY REGION, 2018-2033 (TONS)
TABLE 20 NORTH AMERICA MAGNET MARKET, BY RAW MATERIAL, 2018-2033 (USD THOUSAND)
TABLE 21 NORTH AMERICA MAGNET MARKET, BY RAW MATERIAL, 2018-2033 (TONS)
TABLE 22 NORTH AMERICA RARE EARTH ELEMENTS IN MAGNET MARKET, BY TYPE, 2018-2033 (USD THOUSAND)
TABLE 23 RARE EARTH ELEMENTS IN MAGNET MARKET, BY REGION, 2018-2033 (USD THOUSAND)
TABLE 24 RARE EARTH ELEMENTS IN MAGNET MARKET, BY REGION, 2018-2033 (TONS)
TABLE 25 NORTH AMERICA FERRITE MATERIALS IN MAGNET MARKET, BY TYPE, 2018-2033 (USD THOUSAND)
TABLE 26 FERRITE MATERIALS IN MAGNET MARKET, BY REGION, 2018-2033 (USD THOUSAND)
TABLE 27 FERRITE MATERIALS IN MAGNET MARKET, BY REGION, 2018-2033 (TONS)
TABLE 28 ALUMINUM NICKEL COBALT (ALNICO) ALLOYS IN MAGNET MARKET, BY REGION, 2018-2033 (USD THOUSAND)
TABLE 29 ALUMINUM NICKEL COBALT (ALNICO) ALLOYS IN MAGNET MARKET, BY REGION, 2018-2033 (TONS)
TABLE 30 OTHERS IN MAGNET MARKET, BY REGION, 2018-2033 (USD THOUSAND)
TABLE 31 OTHERS IN MAGNET MARKET, BY REGION, 2018-2033 (TONS)
TABLE 32 NORTH AMERICA MAGNET MARKET, BY FUNCTION, 2018-2033 (USD THOUSAND)
TABLE 33 NORTH AMERICA MAGNET MARKET, BY FUNCTION, 2018-2033 (TONS)
TABLE 34 PERMANENT MAGNETS IN MAGNET MARKET, BY REGION, 2018-2033 (USD THOUSAND)
TABLE 35 PERMANENT MAGNETS IN MAGNET MARKET, BY REGION, 2018-2033 (TONS)
TABLE 36 ELECTROMAGNETS IN MAGNET MARKET, BY REGION, 2018-2033 (USD THOUSAND)
TABLE 37 ELECTROMAGNETS IN MAGNET MARKET, BY REGION, 2018-2033 (TONS)
TABLE 38 FLEXIBLE MAGNETS IN MAGNET MARKET, BY REGION, 2018-2033 (USD THOUSAND)
TABLE 39 FLEXIBLE MAGNETS IN MAGNET MARKET, BY REGION, 2018-2033 (TONS)
TABLE 40 TEMPORARY MAGNETS IN MAGNET MARKET, BY REGION, 2018-2033 (USD THOUSAND)
TABLE 41 TEMPORARY MAGNETS IN MAGNET MARKET, BY REGION, 2018-2033 (TONS)
TABLE 42 HYBRID MAGNETS IN MAGNET MARKET, BY REGION, 2018-2033 (USD THOUSAND)
TABLE 43 HYBRID MAGNETS IN MAGNET MARKET, BY REGION, 2018-2033 (TONS)
TABLE 44 OTHERS IN MAGNET MARKET, BY REGION, 2018-2033 (USD THOUSAND)
TABLE 45 OTHERS IN MAGNET MARKET, BY REGION, 2018-2033 (TONS)
TABLE 46 NORTH AMERICA MAGNET MARKET, BY APPLICATION, 2018-2033 (USD THOUSAND)
TABLE 47 NORTH AMERICA MAGNET MARKET, BY APPLICATION, 2018-2033 (TONS)
TABLE 48 AUTOMOTIVE IN MAGNET MARKET, BY REGION, 2018-2033 (USD THOUSAND)
TABLE 49 AUTOMOTIVE IN MAGNET MARKET, BY REGION, 2018-2033 (TONS)
TABLE 50 ELECTRONICS IN MAGNET MARKET, BY REGION, 2018-2033 (USD THOUSAND)
TABLE 51 ELECTRONICS IN MAGNET MARKET, BY REGION, 2018-2033 (TONS)
TABLE 52 INDUSTRIAL MACHINERY IN MAGNET MARKET, BY REGION, 2018-2033 (USD THOUSAND)
TABLE 53 INDUSTRIAL MACHINERY IN MAGNET MARKET, BY REGION, 2018-2033 (TONS)
TABLE 54 ENERGY IN MAGNET MARKET, BY REGION, 2018-2033 (USD THOUSAND)
TABLE 55 ENERGY IN MAGNET MARKET, BY REGION, 2018-2033 (TONS)
TABLE 56 CONSUMER APPLIANCES IN MAGNET MARKET, BY REGION, 2018-2033 (USD THOUSAND)
TABLE 57 CONSUMER APPLIANCES IN MAGNET MARKET, BY REGION, 2018-2033 (TONS)
TABLE 58 MEDICAL DEVICES IN MAGNET MARKET, BY REGION, 2018-2033 (USD THOUSAND)
TABLE 59 MEDICAL DEVICES IN MAGNET MARKET, BY REGION, 2018-2033 (TONS)
TABLE 60 MILITARY & DEFENSE IN MAGNET MARKET, BY REGION, 2018-2033 (USD THOUSAND)
TABLE 61 MILITARY & DEFENSE IN MAGNET MARKET, BY REGION, 2018-2033 (TONS)
TABLE 62 OTHERS IN MAGNET MARKET, BY REGION, 2018-2033 (USD THOUSAND)
TABLE 63 OTHERS IN MAGNET MARKET, BY REGION, 2018-2033 (TONS)
TABLE 64 NORTH AMERICA MAGNET MARKET, BY END USER, 2018-2033 (USD THOUSAND)
TABLE 65 NORTH AMERICA MAGNET MARKET, BY END USER, 2018-2033 (TONS)
TABLE 66 AUTOMOTIVE MANUFACTURERS IN MAGNET MARKET, BY REGION, 2018-2033 (USD THOUSAND)
TABLE 67 AUTOMOTIVE MANUFACTURERS IN MAGNET MARKET, BY REGION, 2018-2033 (TONS)
TABLE 68 ELECTRONICS & SEMICONDUCTOR COMPANIES IN MAGNET MARKET, BY REGION, 2018-2033 (USD THOUSAND)
TABLE 69 ELECTRONICS & SEMICONDUCTOR COMPANIES IN MAGNET MARKET, BY REGION, 2018-2033 (TONS)
TABLE 70 INDUSTRIAL EQUIPMENT MANUFACTURERS IN MAGNET MARKET, BY REGION, 2018-2033 (USD THOUSAND)
TABLE 71 INDUSTRIAL EQUIPMENT MANUFACTURERS IN MAGNET MARKET, BY REGION, 2018-2033 (TONS)
TABLE 72 ENERGY COMPANIES IN MAGNET MARKET, BY REGION, 2018-2033 (USD THOUSAND)
TABLE 73 ENERGY COMPANIES IN MAGNET MARKET, BY REGION, 2018-2033 (TONS)
TABLE 74 HEALTHCARE AND MEDICAL DEVICE MANUFACTURERS IN MAGNET MARKET, BY REGION, 2018-2033 (USD THOUSAND)
TABLE 75 HEALTHCARE AND MEDICAL DEVICE MANUFACTURERS IN MAGNET MARKET, BY REGION, 2018-2033 (TONS)
TABLE 76 OTHERS IN MAGNET MARKET, BY REGION, 2018-2033 (USD THOUSAND)
TABLE 77 OTHERS IN MAGNET MARKET, BY REGION, 2018-2033 (TONS)
TABLE 78 NORTH AMERICA MAGNET MARKET, BY DISTRIBUTION CHANNEL, 2018-2033 (USD THOUSAND)
TABLE 79 NORTH AMERICA MAGNET MARKET, BY DISTRIBUTION CHANNEL, 2018-2033 (TONS)
TABLE 80 DIRECT IN MAGNET MARKET, BY REGION, 2018-2033 (USD THOUSAND)
TABLE 81 DIRECT IN MAGNET MARKET, BY REGION, 2018-2033 (TONS)
TABLE 82 INDIRECT IN MAGNET MARKET, BY REGION, 2018-2033 (USD THOUSAND)
TABLE 83 INDIRECT IN MAGNET MARKET, BY REGION, 2018-2033 (TONS)
TABLE 84 NORTH AMERICA MAGNET MARKET, BY COUNTRY, 2018-2033 (USD THOUSAND)
TABLE 85 NORTH AMERICA MAGNET MARKET, BY COUNTRY, 2018-2033 (TONS)
TABLE 86 USD MILLION
TABLE 87 NORTH AMERICA MAGNET MARKET, BY PRODUCT TYPE, 2018-2033 (USD THOUSAND)
TABLE 88 NORTH AMERICA MAGNET MARKET, BY PRODUCT TYPE, 2018-2033 (TONS)
TABLE 89 NORTH AMERICA NEODYMIUM MAGNETS (NDFEB) IN MAGNET MARKET, BY TYPE, 2018-2033 (USD THOUSAND)
TABLE 90 NORTH AMERICA NEODYMIUM MAGNETS (NDFEB) IN MAGNET MARKET, BY COATING TYPE, 2018-2033 (USD THOUSAND)
TABLE 91 NORTH AMERICA FERRITE MAGNETS IN MAGNET MARKET, BY TYPE, 2018-2033 (USD THOUSAND)
TABLE 92 NORTH AMERICA FERRITE MAGNETS IN MAGNET MARKET, BY MANUFACTURING PROCESS, 2018-2033 (USD THOUSAND)
TABLE 93 NORTH AMERICA SAMARIUM COBALT MAGNETS (SMCO) IN MAGNET MARKET, BY GRADE TYPE, 2018-2033 (USD THOUSAND)
TABLE 94 NORTH AMERICA MAGNET MARKET, BY RAW MATERIAL, 2018-2033 (USD THOUSAND)
TABLE 95 NORTH AMERICA MAGNET MARKET, BY RAW MATERIAL, 2018-2033 (TONS)
TABLE 96 NORTH AMERICA RARE EARTH ELEMENTS IN MAGNET MARKET, BY TYPE, 2018-2033 (USD THOUSAND)
TABLE 97 NORTH AMERICA FERRITE MATERIALS IN MAGNET MARKET, BY TYPE, 2018-2033 (USD THOUSAND)
TABLE 98 NORTH AMERICA MAGNET MARKET, BY FUNCTION, 2018-2033 (USD THOUSAND)
TABLE 99 NORTH AMERICA MAGNET MARKET, BY FUNCTION, 2018-2033 (TONS)
TABLE 100 NORTH AMERICA MAGNET MARKET, BY APPLICATION, 2018-2033 (USD THOUSAND)
TABLE 101 NORTH AMERICA MAGNET MARKET, BY APPLICATION, 2018-2033 (TONS)
TABLE 102 NORTH AMERICA MAGNET MARKET, BY END USER, 2018-2033 (USD THOUSAND)
TABLE 103 NORTH AMERICA MAGNET MARKET, BY END USER, 2018-2033 (TONS)
TABLE 104 NORTH AMERICA MAGNET MARKET, BY DISTRIBUTION CHANNEL, 2018-2033 (USD THOUSAND)
TABLE 105 NORTH AMERICA MAGNET MARKET, BY DISTRIBUTION CHANNEL, 2018-2033 (TONS)
TABLE 106 U.S. MAGNET MARKET, BY PRODUCT TYPE, 2018-2033 (USD THOUSAND)
TABLE 107 U.S. MAGNET MARKET, BY PRODUCT TYPE, 2018-2033 (TONS)
TABLE 108 U.S. NEODYMIUM MAGNETS (NDFEB) IN MAGNET MARKET, BY TYPE, 2018-2033 (USD THOUSAND)
TABLE 109 U.S. NEODYMIUM MAGNETS (NDFEB) IN MAGNET MARKET, BY COATING TYPE, 2018-2033 (USD THOUSAND)
TABLE 110 U.S. FERRITE MAGNETS IN MAGNET MARKET, BY TYPE, 2018-2033 (USD THOUSAND)
TABLE 111 U.S. FERRITE MAGNETS IN MAGNET MARKET, BY MANUFACTURING PROCESS, 2018-2033 (USD THOUSAND)
TABLE 112 U.S. SAMARIUM COBALT MAGNETS (SMCO) IN MAGNET MARKET, BY GRADE TYPE, 2018-2033 (USD THOUSAND)
TABLE 113 U.S. MAGNET MARKET, BY RAW MATERIAL, 2018-2033 (USD THOUSAND)
TABLE 114 U.S. MAGNET MARKET, BY RAW MATERIAL, 2018-2033 (TONS)
TABLE 115 U.S. RARE EARTH ELEMENTS IN MAGNET MARKET, BY TYPE, 2018-2033 (USD THOUSAND)
TABLE 116 U.S. FERRITE MATERIALS IN MAGNET MARKET, BY TYPE, 2018-2033 (USD THOUSAND)
TABLE 117 U.S. MAGNET MARKET, BY FUNCTION, 2018-2033 (USD THOUSAND)
TABLE 118 U.S. MAGNET MARKET, BY FUNCTION, 2018-2033 (TONS)
TABLE 119 U.S. MAGNET MARKET, BY APPLICATION, 2018-2033 (USD THOUSAND)
TABLE 120 U.S. MAGNET MARKET, BY APPLICATION, 2018-2033 (TONS)
TABLE 121 U.S. MAGNET MARKET, BY END USER, 2018-2033 (USD THOUSAND)
TABLE 122 U.S. MAGNET MARKET, BY END USER, 2018-2033 (TONS)
TABLE 123 U.S. MAGNET MARKET, BY DISTRIBUTION CHANNEL, 2018-2033 (USD THOUSAND)
TABLE 124 U.S. MAGNET MARKET, BY DISTRIBUTION CHANNEL, 2018-2033 (TONS)
TABLE 125 CANADA MAGNET MARKET, BY PRODUCT TYPE, 2018-2033 (USD THOUSAND)
TABLE 126 CANADA MAGNET MARKET, BY PRODUCT TYPE, 2018-2033 (TONS)
TABLE 127 CANADA NEODYMIUM MAGNETS (NDFEB) IN MAGNET MARKET, BY TYPE, 2018-2033 (USD THOUSAND)
TABLE 128 CANADA NEODYMIUM MAGNETS (NDFEB) IN MAGNET MARKET, BY COATING TYPE, 2018-2033 (USD THOUSAND)
TABLE 129 CANADA FERRITE MAGNETS IN MAGNET MARKET, BY TYPE, 2018-2033 (USD THOUSAND)
TABLE 130 CANADA FERRITE MAGNETS IN MAGNET MARKET, BY MANUFACTURING PROCESS, 2018-2033 (USD THOUSAND)
TABLE 131 CANADA SAMARIUM COBALT MAGNETS (SMCO) IN MAGNET MARKET, BY GRADE TYPE, 2018-2033 (USD THOUSAND)
TABLE 132 CANADA MAGNET MARKET, BY RAW MATERIAL, 2018-2033 (USD THOUSAND)
TABLE 133 CANADA MAGNET MARKET, BY RAW MATERIAL, 2018-2033 (TONS)
TABLE 134 CANADA RARE EARTH ELEMENTS IN MAGNET MARKET, BY TYPE, 2018-2033 (USD THOUSAND)
TABLE 135 CANADA FERRITE MATERIALS IN MAGNET MARKET, BY TYPE, 2018-2033 (USD THOUSAND)
TABLE 136 CANADA MAGNET MARKET, BY FUNCTION, 2018-2033 (USD THOUSAND)
TABLE 137 CANADA MAGNET MARKET, BY FUNCTION, 2018-2033 (TONS)
TABLE 138 CANADA MAGNET MARKET, BY APPLICATION, 2018-2033 (USD THOUSAND)
TABLE 139 CANADA MAGNET MARKET, BY APPLICATION, 2018-2033 (TONS)
TABLE 140 CANADA MAGNET MARKET, BY END USER, 2018-2033 (USD THOUSAND)
TABLE 141 CANADA MAGNET MARKET, BY END USER, 2018-2033 (TONS)
TABLE 142 CANADA MAGNET MARKET, BY DISTRIBUTION CHANNEL, 2018-2033 (USD THOUSAND)
TABLE 143 CANADA MAGNET MARKET, BY DISTRIBUTION CHANNEL, 2018-2033 (TONS)
TABLE 144 MEXICO MAGNET MARKET, BY PRODUCT TYPE, 2018-2033 (USD THOUSAND)
TABLE 145 MEXICO MAGNET MARKET, BY PRODUCT TYPE, 2018-2033 (TONS)
TABLE 146 MEXICO NEODYMIUM MAGNETS (NDFEB) IN MAGNET MARKET, BY TYPE, 2018-2033 (USD THOUSAND)
TABLE 147 MEXICO NEODYMIUM MAGNETS (NDFEB) IN MAGNET MARKET, BY COATING TYPE, 2018-2033 (USD THOUSAND)
TABLE 148 MEXICO FERRITE MAGNETS IN MAGNET MARKET, BY TYPE, 2018-2033 (USD THOUSAND)
TABLE 149 MEXICO FERRITE MAGNETS IN MAGNET MARKET, BY MANUFACTURING PROCESS, 2018-2033 (USD THOUSAND)
TABLE 150 MEXICO SAMARIUM COBALT MAGNETS (SMCO) IN MAGNET MARKET, BY GRADE TYPE, 2018-2033 (USD THOUSAND)
TABLE 151 MEXICO MAGNET MARKET, BY RAW MATERIAL, 2018-2033 (USD THOUSAND)
TABLE 152 MEXICO MAGNET MARKET, BY RAW MATERIAL, 2018-2033 (TONS)
TABLE 153 MEXICO RARE EARTH ELEMENTS IN MAGNET MARKET, BY TYPE, 2018-2033 (USD THOUSAND)
TABLE 154 MEXICO FERRITE MATERIALS IN MAGNET MARKET, BY TYPE, 2018-2033 (USD THOUSAND)
TABLE 155 MEXICO MAGNET MARKET, BY FUNCTION, 2018-2033 (USD THOUSAND)
TABLE 156 MEXICO MAGNET MARKET, BY FUNCTION, 2018-2033 (TONS)
TABLE 157 MEXICO MAGNET MARKET, BY APPLICATION, 2018-2033 (USD THOUSAND)
TABLE 158 MEXICO MAGNET MARKET, BY APPLICATION, 2018-2033 (TONS)
TABLE 159 MEXICO MAGNET MARKET, BY END USER, 2018-2033 (USD THOUSAND)
TABLE 160 MEXICO MAGNET MARKET, BY END USER, 2018-2033 (TONS)
TABLE 161 MEXICO MAGNET MARKET, BY DISTRIBUTION CHANNEL, 2018-2033 (USD THOUSAND)
TABLE 162 MEXICO MAGNET MARKET, BY DISTRIBUTION CHANNEL, 2018-2033 (TONS)
List of Figure
FIGURE 1 NORTH AMERICA MAGNET MARKET: SEGMENTATION
FIGURE 2 NORTH AMERICA MAGNET MARKET: DATA TRIANGULATION
FIGURE 3 NORTH AMERICA MAGNET MARKET: DROC ANALYSIS
FIGURE 4 NORTH AMERICA MAGNET MARKET: NORTH AMERICA VS REGIONAL MARKET ANALYSIS
FIGURE 5 NORTH AMERICA MAGNET MARKET: COMPANY RESEARCH ANALYSIS
FIGURE 6 NORTH AMERICA MAGNET MARKET: MULTIVARIATE MODELLING
FIGURE 7 NORTH AMERICA MAGNET MARKET: INTERVIEW DEMOGRAPHICS
FIGURE 8 NORTH AMERICA MAGNET MARKET: DBMR MARKET POSITION GRID
FIGURE 9 NORTH AMERICA MAGNET MARKET: MARKET APPLICATION COVERAGE GRID
FIGURE 10 NORTH AMERICA MAGNET MARKET: VENDOR SHARE ANALYSIS
FIGURE 11 NORTH AMERICA MAGNET MARKET: SEGMENTATION
FIGURE 12 EXECUTIVE SUMMARY
FIGURE 13 FIVE SEGMENTS COMPRISE THE NORTH AMERICA MAGNET MARKET, BY PRODUCT TYPE (2025)
FIGURE 14 STRATEGIC DECISIONS
FIGURE 15 RISING EV AND HYBRID PRODUCTION DRIVING THE NORTH AMERICA MAGNET MARKET FROM 2026 TO 2033
FIGURE 16 NEODYMIUM MAGNETS SEGMENT IS EXPECTED TO ACCOUNT FOR THE LARGEST SHARE OF THE NORTH AMERICA MAGNET MARKET IN 2025& 2033
FIGURE 17 PORTER’S FIVE FORCES ANALYSIS
FIGURE 18 VENDOR SELECTION CRITERIA
FIGURE 19 DRIVERS, RESTRINTS, OPPORTUNITIES AND CHALLENGES OF ASIA-PACIFIC ERP MARKET
FIGURE 20 NORTH AMERICA MAGNET MARKET, BY PRODUCT TYPE,
FIGURE 21 NORTH AMERICA MAGNET MARKET, BY RAW MATERIAL
FIGURE 22 NORTH AMERICA MAGNET MARKET, BY FUNCTION
FIGURE 23 NORTH AMERICA MAGNET MARKET, BY APPLICATION
FIGURE 24 NORTH AMERICA MAGNET MARKET, BY END USER
FIGURE 25 NORTH AMERICA MAGNET MARKET, BY DISTRIBUTION CHANNEL
FIGURE 26 NORTH AMERICA MAGNET MARKET: SNAPSHOT (2026)
FIGURE 27 NORTH AMERICA MAGNET MARKET: COMPANY SHARE 2025 (%)
North America Magnet Market, Supply Chain Analysis and Ecosystem Framework
To support market growth and help clients navigate the impact of geopolitical shifts, DBMR has integrated in-depth supply chain analysis into its North America Magnet Market research reports. This addition empowers clients to respond effectively to global changes affecting their industries. The supply chain analysis section includes detailed insights such as North America Magnet Market consumption and production by country, price trend analysis, the impact of tariffs and geopolitical developments, and import and export trends by country and HSN code. It also highlights major suppliers with data on production capacity and company profiles, as well as key importers and exporters. In addition to research, DBMR offers specialized supply chain consulting services backed by over a decade of experience, providing solutions like supplier discovery, supplier risk assessment, price trend analysis, impact evaluation of inflation and trade route changes, and comprehensive market trend analysis.
Data collection and base year analysis are done using data collection modules with large sample sizes. The stage includes obtaining market information or related data through various sources and strategies. It includes examining and planning all the data acquired from the past in advance. It likewise envelops the examination of information inconsistencies seen across different information sources. The market data is analysed and estimated using market statistical and coherent models. Also, market share analysis and key trend analysis are the major success factors in the market report. To know more, please request an analyst call or drop down your inquiry.
The key research methodology used by DBMR research team is data triangulation which involves data mining, analysis of the impact of data variables on the market and primary (industry expert) validation. Data models include Vendor Positioning Grid, Market Time Line Analysis, Market Overview and Guide, Company Positioning Grid, Patent Analysis, Pricing Analysis, Company Market Share Analysis, Standards of Measurement, Global versus Regional and Vendor Share Analysis. To know more about the research methodology, drop in an inquiry to speak to our industry experts.
Data Bridge Market Research is a leader in advanced formative research. We take pride in servicing our existing and new customers with data and analysis that match and suits their goal. The report can be customized to include price trend analysis of target brands understanding the market for additional countries (ask for the list of countries), clinical trial results data, literature review, refurbished market and product base analysis. Market analysis of target competitors can be analyzed from technology-based analysis to market portfolio strategies. We can add as many competitors that you require data about in the format and data style you are looking for. Our team of analysts can also provide you data in crude raw excel files pivot tables (Fact book) or can assist you in creating presentations from the data sets available in the report.


