
North America Mass Spectrometry Market
Market Size in USD Billion
 USD
2.81 Billion
USD
5.32 Billion
2024
2032
USD
2.81 Billion
USD
5.32 Billion
2024
2032
| 2025 - 2032 | |
| USD 2.81 Billion | |
| USD 5.32 Billion | |
| % | |
|
North America Mass Spectrometry Market Size
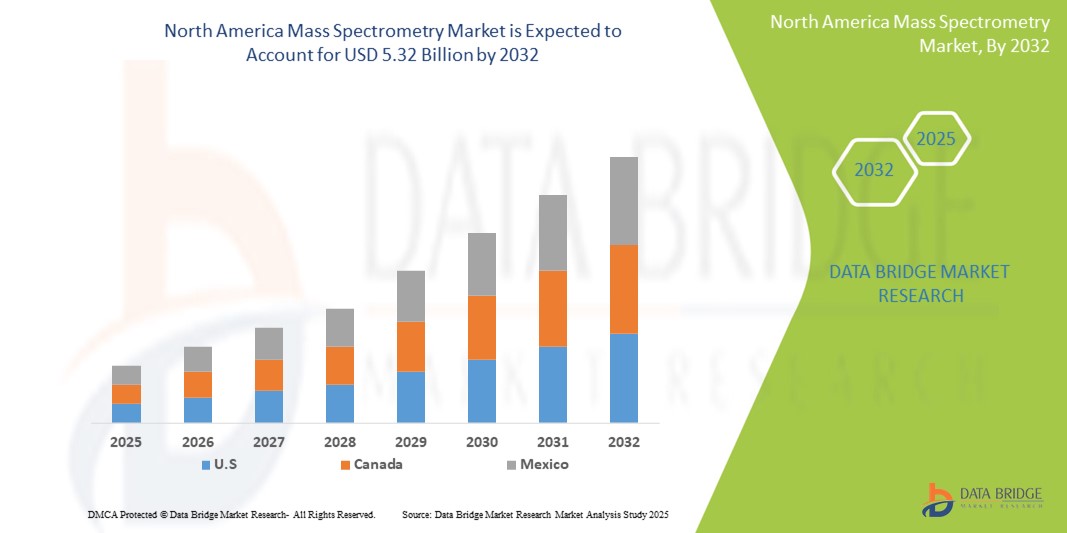
- The North America mass spectrometry market size was valued at USD 2.81 billion in 2024 and is expected to reach USD 5.32 billion by 2032, at a CAGR of 8.30% during the forecast period
- The market growth is primarily driven by advancements in analytical instrumentation and the increasing demand for high-throughput and accurate analytical techniques in pharmaceutical, biotechnology, and environmental testing sectors
- In addition, the rising focus on precision medicine, growing R&D investments by key industry players, and expanding applications in food safety and forensic science are propelling the adoption of mass spectrometry technologies. These converging dynamics are accelerating innovation and market penetration, thereby significantly boosting the region’s market growth
North America Mass Spectrometry Market Analysis
- Mass spectrometry, a powerful analytical technique for identifying and quantifying chemical compounds, is becoming increasingly essential in diverse sectors such as pharmaceuticals, biotechnology, environmental testing, and food safety due to its high sensitivity, precision, and ability to analyze complex mixtures
- The surging demand for mass spectrometry in North America is primarily driven by expanding pharmaceutical and biotech research, the growing emphasis on personalized medicine, and rising regulatory requirements for accurate and reliable analytical results
- U.S. dominated the North America mass spectrometry market with the largest revenue share of 78.9% in 2024, attributed to robust R&D spending, strong academic and industrial research infrastructure, and the presence of leading mass spectrometer manufacturers actively innovating to meet evolving scientific needs
- Canada is projected to witness the fastest growth in the region during the forecast period due to increasing investments in healthcare research, environmental monitoring initiatives, and growing collaborations between public institutions and private companies
- The hybrid mass spectrometry segment dominated the market with a share of 41.2% in 2024, driven by its superior analytical capabilities combining multiple detection techniques, which are widely adopted in proteomics, metabolomics, and complex sample analysis
Report Scope and North America Mass Spectrometry Market Segmentation
|
Attributes |
North America Mass Spectrometry Key Market Insights |
|
Segments Covered |
|
|
Countries Covered |
North America
|
|
Key Market Players |
|
|
Market Opportunities |
|
|
Value Added Data Infosets |
In addition to the insights on market scenarios such as market value, growth rate, segmentation, geographical coverage, and major players, the market reports curated by the Data Bridge Market Research also include in-depth expert analysis, pricing analysis, brand share analysis, consumer survey, demography analysis, supply chain analysis, value chain analysis, raw material/consumables overview, vendor selection criteria, PESTLE Analysis, Porter Analysis, and regulatory framework. |
North America Mass Spectrometry Market Trends
“Technological Advancements Driving Precision and Throughput”
- A prominent and accelerating trend in the North America mass spectrometry market is the rapid advancement in hybrid and high-resolution mass spectrometry technologies, which is significantly enhancing analytical precision, sensitivity, and throughput across various sectors
- For instance, Thermo Fisher Scientific’s Orbitrap Exploris 480 Mass Spectrometer provides unparalleled accuracy and scalability in proteomics and biopharmaceutical applications, showcasing the shift toward advanced systems for complex analyses. Similarly, SCIEX’s ZenoTOF 7600 System integrates electron-activated dissociation (EAD) with TOF-MS to enable deeper insights into molecular structures
- These advancements are supporting the increased demand for high-throughput screening in drug development and personalized medicine, enabling more detailed molecular profiling and biomarker discovery. In environmental sciences, cutting-edge mass spectrometry platforms are being utilized for trace-level detection of pollutants
- Automation and AI-powered software tools are further enhancing the capabilities of mass spectrometers by enabling real-time data processing, reducing analysis time, and improving data reproducibility. For instance, Agilent Technologies offers MassHunter software with integrated machine learning for intelligent peak identification
- The push for miniaturization and portable mass spectrometry units for field-based testing in forensics and environmental monitoring is also gaining momentum, reflecting a shift toward decentralized testing and faster response times
- This trend of integrating AI, cloud connectivity, and hybrid analytical methods is redefining the usability, scalability, and functionality of mass spectrometry systems, positioning them as critical tools in advancing modern scientific research and diagnostics across North America
North America Mass Spectrometry Market Dynamics
Driver
“Rising Demand Across Biopharma, Environmental, and Food Testing Applications”
- The growing need for accurate and rapid analytical tools across pharmaceutical R&D, environmental safety, and food quality testing is a significant driver of mass spectrometry market growth in North America
- For instance, in February 2024, Bruker Corporation introduced advanced mass spectrometry platforms for multi-omics applications, supporting innovations in clinical proteomics and cancer research. These developments are critical in accelerating drug discovery and biomarker validation
- Increasing regulatory scrutiny and the enforcement of strict safety and compliance guidelines by agencies such as the FDA and EPA are further driving the adoption of mass spectrometry for detailed chemical and biological analysis
- In addition, the expanding scope of metabolomics and proteomics research in North American academic and clinical settings is elevating the demand for high-performance mass spectrometry tools. The integration of mass spectrometry with separation techniques such as liquid chromatography is enhancing application versatility in drug purity analysis and contamination detection
- The increasing use of mass spectrometry in personalized medicine for detecting disease-specific biomarkers and monitoring therapeutic outcomes is also fueling market expansion. Government funding and public-private collaborations are further accelerating the deployment of these systems across healthcare, agriculture, and environmental labs
Restraint/Challenge
“High Cost and Technical Complexity of Advanced Systems”
- Despite the promising market outlook, the high acquisition and maintenance cost of advanced mass spectrometry systems remains a significant barrier, particularly for small- to mid-sized laboratories and academic institutions
- Instruments such as high-resolution hybrid systems can cost upwards of several hundred thousand dollars, posing financial constraints for widespread adoption. Furthermore, mass spectrometry demands specialized expertise for operation, data interpretation, and maintenance, which can limit its accessibility in non-specialist environments
- Technical complexities related to calibration, sample preparation, and the need for skilled personnel often deter smaller facilities or delay implementation timelines
- To address these challenges, manufacturers are focusing on developing user-friendly interfaces, training modules, and cloud-enabled data processing to streamline workflows. In addition, initiatives aimed at offering rental or leasing options, and government grants for research infrastructure upgrades, are helping mitigate cost-related barriers
- Overcoming these obstacles through cost-effective innovation, technician training, and greater automation will be crucial for the continued expansion and democratization of mass spectrometry technologies in North America
North America Mass Spectrometry Market Scope
The market is segmented on the basis of technology, modality, application, end user, and distribution channel.
- By Technology
On the basis of technology, the North America mass spectrometry market is segmented into hybrid mass spectrometry, single mass spectrometry, and others. The hybrid mass spectrometry segment held the largest market revenue share of 41.2% in 2024, driven by its superior analytical performance, high-resolution output, and ability to combine multiple mass analyzers for advanced applications such as proteomics, metabolomics, and complex compound identification. Instruments such as Orbitrap and Q-TOF are widely adopted in drug discovery and biological research due to their speed and accuracy.
The single mass spectrometry segment is projected to witness the fastest growth rate from 2025 to 2032, owing to its cost-effectiveness and suitability for routine analyses such as food quality testing, forensic toxicology, and environmental monitoring. Compact single quadrupole instruments are particularly favored by laboratories with limited budgets or basic testing requirements
- By Modality
On the basis of modality, the North America mass spectrometry market is segmented into benchtop and standalone. The benchtop segment held the largest market revenue share in 2024, driven by its widespread use in academic research, pharmaceutical labs, and clinical diagnostic centers. Benchtop mass spectrometers provide robust performance and high throughput, making them ideal for large-scale and detailed analytical workflows.
The standalone segment is expected to witness the fastest CAGR from 2025 to 2032, driven by rising demand for portable, field-deployable systems used in on-site environmental testing, homeland security, and food inspection. Standalone devices offer ease of use, mobility, and the ability to perform rapid diagnostics outside traditional lab settings
- By Application
On the basis of application, the North America mass spectrometry market is segmented into life science research, drug discovery, environmental testing, food testing, applied industries, clinical diagnostics, and others. The life science research segment dominated the market with the largest market revenue share in 2024, supported by strong funding in proteomics, genomics, and metabolomics research. Mass spectrometry is widely used in biomolecular characterization, cellular pathway analysis, and disease mechanism studies in leading research institutions.
The clinical diagnostics segment is anticipated to witness the fastest growth rate from 2025 to 2032, driven by the rising adoption of LC-MS/MS systems in clinical labs for biomarker identification, therapeutic drug monitoring, and disease screening. The increasing focus on precision medicine and regulatory acceptance of MS-based diagnostic tools are further accelerating the segment’s growth.
- By End User
On the basis of end user, the North America mass spectrometry market is segmented into pharmaceutical industry, research and academic institutes, food & beverage industry, petrochemical industry, and others. The pharmaceutical industry segment dominated the market with the largest market revenue share in 2024, driven by widespread use of mass spectrometry for drug development, quality control, and regulatory compliance in GMP-certified labs.
The research and academic institutes segment is expected to witness the fastest growth rate from 2025 to 2032, fueled by increased research funding, collaborative studies in life sciences, and the need for advanced analytical tools in university laboratories and public research centers.
- By Distribution Channel
On the basis of distribution channel, the North America mass spectrometry market is segmented into direct tenders, retail sales, and others. The direct tenders segment dominated the market with the largest market revenue share in 2024, attributed to high-value procurement by government laboratories, universities, and large hospitals through formal bidding and vendor agreements.
The retail sales segment is anticipated to witness the fastest growth rate from 2025 to 2032, supported by the rise of e-commerce platforms and specialized distributors offering compact, benchtop instruments and consumables to smaller laboratories and clinics with limited procurement capacity.
North America Mass Spectrometry Market Regional Analysis
- U.S. dominated the North America mass spectrometry market with the largest revenue share of 78.9% in 2024, attributed to robust R&D spending, strong academic and industrial research infrastructure, and the presence of leading mass spectrometer manufacturers actively innovating to meet evolving scientific needs
- The country benefits from substantial investments in R&D, widespread implementation of precision medicine initiatives, and strict regulatory standards that require robust analytical validation, all of which support strong demand for mass spectrometry technologies
- This leadership position is further supported by the presence of major market players, government-funded research programs, and a skilled scientific workforce, establishing the U.S. as the central driver of growth and innovation in the North American mass spectrometry market
U.S. North America Mass Spectrometry Market Insight
The U.S. mass spectrometry market captured the largest revenue share of 78.4% in 2024 within North America, driven by advanced pharmaceutical and biotechnology industries, high R&D investments, and a strong academic research ecosystem. The widespread adoption of mass spectrometry in applications such as clinical diagnostics, drug development, environmental analysis, and food safety testing is propelling market growth. In addition, regulatory bodies such as the FDA and EPA mandate stringent testing standards, further encouraging the use of advanced analytical instruments. The presence of leading global manufacturers and growing demand for precision medicine continue to position the U.S. as the dominant force in the regional market.
Canada Mass Spectrometry Market Insight
The Canada mass spectrometry market is projected to grow at a notable CAGR throughout the forecast period, supported by increasing governmental and institutional investments in healthcare research, environmental monitoring, and academic science. Canada's strong public healthcare system and focus on sustainable practices are fostering demand for accurate, high-throughput analytical techniques. Growth in life sciences research, expanding biotech hubs, and collaborative efforts between academic institutions and the private sector are also contributing to the market’s expansion.
Mexico Mass Spectrometry Market Insight
The Mexico mass spectrometry market is expected to expand steadily during the forecast period, driven by rising industrialization, greater focus on food safety regulations, and increasing awareness of environmental and public health monitoring. Investments in pharmaceutical manufacturing and forensic science infrastructure are boosting adoption of mass spectrometry systems. In addition, growing collaboration with U.S.-based research institutions and improved access to advanced analytical technologies are supporting market growth in the country.
North America Mass Spectrometry Market Share
The North America mass spectrometry industry is primarily led by well-established companies, including:
- Thermo Fisher Scientific Inc. (U.S.)
- Agilent Technologies, Inc. (U.S.)
- Waters Corporation (U.S.)
- Bruker Corporation (U.S.)
- Shimadzu Corporation (Japan)
- PerkinElmer (U.S.)
- JEOL Ltd. (Japan)
- LECO Corporation (U.S.)
- Analytik Jena GmbH (Germany)
- Hitachi High-Tech Corporation (Japan)
- Danaher Corporation (U.S.)
- MKS Instruments, Inc. (U.S.)
- Biotage AB (Sweden)
- Advion, Inc. (U.S.)
- KNAUER Wissenschaftliche Geräte GmbH (Germany)
- Hiden Analytical Ltd. (U.K.)
- MassTech, Inc. (U.S.)
- Isotopx Ltd. (U.K.)
- Markes International Ltd. (U.K.)
What are the Recent Developments in North America Mass Spectrometry Market?
- In April 2023, Thermo Fisher Scientific Inc. (U.S.) launched the Orbitrap Astral mass spectrometer, a high-resolution system designed to advance proteomics and translational research. The new instrument enhances sensitivity and scan speed, enabling deeper insights into complex biological samples. This development reinforces Thermo Fisher’s leadership in supporting pharmaceutical and clinical researchers with next-generation analytical tools
- In March 2023, SCIEX (Canada), a global leader in mass spectrometry, introduced the Zeno SWATH DIA method for their ZenoTOF 7600 system, enhancing sensitivity and data quality in proteomics workflows. This advancement demonstrates SCIEX’s commitment to advancing data-independent acquisition (DIA) technologies and expanding capabilities for academic and clinical research users across North America
- In February 2023, Agilent Technologies Inc. (U.S.) announced the expansion of its MassHunter software suite with enhanced machine learning algorithms, enabling improved compound identification and faster data processing. The upgraded platform supports laboratories engaged in environmental testing, pharmaceutical quality control, and toxicology, reinforcing Agilent’s focus on user-friendly, AI-driven solutions in mass spectrometry
- In January 2023, Bruker Corporation (U.S.) unveiled enhancements to its timsTOF HT mass spectrometry platform, aimed at accelerating spatial proteomics and single-cell analysis. These innovations were presented at the US HUPO Conference and reflect Bruker’s commitment to high-throughput, high-resolution systems for cutting-edge life science applications
- In January 2023, PerkinElmer Inc. (U.S.) introduced new mass spectrometry-based screening solutions for food safety and environmental contamination detection. Targeting emerging regulatory needs across North America, these advancements highlight PerkinElmer’s role in supporting public health and compliance through innovative analytical instruments
SKU-

- Interactive Data Analysis Dashboard
- Company Analysis Dashboard for high growth potential opportunities
- Research Analyst Access for customization & queries
- Competitor Analysis with Interactive dashboard
- Latest News, Updates & Trend analysis
- Harness the Power of Benchmark Analysis for Comprehensive Competitor Tracking
Table of Content
1 INTRODUCTION
1.1 OBJECTIVES OF THE STUDY
1.2 MARKET DEFINITION
1.3 OVERVIEW OF NORTH AMERICA MASS SPECTROMETRY MARKET
1.4 MARKETS COVERED
2 MARKET SEGMENTATION
2.1 MARKETS COVERED
2.2 GEOGRAPHICAL SCOPE
2.3 YEARS CONSIDERED FOR THE STUDY
2.4 CURRENCY AND PRICING
2.5 DBMR TRIPOD DATA VALIDATION MODEL
2.6 MULTIVARIATE MODELLING
2.7 PRIMARY INTERVIEWS WITH KEY OPINION LEADERS
2.8 DBMR MARKET POSITION GRID
2.9 VENDOR SHARE ANALYSIS
2.1 MARKET END USER COVERAGE GRID
2.11 SECONDARY SOURCES
2.12 ASSUMPTIONS
3 EXECUTIVE SUMMARY
4 PREMIUM INSIGHTS
4.1 PESTEL ANALYSIS
4.2 PORTERS FIVE FORCES ANALYSIS
5 NORTH AMERICA MASS SPECTROMETRY MARKET: REGULATIONS
5.1 REGULATORY AUTHORITIES IN NORTH AMERICA
5.2 REGULATORY AUTHORITIES IN SOUTH AMERICA
5.3 REGULATORY AUTHORITIES IN EUROPE
5.4 REGULATORY AUTHORITIES IN MIDDLE EAST AND AFRICA.
5.5 REGULATORY AUTHORITIES IN ASIA PACIFIC.
6 MARKET OVERVIEW
6.1 DRIVERS
6.1.1 TECHNOLOGICAL ADVANCEMENTS IN MASS SPECTROMETRY
6.1.2 GROWING APPLICATIONS OF MASS SPECTROMETRY (MS) IN PHARMACEUTICALS AND BIOTECHNOLOGY
6.1.3 DEMAND OF MASS SPECTROMETRY IN ENVIRONMENTAL TESTING AND FOOD SAFETY
6.1.4 ADVANCEMENTS IN PROTEOMICS AND GENOMICS RESEARCH
6.2 RESTRAINTS
6.2.1 HIGH COST OF MASS SPECTROMETRY
6.2.2 COMPETITION FROM ALTERNATIVE TECHNOLOGIES
6.3 OPPORTUNITIES
6.3.1 ADVANCEMENTS IN AUTOMATION AND ARTIFICIAL INTELLIGENCE (AI) IN MASS SPECTROMETRY
6.3.2 GROWING ADOPTION IN CLINICAL LABS
6.3.3 RISING ADOPTION OF COMPACT AND PORTABLE MASS SPECTROMETERS
6.4 CHALLENGES
6.4.1 SKILLED WORKFORCE SHORTAGE
6.4.2 EFFECTIVELY MANAGING AND STORING LARGE VOLUMES OF DATA
7 NORTH AMERICA MASS SPECTROMETRY MARKET, BY TECHNOLOGY
7.1 OVERVIEW
7.2 HYBRID MASS SPECTROMETRY
7.2.1 ORBITRAP-MS
7.2.2 FT-MS
7.2.3 OTHERS
7.3 SINGLE MASS SPECTROMETRY
7.3.1 TIME OF FLIGHT
7.3.2 QUADRUPOLE
7.3.3 OTHERS
7.4 OTHERS
8 NORTH AMERICA MASS SPECTROMETRY MARKET, BY MODALITY
8.1 OVERVIEW
8.2 BENCHTOP
8.3 STANDALONE
9 NORTH AMERICA MASS SPECTROMETRY MARKET, BY APPLICATION
9.1 OVERVIEW
9.2 LIFE SCIENCE RESEARCH
9.3 DRUG DISCOVERY
9.4 ENVIRONMENTAL TESTING
9.5 FOOD TESTING
9.6 APPLIED INDUSTRIES
9.7 CLINICAL DIAGNOSTICS
9.8 OTHERS
10 NORTH AMERICA MASS SPECTROMETRY MARKET, BY DISTRIBUTION CHANNEL
10.1 OVERVIEW
10.2 DIRECT TENDERS
10.3 RETAIL SALES
10.4 OTHERS
11 NORTH AMERICA MASS SPECTROMETRY MARKET, BY END USER
11.1 OVERVIEW
11.2 PHARMACEUTICAL INDUSTRY
11.3 RESEARCH AND ACADEMIC INSTITUTES
11.4 FOOD & BEVERAGE INDUSTRY
11.5 PETROCHEMICAL INDUSTRY
11.6 OTHERS
12 NORTH AMERICA MASS SPECTROMETRY MARKET, BY REGION
12.1 NORTH AMERICA
12.1.1 U.S
12.1.2 CANADA
12.1.3 MEXICO
13 NORTH AMERICA MASS SPECTROMETRY MARKET, COMPANY LANDSCAPE
13.1 COMPANY SHARE ANALYSIS: NORTH AMERICA
14 SWOT ANALYSIS
15 COMPANY PROFILES
15.1 THERMO FISHER SCIENTIFIC INC.
15.1.1 COMPANY SNAPSHOT
15.1.2 REVENUE ANALYSIS
15.1.3 COMPANY SHARE ANALYSIS
15.1.4 PRODUCT PORTFOLIO
15.1.5 RECENT DEVELOPMENT
15.2 SHIMADZU CORPORATION
15.2.1 COMPANY SNAPSHOT
15.2.2 REVENUE ANALYSIS
15.2.3 COMPANY SHARE ANALYSIS
15.2.4 PRODUCT PORTFOLIO
15.2.5 RECENT DEVELOPMENTS
15.3 AGILENT TECHNOLOGIES, INC.
15.3.1 COMPANY SNAPSHOT
15.3.2 REVENUE ANALYSIS
15.3.3 COMPANY SHARE ANALYSIS
15.3.4 PRODUCT PORTFOLIO
15.3.5 RECENT UPDATES
15.4 BRUKER
15.4.1 COMPANY SNAPSHOT
15.4.2 REVENUE ANALYSIS
15.4.3 COMPANY SHARE ANALYSIS
15.4.4 PRODUCT PORTFOLIO
15.4.5 RECENT DEVELOPMENT
15.5 WATERS CORPORATION
15.5.1 COMPANY SNAPSHOT
15.5.2 REVENUE ANALYSIS
15.5.3 COMPANY SHARE ANALYSIS
15.5.4 PRODUCT PORTFOLIO
15.5.5 RECENT DEVELOPMENTS
15.6 AMETEK.INC.
15.6.1 COMPANY SNAPSHOT
15.6.2 REVENUE ANALYSIS
15.6.3 PRODUCT PORTFOLIO
15.6.4 RECENT DEVELOPMENT
15.7 DANAHER CORPORATION
15.7.1 COMPANY SNAPSHOT
15.7.2 REVENUE ANALYSIS
15.7.3 PRODUCT PORTFOLIO
15.7.4 RECENT DEVELOPMENTS
15.8 HIDEN ANALYTICAL
15.8.1 COMPANY SNAPSHOT
15.8.2 PRODUCT PORTFOLIO
15.8.3 RECENT DEVELOPMENTS
15.9 HITACHI, LTD.B(SUBSIDIARIE COMPANY HITACHI HIGH-TECH INDIA PRIVATE LIMITED)
15.9.1 COMPANY SNAPSHOT
15.9.2 REVENUE ANALYSIS
15.9.3 PRODUCT PORTFOLIO
15.9.4 RECENT DEVELOPMENT
15.1 JEOL LTD.
15.10.1 COMPANY SNAPSHOT
15.10.2 REVENUE ANALYSIS
15.10.3 PRODUCT PORTFOLIO
15.10.4 RECENT DEVELOPMENT
15.11 KORE TECHNOLOGY
15.11.1 COMPANY SNAPSHOT
15.11.2 PRODUCT PORTFOLIO
15.11.3 RECENT DEVELOPMENT
15.12 LECO CORPORATION
15.12.1 COMPANY SNAPSHOT
15.12.2 PRODUCT PORTFOLIO
15.12.3 RECENT UPDATES
15.13 PERKINELMER INC
15.13.1 COMPANY SNAPSHOT
15.13.2 REVENUE ANALYSIS
15.13.3 PRODUCT PORTFOLIO
15.13.4 RECENT DEVELOPMENT
15.14 RIGAKU HOLDINGS CORPORATION
15.14.1 COMPANY SNAPSHOT
15.14.2 PRODUCT PORTFOLIO
15.14.3 RECENT DEVELOPMENT
16 QUESTIONNAIRE
17 RELATED REPORTS
List of Table
TABLE 1 NORTH AMERICA MASS SPECTROMETRY MARKET, BY TECHNOLOGY, 2022-2031 (USD THOUSAND)
TABLE 2 NORTH AMERICA HYBRID MASS SPECTROMETRY IN MASS SPECTROMETRY MARKET, BY REGION, 2022-2031 (USD THOUSAND)
TABLE 3 NORTH AMERICA HYBRID MASS SPECTROMETRY IN MASS SPECTROMETRY MARKET, BY TYPE, 2022-2031 (USD THOUSAND)
TABLE 4 NORTH AMERICA SINGLE MASS SPECTROMETRY IN MASS SPECTROMETRY MARKET, BY REGION, 2022-2031 (USD THOUSAND)
TABLE 5 NORTH AMERICA SINGLE MASS SPECTROMETRY IN MASS SPECTROMETRY MARKET, BY TYPE, 2022-2031 (USD THOUSAND)
TABLE 6 NORTH AMERICA OTHERS IN MASS SPECTROMETRY MARKET, BY REGION, 2022-2031 (USD THOUSAND)
TABLE 7 NORTH AMERICA MASS SPECTROMETRY MARKET, BY MODALITY, 2022-2031 (USD THOUSAND)
TABLE 8 NORTH AMERICA BENCHTOP IN MASS SPECTROMETRY MARKET, BY REGION, 2022-2031 (USD THOUSAND)
TABLE 9 NORTH AMERICA STANDALONE IN MASS SPECTROMETRY MARKET, BY REGION, 2022-2031 (USD THOUSAND)
TABLE 10 NORTH AMERICA MASS SPECTROMETRY MARKET, BY APPLICATION, 2022-2031 (USD THOUSAND)
TABLE 11 NORTH AMERICA LIFE SCIENCE RESEARCH IN MASS SPECTROMETRY MARKET, BY REGION, 2022-2031 (USD THOUSAND)
TABLE 12 NORTH AMERICA DRUG DISCOVERY IN MASS SPECTROMETRY MARKET, BY REGION, 2022-2031 (USD THOUSAND)
TABLE 13 NORTH AMERICA ENVIRONMENTAL TESTING IN MASS SPECTROMETRY MARKET, BY REGION, 2022-2031 (USD THOUSAND)
TABLE 14 NORTH AMERICA FOOD TESTING IN MASS SPECTROMETRY MARKET, BY REGION, 2022-2031 (USD THOUSAND)
TABLE 15 NORTH AMERICA APPLIED INDUSTRIES IN MASS SPECTROMETRY MARKET, BY REGION, 2022-2031 (USD THOUSAND)
TABLE 16 NORTH AMERICA CLINICAL DIAGNOSTICS IN MASS SPECTROMETRY MARKET, BY REGION, 2022-2031 (USD THOUSAND)
TABLE 17 NORTH AMERICA OTHERS IN MASS SPECTROMETRY MARKET, BY REGION, 2022-2031 (USD THOUSAND)
TABLE 18 NORTH AMERICA MASS SPECTROMETRY MARKET, BY DISTRIBUTION CHANNEL, 2022-2031 (USD THOUSAND)
TABLE 19 NORTH AMERICA DIRECT TENDERS IN MASS SPECTROMETRY MARKET, BY REGION, 2022-2031 (USD THOUSAND)
TABLE 20 NORTH AMERICA RETAIL SALES IN MASS SPECTROMETRY MARKET, BY REGION, 2022-2031 (USD THOUSAND)
TABLE 21 NORTH AMERICA OTHERS IN MASS SPECTROMETRY MARKET, BY REGION, 2022-2031 (USD THOUSAND)
TABLE 22 NORTH AMERICA MASS SPECTROMETRY MARKET, BY END USER, 2022-2031 (USD THOUSAND)
TABLE 23 NORTH AMERICA PHARMACEUTICAL INDUSTRY IN MASS SPECTROMETRY MARKET, BY REGION, 2022-2031 (USD THOUSAND)
TABLE 24 NORTH AMERICA RESEARCH AND ACADEMIC INSTITUTES IN MASS SPECTROMETRY MARKET, BY REGION, 2022-2031 (USD THOUSAND)
TABLE 25 NORTH AMERICA FOOD & BEVERAGE INDUSTRY IN MASS SPECTROMETRY MARKET, BY REGION, 2022-2031 (USD THOUSAND)
TABLE 26 NORTH AMERICA PETROCHEMICAL INDUSTRY IN MASS SPECTROMETRY MARKET, BY REGION, 2022-2031 (USD THOUSAND)
TABLE 27 NORTH AMERICA OTHERS IN MASS SPECTROMETRY MARKET, BY REGION, 2022-2031 (USD THOUSAND)
TABLE 28 NORTH AMERICA MASS SPECTROMETRY MARKET, BY REGION, 2022-2031 (USD THOUSAND)
TABLE 29 NORTH AMERICA MASS SPECTROMETRY MARKET, BY COUNTRY, 2022-2031 (USD THOUSAND)
TABLE 30 NORTH AMERICA MASS SPECTROMETRY MARKET, BY TECHNOLOGY, 2022-2031 (USD THOUSAND)
TABLE 31 NORTH AMERICA HYBRID MASS SPECTROMETRY IN MASS SPECTROMETRY MARKET, BY TYPE, 2022-2031 (USD THOUSAND)
TABLE 32 NORTH AMERICA SINGLE MASS SPECTROMETRY IN MASS SPECTROMETRY MARKET, BY TYPE, 2022-2031 (USD THOUSAND)
TABLE 33 NORTH AMERICA MASS SPECTROMETRY MARKET, BY MODALITY, 2022-2031 (USD THOUSAND)
TABLE 34 NORTH AMERICA MASS SPECTROMETRY MARKET, BY APPLICATION, 2022-2031 (USD THOUSAND)
TABLE 35 NORTH AMERICA MASS SPECTROMETRY MARKET, BY END USER, 2022-2031 (USD THOUSAND)
TABLE 36 NORTH AMERICA MASS SPECTROMETRY MARKET, BY DISTRIBUTION CHANNEL, 2022-2031 (USD THOUSAND)
TABLE 37 U.S. MASS SPECTROMETRY MARKET, BY TECHNOLOGY, 2022-2031 (USD THOUSAND)
TABLE 38 U.S. HYBRID MASS SPECTROMETRY IN MASS SPECTROMETRY MARKET, BY TYPE, 2022-2031 (USD THOUSAND)
TABLE 39 U.S. SINGLE MASS SPECTROMETRY IN MASS SPECTROMETRY MARKET, BY TYPE, 2022-2031 (USD THOUSAND)
TABLE 40 U.S. MASS SPECTROMETRY MARKET, BY MODALITY, 2022-2031 (USD THOUSAND)
TABLE 41 U.S. MASS SPECTROMETRY MARKET, BY APPLICATION, 2022-2031 (USD THOUSAND)
TABLE 42 U.S. MASS SPECTROMETRY MARKET, BY END USER, 2022-2031 (USD THOUSAND)
TABLE 43 U.S. MASS SPECTROMETRY MARKET, BY DISTRIBUTION CHANNEL, 2022-2031 (USD THOUSAND)
TABLE 44 CANADA MASS SPECTROMETRY MARKET, BY TECHNOLOGY, 2022-2031 (USD THOUSAND)
TABLE 45 CANADA HYBRID MASS SPECTROMETRY IN MASS SPECTROMETRY MARKET, BY TYPE, 2022-2031 (USD THOUSAND)
TABLE 46 CANADA SINGLE MASS SPECTROMETRY IN MASS SPECTROMETRY MARKET, BY TYPE, 2022-2031 (USD THOUSAND)
TABLE 47 CANADA MASS SPECTROMETRY MARKET, BY MODALITY, 2022-2031 (USD THOUSAND)
TABLE 48 CANADA MASS SPECTROMETRY MARKET, BY APPLICATION, 2022-2031 (USD THOUSAND)
TABLE 49 CANADA MASS SPECTROMETRY MARKET, BY END USER, 2022-2031 (USD THOUSAND)
TABLE 50 CANADA MASS SPECTROMETRY MARKET, BY DISTRIBUTION CHANNEL, 2022-2031 (USD THOUSAND)
TABLE 51 MEXICO MASS SPECTROMETRY MARKET, BY TECHNOLOGY, 2022-2031 (USD THOUSAND)
TABLE 52 MEXICO HYBRID MASS SPECTROMETRY IN MASS SPECTROMETRY MARKET, BY TYPE, 2022-2031 (USD THOUSAND)
TABLE 53 MEXICO SINGLE MASS SPECTROMETRY IN MASS SPECTROMETRY MARKET, BY TYPE, 2022-2031 (USD THOUSAND)
TABLE 54 MEXICO MASS SPECTROMETRY MARKET, BY MODALITY, 2022-2031 (USD THOUSAND)
TABLE 55 MEXICO MASS SPECTROMETRY MARKET, BY APPLICATION, 2022-2031 (USD THOUSAND)
TABLE 56 MEXICO MASS SPECTROMETRY MARKET, BY END USER, 2022-2031 (USD THOUSAND)
TABLE 57 MEXICO MASS SPECTROMETRY MARKET, BY DISTRIBUTION CHANNEL, 2022-2031 (USD THOUSAND)
List of Figure
FIGURE 1 NORTH AMERICA MASS SPECTROMETRY MARKET: SEGMENTATION
FIGURE 2 NORTH AMERICA MASS SPECTROMETRY MARKET: DATA TRIANGULATION
FIGURE 3 NORTH AMERICA MASS SPECTROMETRY MARKET: DROC ANALYSIS
FIGURE 4 NORTH AMERICA MASS SPECTROMETRY MARKET: NORTH AMERICA VS REGIONAL MARKET ANALYSIS
FIGURE 5 NORTH AMERICA MASS SPECTROMETRY MARKET: COMPANY RESEARCH ANALYSIS
FIGURE 6 NORTH AMERICA MASS SPECTROMETRY MARKET: MULTIVARIATE MODELLING
FIGURE 7 NORTH AMERICA MASS SPECTROMETRY MARKET: INTERVIEW DEMOGRAPHICS
FIGURE 8 NORTH AMERICA MASS SPECTROMETRY MARKET: DBMR MARKET POSITION GRID
FIGURE 9 NORTH AMERICA MASS SPECTROMETRY MARKET: VENDOR SHARE ANALYSIS
FIGURE 10 NORTH AMERICA MASS SPECTROMETRY MARKET: MARKET END USER COVERAGE GRID
FIGURE 11 NORTH AMERICA MASS SPECTROMETRY MARKET: SEGMENTATION
FIGURE 12 EXECUTIVE SUMMARY
FIGURE 13 STRATEGIC DECISIONS
FIGURE 14 NORTH AMERICA MASS SPECTROMETRY MARKET
FIGURE 15 HYBRID MASS SPECTROMETRY SEGMENT IS EXPECTED TO ACCOUNT FOR THE LARGEST SHARE OF THE NORTH AMERICA MASS SPECTROMETRY MARKET IN 2024 & 2031
FIGURE 16 DROC ANALYSIS
FIGURE 17 NORTH AMERICA MASS SPECTROMETRY MARKET: BY TECHNOLOGY, 2023
FIGURE 18 NORTH AMERICA MASS SPECTROMETRY MARKET: BY TECHNOLOGY, 2024-2031 (USD THOUSAND)
FIGURE 19 NORTH AMERICA MASS SPECTROMETRY MARKET: BY TECHNOLOGY, CAGR (2024-2031)
FIGURE 20 NORTH AMERICA MASS SPECTROMETRY MARKET: BY TECHNOLOGY, LIFELINE CURVE
FIGURE 21 NORTH AMERICA MASS SPECTROMETRY MARKET: BY MODALITY, 2023
FIGURE 22 NORTH AMERICA MASS SPECTROMETRY MARKET: BY MODALITY, 2024-2031 (USD THOUSAND)
FIGURE 23 NORTH AMERICA MASS SPECTROMETRY MARKET: BY MODALITY, CAGR (2024-2031)
FIGURE 24 NORTH AMERICA MASS SPECTROMETRY MARKET: BY MODALITY, LIFELINE CURVE
FIGURE 25 NORTH AMERICA MASS SPECTROMETRY MARKET: BY APPLICATION, 2023
FIGURE 26 NORTH AMERICA MASS SPECTROMETRY MARKET: BY APPLICATION, 2024-2031 (USD THOUSAND)
FIGURE 27 NORTH AMERICA MASS SPECTROMETRY MARKET: BY APPLICATION, CAGR (2024-2031)
FIGURE 28 NORTH AMERICA MASS SPECTROMETRY MARKET: BY APPLICATION, LIFELINE CURVE
FIGURE 29 NORTH AMERICA MASS SPECTROMETRY MARKET: BY DISTRIBUTION CHANNEL, 2023
FIGURE 30 NORTH AMERICA MASS SPECTROMETRY MARKET: BY DISTRIBUTION CHANNEL, 2024-2031 (USD THOUSAND)
FIGURE 31 NORTH AMERICA MASS SPECTROMETRY MARKET: BY DISTRIBUTION CHANNEL, CAGR (2024-2031)
FIGURE 32 NORTH AMERICA MASS SPECTROMETRY MARKET: BY DISTRIBUTION CHANNEL, LIFELINE CURVE
FIGURE 33 NORTH AMERICA MASS SPECTROMETRY MARKET: BY END USER, 2023
FIGURE 34 NORTH AMERICA MASS SPECTROMETRY MARKET: BY END USER, 2024-2031 (USD THOUSAND)
FIGURE 35 NORTH AMERICA MASS SPECTROMETRY MARKET: BY END USER, CAGR (2024-2031)
FIGURE 36 NORTH AMERICA MASS SPECTROMETRY MARKET: BY END USER, LIFELINE CURVE
FIGURE 37 NORTH AMERICA MASS SPECTROMETRY MARKET: SNAPSHOT (2023)
FIGURE 38 NORTH AMERICA MASS SPECTROMETRY MARKET: COMPANY SHARE 2023 (%)
Data collection and base year analysis are done using data collection modules with large sample sizes. The stage includes obtaining market information or related data through various sources and strategies. It includes examining and planning all the data acquired from the past in advance. It likewise envelops the examination of information inconsistencies seen across different information sources. The market data is analysed and estimated using market statistical and coherent models. Also, market share analysis and key trend analysis are the major success factors in the market report. To know more, please request an analyst call or drop down your inquiry.
The key research methodology used by DBMR research team is data triangulation which involves data mining, analysis of the impact of data variables on the market and primary (industry expert) validation. Data models include Vendor Positioning Grid, Market Time Line Analysis, Market Overview and Guide, Company Positioning Grid, Patent Analysis, Pricing Analysis, Company Market Share Analysis, Standards of Measurement, Global versus Regional and Vendor Share Analysis. To know more about the research methodology, drop in an inquiry to speak to our industry experts.
Data Bridge Market Research is a leader in advanced formative research. We take pride in servicing our existing and new customers with data and analysis that match and suits their goal. The report can be customized to include price trend analysis of target brands understanding the market for additional countries (ask for the list of countries), clinical trial results data, literature review, refurbished market and product base analysis. Market analysis of target competitors can be analyzed from technology-based analysis to market portfolio strategies. We can add as many competitors that you require data about in the format and data style you are looking for. Our team of analysts can also provide you data in crude raw excel files pivot tables (Fact book) or can assist you in creating presentations from the data sets available in the report.


