
North America Mobility As A Service Market
Market Size in USD Billion
 USD
80.45 Billion
USD
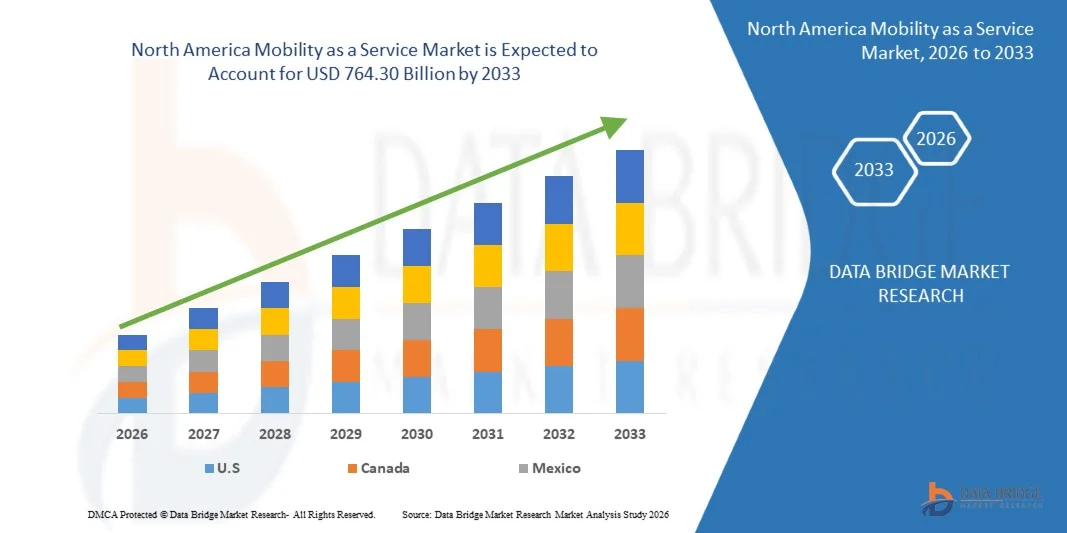
764.30 Billion
2025
2033
USD
80.45 Billion
USD
764.30 Billion
2025
2033
| 2026 - 2033 | |
| USD 80.45 Billion | |
| USD 764.30 Billion | |
| % | |
|
North America Mobility as a Service Market Size
- The North America mobility as a service market size was valued at USD 80.45 billion in 2025 and is expected to reach USD 764.30 billion by 2033, at a CAGR of 32.50% during the forecast period
- The market growth is largely fuelled by the increasing adoption of shared mobility solutions, including ride-hailing, car-sharing, and micro-mobility services, which offer cost-effective and convenient alternatives to private vehicle ownership
- Rising urbanization, traffic congestion, and environmental concerns are driving both public and private stakeholders to integrate multimodal transport services under MaaS platforms, enhancing overall transportation efficiency
North America Mobility as a Service Market Analysis
- The market is witnessing significant investment from technology providers, transport operators, and automotive companies, focusing on the integration of AI, IoT, and data analytics to optimize mobility services and improve user experience
- Increasing consumer preference for on-demand, subscription-based transportation and the growth of smartphone applications for route planning, booking, and payment are further driving market adoption across the region
- U.S. MaaS market captured the largest revenue share in 2025 within North America, fueled by high smartphone penetration, expanding urban populations, and the increasing demand for flexible and efficient transportation options
- Canada is expected to witness the highest compound annual growth rate (CAGR) in the North America mobility as a service market due to rising urbanization, increased adoption of shared mobility solutions, expansion of smart city initiatives, and growing investments in digital transportation infrastructure
Report Scope and North America Mobility as a Service Market Segmentation
|
Attributes |
North America Mobility as a Service Key Market Insights |
|
Segments Covered |
|
|
Countries Covered |
North America
|
|
Key Market Players |
|
|
Market Opportunities |
|
|
Value Added Data Infosets |
In addition to the market insights such as market value, growth rate, market segments, geographical coverage, market players, and market scenario, the market report curated by the Data Bridge Market Research team includes in-depth expert analysis, import/export analysis, pricing analysis, production consumption analysis, and pestle analysis. |
North America Mobility as a Service Market Trends
“Rise of Integrated Digital Mobility Platforms”
- The increasing adoption of integrated digital mobility platforms is transforming the transportation landscape by enabling seamless, on-demand multi-modal travel experiences. Users can plan, book, and pay for trips across buses, trains, ridesharing, and micro-mobility services through a single app, improving convenience and travel efficiency. The platforms also provide predictive analytics for demand forecasting and route optimization, helping operators reduce congestion and enhance urban mobility planning
- The high demand for flexible and personalized mobility solutions in urban areas is accelerating the deployment of MaaS platforms. These platforms are particularly effective in reducing traffic congestion, lowering carbon emissions, and promoting shared transportation models, supported by smart city initiatives and municipal transport authorities. Integration with electric and autonomous vehicles further enhances environmental sustainability and operational efficiency
- The integration of AI, IoT, and real-time data analytics in MaaS platforms is enhancing route optimization, dynamic pricing, and predictive maintenance. Operators benefit from increased operational efficiency and better customer experiences, leading to higher adoption rates and improved service quality. In addition, real-time feedback and usage data allow continuous platform improvements and targeted service expansions
- For instance, in 2023, several U.S. metropolitan cities reported increased usage of MaaS apps, resulting in reduced commute times, improved last-mile connectivity, and higher adoption of shared transportation services. The adoption also encouraged partnerships between private mobility providers and public transport authorities, creating more cohesive and user-friendly urban mobility networks
- While MaaS is reshaping urban mobility, its impact depends on continued technological advancements, regulatory support, and public-private collaborations. Providers must focus on interoperability, user-friendly interfaces, and reliable payment solutions to fully leverage market growth. Continuous innovation in mobile applications, AI-driven recommendations, and multi-modal integration remains crucial for sustained adoption
North America Mobility as a Service Market Dynamics
Driver
“Rising Preference For Shared And On-Demand Transportation”
- Growing environmental awareness, traffic congestion, and rising fuel costs are driving consumers to prefer shared and on-demand transportation solutions over private vehicles. This trend is accelerating investments in mobility platforms that integrate multiple transport modes for a seamless experience. The shift also supports reduced urban pollution and promotes a culture of shared economy mobility
- Transportation authorities and private operators are increasingly adopting digital MaaS solutions to improve efficiency, optimize route planning, and reduce operational costs. Enhanced data-driven insights help operators adjust supply to meet real-time demand, improving service reliability and user satisfaction. Integration with payment systems and loyalty programs further incentivizes user adoption and engagement
- Government initiatives promoting sustainable urban mobility, smart city development, and electric vehicle adoption further support MaaS growth. Policies incentivizing shared mobility, reducing single-occupancy vehicle use, and integrating public transport with MaaS platforms create a favorable environment for market expansion. Funding programs for digital infrastructure and green mobility projects also accelerate technology deployment
- For instance, in 2022, several North American cities introduced pilot programs for integrated MaaS apps linking public transit, bike-sharing, and ridesharing, which boosted adoption and encouraged multimodal commuting. Early results showed higher public transport usage and increased shared mobility satisfaction among users, highlighting the benefits of coordinated platforms
- While shared mobility trends are fueling market growth, operators must address challenges such as payment interoperability, regulatory compliance, and user trust to ensure long-term adoption and scalability. Continuous engagement with regulators, public authorities, and technology partners is essential for expanding service coverage and reliability
Restraint/Challenge
“High Infrastructure Costs And Integration Complexities”
- The high capital investment required to implement and maintain integrated MaaS platforms, including digital infrastructure, app development, and payment systems, limits adoption among smaller operators and municipalities. Cost remains a significant barrier to large-scale deployment, particularly for regions with limited public-private funding. Long-term operational maintenance and technology upgrades further add to financial strain
- Many regions face challenges in integrating multiple transportation modes into a unified digital platform, including technical compatibility, data standardization, and interoperability issues. These complexities can hinder seamless service delivery and delay adoption timelines. Legacy transportation systems and fragmented networks further complicate integration and require extensive IT solutions
- Market growth is also affected by regulatory hurdles, cybersecurity concerns, and resistance from traditional transport providers. Operators must invest in network security, legal compliance, and stakeholder engagement to achieve smooth integration and reliable operations. Adequate staff training and user education are equally important to ensure secure and efficient platform usage
- For instance, in 2023, several U.S. and Canadian cities experienced delays in rolling out unified MaaS solutions due to complex coordination between public transit authorities and private mobility providers, highlighting the need for robust planning and stakeholder collaboration. These delays also affected user adoption rates and necessitated additional investments in system upgrades and interoperability testing
- While MaaS solutions continue to evolve, addressing high costs, technical integration challenges, and regulatory compliance remains critical. Providers must focus on scalable, modular, and secure platforms to unlock the full potential of the North American mobility market. Partnerships with technology vendors, cloud service providers, and municipalities are key to achieving seamless, sustainable, and efficient MaaS deployments
North America Mobility as a Service Market Scope
The market is segmented on the basis of service type, solution, transportation type, vehicle type, application platform, requirement type, organization size, and usage.
• By Service Type
On the basis of service type, the North America Mobility as a Service (MaaS) market is segmented into car sharing, bus sharing, train, ride hailing, bi-cycle sharing, self-driving cars, and others. The ride-hailing segment held the largest market revenue share in 2025, driven by high urban demand, convenience, and widespread adoption of app-based on-demand mobility services. Ride-hailing platforms also enable seamless integration with other transport modes, enhancing multi-modal travel experiences for daily commuters and city travelers.
The car-sharing segment is expected to witness the fastest growth rate from 2026 to 2033, fueled by rising awareness of sustainable transportation, reduced private car ownership, and government incentives promoting shared mobility. Car-sharing services also provide flexible access to vehicles for urban users without the burden of ownership costs, making it increasingly popular in metropolitan regions.
• By Solution
On the basis of solution, the market is segmented into navigation solutions, ticketing solutions, technology platforms, insurance services, telecom connectivity providers, and payment engines. Technology platforms held the largest revenue share in 2025, attributed to their role in integrating multiple transport modes, providing real-time travel updates, and enabling secure payment options across services.
Navigation solutions are expected to witness the fastest growth rate from 2026 to 2033, driven by AI-based route optimization, predictive traffic analytics, and enhanced commuter guidance. These solutions improve travel efficiency, reduce congestion, and increase user satisfaction, supporting higher adoption of MaaS platforms.
• By Transportation Type
On the basis of transportation type, the market is segmented into public and private. Public transportation accounted for the largest share in 2025 due to the integration of buses, trains, and metro systems within MaaS platforms, enabling seamless commuter experiences.
Private transportation is projected to witness the fastest growth rate from 2026 to 2033, driven by ride-hailing, car-sharing, and emerging micro-mobility services. These options offer flexible, on-demand access to vehicles, supporting urban mobility needs and reducing dependency on personal car ownership.
• By Vehicle Type
On the basis of vehicle type, the market is segmented into four wheelers, bus, train, and micro-mobility. Four wheelers dominated the market in 2025, driven by widespread ride-hailing and car-sharing services.
Micro-mobility, including e-bikes and scooters, is expected to witness the fastest growth from 2026 to 2033, fueled by urban congestion, increasing demand for short-distance travel, and government initiatives promoting eco-friendly last-mile transportation.
• By Application Platform
On the basis of application platform, the market is segmented into iOS, Android, and others. Android applications held the largest revenue share in 2025, due to wider smartphone penetration and affordability across urban and semi-urban areas.
iOS platforms are expected to grow at the fastest rate from 2026 to 2033, supported by high-end user adoption and integration with premium MaaS services, offering enhanced security and seamless mobile payment experiences.
• By Requirement Type
On the basis of requirement type, the market is segmented into first and last mile connectivity, off-peak and shift work commute, daily commuter, airport or mass transit stations trips, inter-city trips, and others. Daily commuter services held the largest share in 2025, driven by increasing urban workforce reliance on public transport and shared mobility solutions.
First and last mile connectivity is expected to witness the fastest growth rate from 2026 to 2033, supported by MaaS platforms optimizing seamless access between residential areas and major transit hubs, improving overall commuter convenience and efficiency.
• By Organization Size
On the basis of organization size, the market is segmented into large enterprises and small and medium size enterprises (SMEs). Large enterprises accounted for the largest share in 2025 due to the early adoption of corporate mobility programs and employee transportation solutions.
SMEs are expected to witness the fastest growth from 2026 to 2033, as digital MaaS solutions become increasingly accessible, cost-effective, and scalable for smaller organizations, improving operational efficiency and workforce mobility.
• By Usage
On the basis of usage, the market is segmented into commercial and personal. Commercial usage held the largest share in 2025, driven by integration with public transport authorities, corporate travel programs, and urban logistics mobility services.
Personal usage is expected to witness the fastest growth from 2026 to 2033, fueled by rising adoption of ride-hailing, car-sharing, and micro-mobility services for daily commuting, leisure, and urban travel purposes.
North America Mobility as a Service Market Regional Analysis
- U.S. MaaS market captured the largest revenue share in 2025 within North America, fueled by high smartphone penetration, expanding urban populations, and the increasing demand for flexible and efficient transportation options
- Consumers are increasingly prioritizing convenience and cost-effective mobility through multi-modal digital platforms. The growing integration of MaaS apps with public transit, ride-hailing, and micro-mobility solutions, along with features such as real-time tracking, dynamic pricing, and cashless payments, is significantly contributing to market expansion
Canada Mobility as a Service Market Insight
The Canada MaaS market is expected to witness the fastest growth rate from 2026 to 2033, driven by increasing urbanization, rising smartphone penetration, and growing awareness of shared and sustainable transportation solutions. Government initiatives promoting smart cities, integrated public transit systems, and low-emission mobility options are encouraging the adoption of MaaS platforms. The increasing demand for convenient, flexible, and cost-effective multi-modal travel solutions, combined with investments in digital infrastructure and real-time mobility apps, is significantly propelling market growth across both residential and commercial segments in Canada.
North America Mobility as a Service Market Share
The North America mobility as a service industry is primarily led by well-established companies, including:
- Uber Technologies, Inc. (U.S.)
- Lyft, Inc. (U.S.)
- Bird Rides, Inc. (U.S.)
- Lime (U.S.)
- Via Transportation, Inc. (U.S.)
- Zipcar, Inc. (U.S.)
- Motivate (U.S.)
- Masabi (U.K.)
- TransLoc (U.S.)
- Bridj (U.S.)
SKU-

- Interactive Data Analysis Dashboard
- Company Analysis Dashboard for high growth potential opportunities
- Research Analyst Access for customization & queries
- Competitor Analysis with Interactive dashboard
- Latest News, Updates & Trend analysis
- Harness the Power of Benchmark Analysis for Comprehensive Competitor Tracking
Data collection and base year analysis are done using data collection modules with large sample sizes. The stage includes obtaining market information or related data through various sources and strategies. It includes examining and planning all the data acquired from the past in advance. It likewise envelops the examination of information inconsistencies seen across different information sources. The market data is analysed and estimated using market statistical and coherent models. Also, market share analysis and key trend analysis are the major success factors in the market report. To know more, please request an analyst call or drop down your inquiry.
The key research methodology used by DBMR research team is data triangulation which involves data mining, analysis of the impact of data variables on the market and primary (industry expert) validation. Data models include Vendor Positioning Grid, Market Time Line Analysis, Market Overview and Guide, Company Positioning Grid, Patent Analysis, Pricing Analysis, Company Market Share Analysis, Standards of Measurement, Global versus Regional and Vendor Share Analysis. To know more about the research methodology, drop in an inquiry to speak to our industry experts.
Data Bridge Market Research is a leader in advanced formative research. We take pride in servicing our existing and new customers with data and analysis that match and suits their goal. The report can be customized to include price trend analysis of target brands understanding the market for additional countries (ask for the list of countries), clinical trial results data, literature review, refurbished market and product base analysis. Market analysis of target competitors can be analyzed from technology-based analysis to market portfolio strategies. We can add as many competitors that you require data about in the format and data style you are looking for. Our team of analysts can also provide you data in crude raw excel files pivot tables (Fact book) or can assist you in creating presentations from the data sets available in the report.


