
North America Neuroendocrine Tumors Market
Market Size in USD Billion
 USD
1.81 Billion
USD
3.96 Billion
2024
2032
USD
1.81 Billion
USD
3.96 Billion
2024
2032
| 2025 - 2032 | |
| USD 1.81 Billion | |
| USD 3.96 Billion | |
| % | |
|
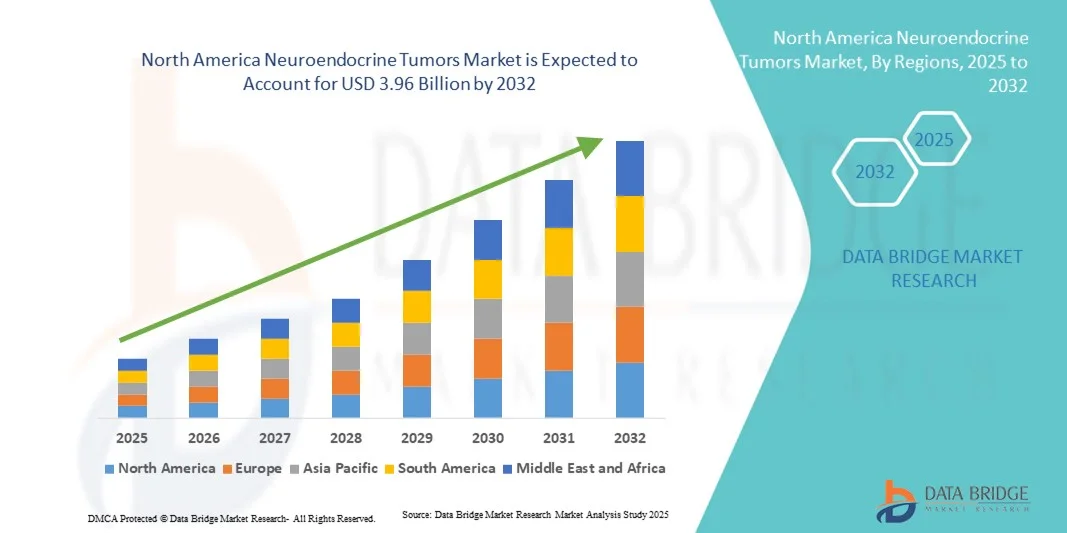
North America Neuroendocrine Tumors Market Size
- The North America Neuroendocrine Tumors market size was valued at USD 1.81 billion in 2024 and is expected to reach USD 3.96 billion by 2032, at a CAGR of 10.3% during the forecast period
- The market growth is largely fueled by the increasing incidence of neuroendocrine tumors worldwide, rising awareness regarding early diagnosis, and growing demand for effective therapeutic interventions. Advances in imaging technologies, targeted therapies, and minimally invasive surgical procedures are further supporting the expansion of the neuroendocrine tumors market globally
- Furthermore, the rising geriatric population, growing prevalence of associated comorbidities, and improved access to specialized oncology centers are driving the adoption of effective neuroendocrine tumors treatment solutions. These converging factors are accelerating the uptake of surgical, targeted, and systemic therapies, thereby significantly boosting the industry’s growth
North America Neuroendocrine Tumors Market Analysis
- Neuroendocrine Tumors treatment, including surgical resection, peptide receptor radionuclide therapy (PRRT), targeted therapy, and systemic treatments, is increasingly recognized as a critical solution for managing NETs and improving patient outcomes. The rising prevalence of NETs and advancements in diagnostic and therapeutic approaches are driving market expansion globally
- The market growth is primarily fueled by increasing awareness among healthcare providers and patients regarding early detection, advances in minimally invasive surgeries, and improved access to specialized oncology centers. These factors are accelerating the adoption of NETs treatment solutions across regions
- The U.S. dominated the neuroendocrine tumors market with the largest revenue share of 44.2% in 2024, supported by advanced healthcare infrastructure, high adoption of targeted therapies, and a strong presence of key industry players, with substantial growth in NET treatment adoption, particularly in specialized oncology centers and research hospitals
- Canada is expected to be the fastest-growing country in the neuroendocrine tumors market during the forecast period, fueled by increasing healthcare awareness, rising disposable incomes, and expanding access to advanced oncology centers and private hospitals
- The Prescription segment captured the largest revenue share of 89.1% in 2024, due to the complexity of NET therapies requiring strict physician oversight. Prescription channels ensure proper dosing, monitoring, and follow-up
Report Scope and Neuroendocrine Tumors Market Segmentation
|
Attributes |
Neuroendocrine Tumors Key Market Insights |
|
Segments Covered |
|
|
Countries Covered |
North America
|
|
Key Market Players |
|
|
Market Opportunities |
|
|
Value Added Data Infosets |
In addition to the insights on market scenarios such as market value, growth rate, segmentation, geographical coverage, and major players, the market reports curated by the Data Bridge Market Research also include in-depth expert analysis, patient epidemiology, pipeline analysis, pricing analysis, and regulatory framework. |
North America Neuroendocrine Tumors Market Trends
Emerging Trends in Diagnosis and Targeted Therapies
- A key and accelerating trend in the neuroendocrine tumors (NETs) market is the growing emphasis on precision medicine and targeted therapies. Advances in molecular profiling, genetic testing, and imaging techniques are allowing clinicians to better identify tumor subtypes and tailor treatment plans for individual patients
- For instance, the use of somatostatin receptor imaging (SRI) combined with PET/CT scans is improving the accuracy of NET detection and staging. Similarly, novel peptide receptor radionuclide therapy (PRRT) agents are enabling more effective treatment with fewer side effects
- Another notable trend is the integration of minimally invasive surgical techniques and interventional radiology procedures, which enhance patient outcomes and reduce recovery times
- Theranostics, which combines therapy and diagnostics, is gaining prominence, allowing simultaneous imaging and treatment of tumors, thereby optimizing treatment efficacy
- There is also a rising adoption of combination therapies, such as targeted therapy with immunotherapy or chemotherapy, to improve patient survival and reduce recurrence rates
- Patient-centric care is becoming more common, with increased focus on quality-of-life assessments, symptom management, and personalized follow-up strategies
- The trend towards earlier diagnosis and targeted interventions is expected to redefine NET management protocols, improve long-term survival, and reduce healthcare costs
- Healthcare providers are increasingly investing in clinical trials and real-world evidence studies to validate the effectiveness of emerging therapies, driving adoption across both developed and emerging markets
North America Neuroendocrine Tumors Market Dynamics
Driver
Rising Prevalence and Awareness of Neuroendocrine tumors
- The increasing incidence of neuroendocrine tumors worldwide is a key growth driver for the market. Improved screening and awareness campaigns are contributing to higher diagnosis rates
- For instance, a surge in gastroenteropancreatic NET detection in Europe and North America has led to earlier treatment initiation and improved patient outcomes
- Expanding research on NET biomarkers and the development of novel targeted therapies are increasing treatment options and enhancing patient survival
- Healthcare infrastructure improvements, particularly in emerging regions , are facilitating access to specialized NET treatment centers
- Rising awareness among physicians and patients about advanced imaging techniques and targeted therapies is accelerating adoption
- Supportive care initiatives and patient advocacy programs are further boosting treatment uptake and adherence
Restraint/Challenge
Concerns Regarding High Treatment Costs, Limited Access, and Diagnostic Complexity
- The high cost of neuroendocrine tumor treatments, particularly advanced therapies such as PRRT and biologics, remains a major challenge limiting widespread adoption, especially in low- and middle-income countries
- For instance, a single PRRT treatment cycle can cost tens of thousands of dollars, posing financial strain even in regions with partial insurance coverage
- Limited access to specialized treatment centers equipped to administer radioligand or targeted therapies further restricts patient reach, especially in rural or underdeveloped healthcare infrastructures
- Delayed or missed diagnoses due to nonspecific symptoms often lead to late-stage detection, reducing therapeutic efficacy and survival rates
- The shortage of trained oncologists and nuclear medicine specialists in several regions adds to treatment delays and impacts the quality of care for patients with NETs
- In addition, stringent regulatory frameworks for radiopharmaceutical development and approval often extend commercialization timelines, hindering the introduction of novel therapies
- High R&D costs, coupled with uncertain reimbursement scenarios for emerging targeted treatments, discourage smaller pharmaceutical players from entering the market
- Furthermore, the emotional and psychological burden on patients, coupled with the complexity of long-term disease management, creates additional challenges in maintaining treatment adherence
- Data fragmentation across healthcare systems limits large-scale epidemiological studies, delaying the development of unified treatment guidelines
- Overcoming these challenges through improved healthcare infrastructure, stronger reimbursement frameworks, and the development of cost-effective diagnostic and treatment alternatives will be crucial for sustained Neuroendocrine Tumors market growth
North America Neuroendocrine Tumors Market Scope
The market is segmented on the basis of classification, site, grade, type, route of administration, mode of purchase, end user, and distribution channel.
- By Classification
On the basis of classification, the Neuroendocrine Tumors market is segmented into Functional NET and Non-Functional NET. The Functional NET segment dominated the market with a 61.4% revenue share in 2024, driven by the high prevalence of hormone-secreting tumors such as insulinomas, gastrinomas, and carcinoid tumors. Functional NETs are often detected earlier due to symptomatic hormone secretion, enabling timely diagnosis and treatment. Adoption of somatostatin analogs, PRRT, and targeted biologics such as everolimus supports segment leadership. Favorable reimbursement policies, rising diagnostic awareness, and improved healthcare access contribute to dominance. Multidisciplinary care and advanced imaging facilities in developed markets like the U.S., Germany, and Japan enhance treatment accuracy. Continuous research in hormonal regulation pathways strengthens patient outcomes. The segment benefits from early-stage detection leading to better prognosis. Functional NET patients often require integrated therapy plans. Hospitals and specialty clinics facilitate advanced treatment adoption. Availability of long-term therapy options ensures consistent revenue growth. Increasing clinical trial activity in hormone-secreting tumors further reinforces leadership. The segment remains the focus of oncology innovation and therapeutic advancements.
The Non-Functional NET segment is projected to witness the fastest CAGR of 9.8% from 2025 to 2032, driven by rising detection of asymptomatic NETs through advanced imaging modalities such as PET-CT and MRI. Molecular profiling and genetic testing improve diagnostic precision, particularly for silent tumors. Adoption of PRRT and radioligand therapies for advanced or metastatic stages fuels growth. Investments in oncology research and increasing awareness among clinicians support rapid expansion. Non-functional tumors, previously underdiagnosed, are increasingly recognized as high-priority treatment targets. Growing patient pools in emerging markets boost segment potential. Improved access to specialized centers enhances uptake. Awareness campaigns and screening programs increase early detection rates. Healthcare infrastructure expansion facilitates delivery of novel therapies. Increased collaborations between hospitals and research centers drive innovation. Government support for oncology research accelerates growth. Market penetration is further strengthened by the rising number of clinical trials. Patient education initiatives on silent NETs contribute to rapid adoption.
- By Site
On the basis of site, the Neuroendocrine Tumors market is segmented into Gastrointestinal Tract (GI) and Pancreas. The Gastrointestinal Tract (GI) segment held the largest revenue share of 48.6% in 2024, driven by high prevalence of small intestine and colorectal NETs. GI NETs benefit from endoscopic diagnostics and advanced imaging techniques for early detection. Favorable reimbursement policies for GI treatments enhance market leadership. Early symptom recognition and multiple therapy options, including somatostatin analogs and targeted biologics, reinforce dominance. Research focus on GI malignancies supports consistent growth. Hospitals and specialty clinics facilitate early intervention. Screening programs and patient awareness campaigns strengthen uptake. Development of advanced biopsy and histopathology techniques improves accuracy. Increasing prevalence of GI malignancies drives treatment demand. Clinical trials targeting digestive system NETs enhance therapeutic innovations. Growth is supported by urban healthcare infrastructure expansion. Adoption of minimally invasive interventions contributes to sustained revenue. The integration of targeted therapies with conventional care ensures effective management.
The Pancreas segment is anticipated to register the fastest CAGR of 10.3% from 2025 to 2032, driven by rising prevalence of pancreatic NETs (pNETs) and strong pipeline development for PRRT and targeted therapies. Molecular imaging and genetic testing enable early detection. Novel drugs such as sunitinib and everolimus improve survival outcomes. Increased government initiatives for rare cancers facilitate clinical trial participation. Precision oncology adoption accelerates diagnosis and treatment planning. Advanced imaging and biomarker screening enhance therapeutic decision-making. Specialized centers for pNET care are expanding. Rising awareness among oncologists and patients supports uptake. Enhanced focus on early intervention drives growth. Outpatient and home-based treatment models encourage adoption. International collaborations in rare cancer research foster innovation. Patient-centric care and monitoring improve compliance. The pipeline of novel therapies ensures sustained market momentum.
- By Grade
On the basis of grade, the Neuroendocrine Tumors market is segmented into Grade 1, Grade 2, and Grade 3. The Grade 2 segment dominated with a 44.8% revenue share in 2024, due to moderate tumor aggressiveness and favorable prognosis. Grade 2 NETs are often detected incidentally or through routine imaging, enabling timely treatment. Availability of targeted biologics, radioligand therapies, and effective patient management enhances segment relevance. Advanced diagnostic tools and biomarkers improve accuracy. Hospitals and specialty centers adopt combination therapy approaches. Clinical guidelines support intermediate-grade NET management. Insurance coverage and reimbursement favor this segment. Multidisciplinary treatment teams improve outcomes. Growing patient population ensures consistent demand. Research in tumor biology supports better therapy options. Awareness campaigns improve early intervention rates. Long-term care programs sustain revenue growth. Improved treatment adherence strengthens market position.
The Grade 3 segment is forecasted to grow at the fastest CAGR of 11.2% from 2025 to 2032, driven by better classification and awareness of aggressive NET variants. Clinical redefinitions separating Grade 3 NETs from NECs have improved diagnostic precision. Immunotherapy and checkpoint inhibitors expand therapeutic options. PRRT adoption in high-grade NETs accelerates treatment access. Oncology research funding fosters novel interventions. Specialized centers and clinical trials support advanced disease management. Advanced imaging and molecular profiling enable precise staging. Physician awareness and training enhance early intervention. Expansion of outpatient care models increases patient access. Emerging markets are adopting improved treatment protocols. Combination therapy strategies improve survival outcomes. Patient-centric treatment approaches enhance adherence. Increased regulatory support for advanced therapies contributes to rapid growth.
- By Type
On the basis of type, the Neuroendocrine Tumors market is segmented into Diagnosis and Treatment. The Treatment segment dominated with a 68.5% revenue share in 2024, driven by high demand for targeted therapies, somatostatin analogs, and PRRT interventions. Expanding healthcare infrastructure supports hospital-based therapy adoption. Improved access to combination therapies strengthens segment leadership. Reimbursement for radioligand therapy ensures widespread use. Long-term disease management programs support sustained revenue. Multidisciplinary oncology teams facilitate personalized treatment. Clinical trial participation expands therapy options. Advanced treatment protocols enhance survival outcomes. Adoption of novel biologics drives patient preference. Growth in emerging markets further strengthens uptake. Government funding for NET therapy supports expansion. Patient-centered care plans enhance adherence. Increasing physician awareness of targeted therapies boosts demand.
The Diagnosis segment is projected to grow at the fastest CAGR of 9.4% from 2025 to 2032, fueled by advancements in molecular imaging, histopathology, and liquid biopsy technologies. AI-based diagnostic systems improve early detection. Expansion of specialized diagnostic labs supports emerging market uptake. Novel biomarker assays enable precise tumor classification. Collaboration between hospitals and diagnostic companies drives innovation. Screening campaigns and patient awareness enhance early detection. Government-funded diagnostic programs encourage testing. Integration of molecular profiling with conventional diagnostics improves outcomes. Access to imaging technologies improves diagnosis in rural areas. Growing prevalence of NETs increases screening demand. Clinician training programs boost adoption. Research in diagnostic innovation supports ongoing market growth. Advanced imaging tools facilitate accurate staging and therapy planning.
- By Route of Administration
On the basis of route of administration, the Neuroendocrine Tumors market is segmented into Parenteral and Oral. The Parenteral segment dominated with a 72.3% revenue share in 2024, as most therapies—including somatostatin analogs and PRRT—require intravenous or subcutaneous delivery. Parenteral administration ensures rapid systemic bioavailability, precise dosing, and consistent therapeutic outcomes. Hospitals and oncology centers continue to adopt parenteral therapy for safe administration. Long-acting injectable formulations support sustained treatment. Clinical trials validate efficacy. Medical supervision ensures patient compliance and minimizes adverse events. Widespread adoption in both palliative and curative care strengthens market dominance. Integration with multidisciplinary care improves outcomes. Adoption in advanced-stage NETs supports revenue. Advanced infusion technologies enhance delivery precision. Government and private hospital support maintains consistent demand. Specialty clinics implement parenteral therapy for complex cases.
The Oral segment is anticipated to register the fastest CAGR of 8.8% from 2025 to 2032, driven by targeted oral therapies such as everolimus and sunitinib. Oral formulations offer patient convenience, long-term maintenance therapy, and reduced hospital dependency. Sustained-release and combination oral drugs enhance adoption. Patient preference for home-based treatment models drives uptake. Clinician awareness and patient education support acceptance. Growth in emerging markets expands access. Telemedicine integration facilitates monitoring and prescription adherence. Reduced logistical burden improves compliance. Increased reimbursement coverage encourages uptake. Outpatient care models support oral therapy adoption. Research in oral formulation optimization strengthens efficacy. Growing patient awareness of alternatives to injections further drives adoption. Advanced oral therapeutics complement parenteral regimens.
- By Mode of Purchase
On the basis of mode of purchase, the Neuroendocrine Tumors market is segmented into Prescription and Over the Counter (OTC). The Prescription segment captured the largest revenue share of 89.1% in 2024, due to the complexity of NET therapies requiring strict physician oversight. Prescription channels ensure proper dosing, monitoring, and follow-up. Hospitals, specialty clinics, and oncology centers support structured treatment pathways. Regulatory requirements and insurance reimbursement favor prescription adoption. Monitoring of therapy outcomes strengthens segment dominance. Multidisciplinary teams optimize adherence. Patient safety considerations maintain high uptake. Access to advanced therapies depends on prescription fulfillment. Clinical guidelines support physician-directed therapy. Hospitals act as central hubs for prescription distribution. Complex biologics require controlled dispensing. Prescription channels enable long-term patient management and compliance.
The Over the Counter (OTC) segment is expected to grow at the fastest CAGR of 7.6% from 2025 to 2032, driven by supportive products including nutritional supplements, symptom relief aids, and wellness formulations. Patient self-care initiatives and quality-of-life considerations boost adoption. Online pharmacies and e-commerce platforms improve accessibility, especially in emerging markets. Retail pharmacy expansion enhances reach. Patient education campaigns encourage use of OTC products alongside NET therapy. Convenience and home delivery support adoption. Awareness of complementary therapies drives uptake. OTC products are increasingly integrated into care pathways. Emerging market penetration strengthens growth. Affordability enhances accessibility. Wellness trends support expansion. Awareness initiatives highlight benefits for supportive care. Collaboration between healthcare providers and retail outlets increases availability.
- By End User
On the basis of end user, the Neuroendocrine Tumors market is segmented into Hospitals and Specialty Clinics. The Hospitals segment dominated with a 54.8% revenue share in 2024, due to their role as central hubs for diagnosis, PRRT administration, and comprehensive NET care. Equipped with PET-CT and MRI imaging, multidisciplinary oncology teams, nuclear medicine facilities, and radiopharmaceutical handling capabilities, hospitals ensure safe, coordinated treatment. Access to advanced diagnostics and radioligand therapies supports dominance. Government and private investments in hospital oncology departments enhance infrastructure. Patient preference for institutional care strengthens market leadership. Hospitals manage complex therapy regimens efficiently. Long-term monitoring ensures optimal outcomes. Integration of diagnostic, treatment, and post-treatment care maintains revenue growth. Availability of clinical trials improves adoption of novel therapies. Patient safety protocols increase reliability. Regulatory compliance supports consistent demand.
The Specialty Clinics segment is projected to grow at the fastest CAGR of 10.9% from 2025 to 2032, driven by expansion of oncology-focused clinics offering patient-centered NET care. Personalized and less crowded environments improve patient experience. Shorter waiting times and tailored therapy plans enhance adoption. Precision medicine and targeted therapy availability fuel demand. Outpatient care models allow continuous monitoring without hospital admission. Collaboration with research organizations promotes advanced therapy access. Awareness campaigns and patient education increase uptake. Integration with local healthcare infrastructure expands reach. Specialty clinics facilitate early diagnosis and intervention. Personalized care strengthens treatment adherence. Flexible scheduling supports patient convenience. Emerging markets benefit from specialized clinic expansion. Growth in outpatient oncology services drives revenue.
- By Distribution Channel
On the basis of distribution channel, the Neuroendocrine Tumors market is segmented into Hospital Pharmacies and Online Pharmacies. The Hospital Pharmacies segment held the largest share of 47.7% in 2024, as hospitals remain the primary channel for high-cost and regulated NET medications. Specialized storage, trained pharmacists, and bulk procurement programs ensure safe, accurate, and efficient drug distribution. Government collaborations and tender-based supply chains enhance reliability. Hospital pharmacies support both inpatient and outpatient care. Centralized distribution ensures compliance with clinical protocols. Continuous access to life-saving therapies maintains revenue. Integration with hospital oncology departments strengthens control over drug usage. Patient monitoring and follow-up improve treatment adherence. Availability of high-demand medications supports leadership. Partnerships with pharmaceutical manufacturers ensure supply continuity. Cost-effective procurement and government contracts enhance operational efficiency. Clinical safety measures reinforce adoption.
The Online Pharmacies segment is projected to grow at the fastest CAGR of 11.4% from 2025 to 2032, fueled by digital healthcare adoption, telemedicine integration, and patient preference for convenience. Online platforms offer doorstep delivery, easy prescription uploads, and automated refills. Collaboration with hospitals and insurance providers enhances trust. Remote access reduces travel burdens for long-term NET therapy patients. Emerging markets benefit from improved access. Competitive pricing and discrete packaging support adoption. Expanded product availability, including supportive care items, drives revenue. Patient education and awareness campaigns encourage utilization. Integration with e-health platforms strengthens monitoring. Data security measures improve patient confidence. Home delivery and subscription services increase convenience. Online pharmacies provide timely access to rare and high-cost therapies. Continuous technological advancements support rapid segment growth.
North America Neuroendocrine Tumors Market Regional Analysis
- The North America neuroendocrine tumors market is projected to grow significantly during the forecast period, driven by advanced healthcare infrastructure
- High adoption of targeted therapies, and the presence of key industry players
- The region is witnessing increasing awareness about neuroendocrine tumors, with specialized oncology centers and research hospitals facilitating the adoption of modern NET treatment protocols
U.S. Neuroendocrine Tumors Market Insight
The U.S. neuroendocrine tumors market dominated the neuroendocrine tumors market with the largest revenue share of 41.2% in 2024, supported by advanced healthcare infrastructure, high adoption of targeted therapies, and a strong presence of key industry players. The country has experienced substantial growth in NET treatment adoption, particularly in specialized oncology centers and research hospitals, driven by increasing patient awareness, the availability of advanced diagnostic tools, and robust healthcare investment.
Canada Neuroendocrine Tumors Market Insight
Canada neuroendocrine tumors market is expected to be the fastest-growing country in the Neuroendocrine Tumors market during the forecast period. This growth is fueled by increasing healthcare awareness, rising disposable incomes, and expanding access to advanced oncology centers and private hospitals. Canadian patients are benefiting from modern NET treatment options, and the government’s focus on improving healthcare infrastructure further supports market expansion.
North America Neuroendocrine Tumors Market Share
The Neuroendocrine Tumors industry is primarily led by well-established companies, including:
- Novartis AG (Switzerland)
- Takeda Pharmaceutical Company Limited (Japan)
- Sun Pharmaceutical Industries Ltd. (India)
- Cipla Ltd. (India)
- Biocon Ltd. (India)
- Shanghai Fosun Pharmaceutical Group Co., Ltd. (China)
- Dr. Reddy’s Laboratories Ltd. (India)
Latest Developments in North America Neuroendocrine Tumors Market
- In March 2024, Orano Med and RadioMedix received Breakthrough Therapy Designation from the U.S. Food and Drug Administration (FDA) for AlphaMedix (²¹²Pb-DOTAMTATE), a targeted alpha therapy developed for the treatment of inoperable or metastatic, progressive somatostatin receptor-expressing gastroenteropancreatic neuroendocrine tumors (GEP-NETs). This milestone recognition underscores the therapy’s potential to offer improved outcomes for patients with advanced NETs through its precise and potent alpha-emitting radiotherapeutic approach
- In September 2024, Sanofi entered into an exclusive global licensing agreement with RadioMedix, Inc. and Orano Med to co-develop and commercialize AlphaMedix. The collaboration strengthens Sanofi’s oncology pipeline and aims to accelerate global access to this first-in-class alpha-emitter radioligand therapy for NETs, highlighting the growing industry focus on radiopharmaceutical innovations
- In March 2025, the U.S. FDA approved Cabozantinib (CABOMETYX) for the treatment of previously treated advanced neuroendocrine tumors. The approval, supported by research from Dana-Farber Cancer Institute, marked a major advancement in targeted therapy for NETs, offering a novel mechanism that simultaneously inhibits multiple tyrosine kinases involved in tumor growth and angiogenesis
- In November 2024, a comprehensive market and clinical analysis by DelveInsight revealed a strong global trend toward the adoption of radioligand therapies in NET treatment. The report emphasized the shift from traditional beta-emitters (such as Lutetium-177) toward newer, more precise alpha-emitter therapies (such as Lead-212 and Actinium-225). This evolution reflects growing confidence among oncologists and investors in the efficacy and safety of alpha-based radiotherapies for improving progression-free survival in NET patient
SKU-

- Interactive Data Analysis Dashboard
- Company Analysis Dashboard for high growth potential opportunities
- Research Analyst Access for customization & queries
- Competitor Analysis with Interactive dashboard
- Latest News, Updates & Trend analysis
- Harness the Power of Benchmark Analysis for Comprehensive Competitor Tracking
Data collection and base year analysis are done using data collection modules with large sample sizes. The stage includes obtaining market information or related data through various sources and strategies. It includes examining and planning all the data acquired from the past in advance. It likewise envelops the examination of information inconsistencies seen across different information sources. The market data is analysed and estimated using market statistical and coherent models. Also, market share analysis and key trend analysis are the major success factors in the market report. To know more, please request an analyst call or drop down your inquiry.
The key research methodology used by DBMR research team is data triangulation which involves data mining, analysis of the impact of data variables on the market and primary (industry expert) validation. Data models include Vendor Positioning Grid, Market Time Line Analysis, Market Overview and Guide, Company Positioning Grid, Patent Analysis, Pricing Analysis, Company Market Share Analysis, Standards of Measurement, Global versus Regional and Vendor Share Analysis. To know more about the research methodology, drop in an inquiry to speak to our industry experts.
Data Bridge Market Research is a leader in advanced formative research. We take pride in servicing our existing and new customers with data and analysis that match and suits their goal. The report can be customized to include price trend analysis of target brands understanding the market for additional countries (ask for the list of countries), clinical trial results data, literature review, refurbished market and product base analysis. Market analysis of target competitors can be analyzed from technology-based analysis to market portfolio strategies. We can add as many competitors that you require data about in the format and data style you are looking for. Our team of analysts can also provide you data in crude raw excel files pivot tables (Fact book) or can assist you in creating presentations from the data sets available in the report.


