
North America Non Phthalate Plasticizers Market
Market Size in USD Billion
 USD
1.03 Billion
USD
1.62 Billion
2025
2033
USD
1.03 Billion
USD
1.62 Billion
2025
2033
| 2026 - 2033 | |
| USD 1.03 Billion | |
| USD 1.62 Billion | |
| % | |
|
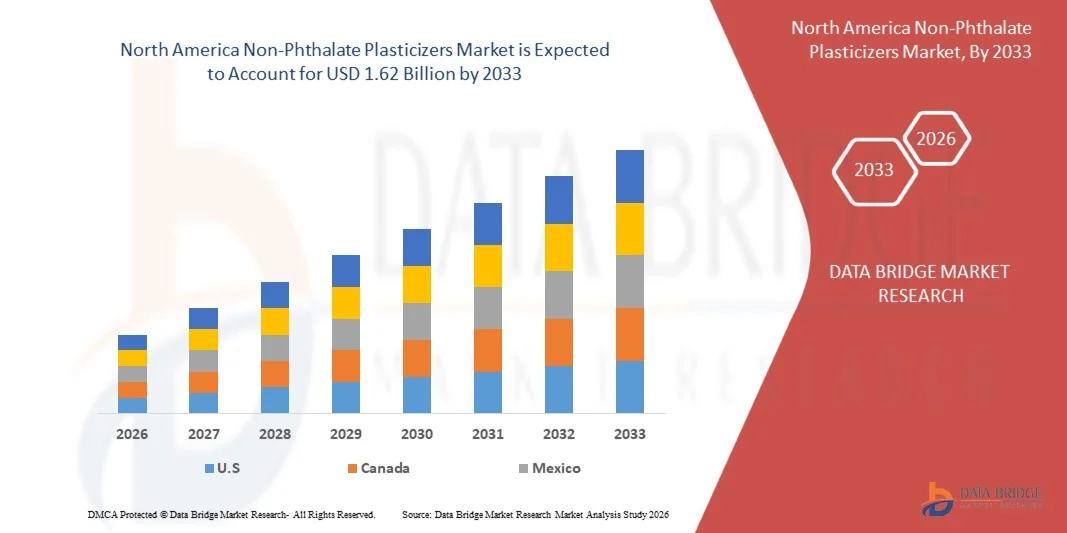
North America Non-Phthalate Plasticizers Market Size
- The North America Non-Phthalate Plasticizers Market size was valued at USD 1.03 billion in 2025 and is expected to reach USD 1.62 billion by 2033, at a CAGR of 5.9% during the forecast period
- The market growth is largely driven by increasing regulatory restrictions on phthalate-based plasticizers and the growing emphasis on environmental safety and human health, prompting manufacturers to shift toward safer non-phthalate alternatives across multiple industries
- Furthermore, rising demand for sustainable, low-toxicity, and bio-based plasticizers in construction, automotive, healthcare, and consumer goods applications is accelerating adoption, thereby significantly supporting overall market expansion
North America Non-Phthalate Plasticizers Market Analysis
- Non-phthalate plasticizers, used to enhance flexibility, durability, and performance of polymers, are becoming essential components in flexible PVC products due to their improved safety profile and compliance with stringent environmental regulations
- The increasing demand for non-phthalate plasticizers is primarily supported by growth in construction and infrastructure activities, expanding automotive production, and rising healthcare and food-contact applications where material safety and long-term performance are critical
- U.S. dominated the North America Non-Phthalate Plasticizers Market in 2025, due to stringent regulatory frameworks on chemical safety, high adoption of sustainable materials, and strong demand from construction, healthcare, and consumer goods industries
- Canada is expected to be the fastest growing region in the North America Non-Phthalate Plasticizers Market during the forecast period due to growing emphasis on environmental sustainability, increasing construction activity, and rising adoption of safer materials across consumer and industrial applications
- Monomeric plasticizers segment dominated the market with a market share of 55.6% in 2025, due to their strong plasticizing efficiency and wide usage across flexible PVC applications. Manufacturers prefer monomeric variants due to their cost-effectiveness and ability to deliver desirable softness, durability, and processing performance. These plasticizers are extensively used in flooring, cables, and films where balanced flexibility and mechanical strength are required. Their compatibility with existing PVC formulations further supports large-scale adoption across industrial and consumer applications
Report Scope and North America Non-Phthalate Plasticizers Market Segmentation
|
Attributes |
Non-Phthalate Plasticizers Key Market Insights |
|
Segments Covered |
|
|
Countries Covered |
North America
|
|
Key Market Players |
|
|
Market Opportunities |
|
|
Value Added Data Infosets |
In addition to the insights on market scenarios such as market value, growth rate, segmentation, geographical coverage, and major players, the market reports curated by the Data Bridge Market Research also include import export analysis, production capacity overview, production consumption analysis, price trend analysis, climate change scenario, supply chain analysis, value chain analysis, raw material/consumables overview, vendor selection criteria, PESTLE Analysis, Porter Analysis, and regulatory framework. |
North America Non-Phthalate Plasticizers Market Trends
“Increasing Adoption of Bio-Based and Sustainable Plasticizers”
- A prominent trend in the North America Non-Phthalate Plasticizers Market is the increasing adoption of bio-based and sustainable plasticizers, driven by growing environmental awareness and stricter global regulations on hazardous chemical usage. Manufacturers are actively shifting toward renewable and low-toxicity alternatives to meet sustainability goals while maintaining performance standards across flexible PVC applications
- For instance, BASF has expanded its portfolio of bio-based non-phthalate plasticizers under its Hexamoll and Palatinol ranges, supporting reduced carbon footprint and improved safety compliance in consumer and industrial products. These solutions are increasingly used in flooring, cables, and interior materials where sustainability certifications are becoming mandatory
- The construction industry is witnessing rising adoption of sustainable plasticizers as green building standards emphasize low-emission and recyclable materials. This trend is strengthening demand for non-phthalate options in wall coverings, flooring, and roofing membranes used in residential and commercial infrastructure
- Automotive manufacturers are integrating bio-based plasticizers to support lightweighting and environmental compliance in interior components. This is reinforcing the role of non-phthalate plasticizers in achieving long-term durability while meeting evolving sustainability benchmarks
- Healthcare and consumer goods sectors are increasingly favoring sustainable plasticizers to reduce exposure to harmful substances. This shift is accelerating innovation in bio-derived formulations that align with safety and regulatory expectations
- The growing focus on circular economy practices is further reinforcing this trend, as manufacturers invest in sustainable plasticizer solutions that balance performance, safety, and environmental responsibility across global end-use industries
North America Non-Phthalate Plasticizers Market Dynamics
Driver
“Growing Demand for Safe, Non-Toxic Materials”
- The rising demand for safe and non-toxic materials across multiple industries is a key driver of the North America Non-Phthalate Plasticizers Market, as regulatory bodies and consumers increasingly prioritize human health and environmental safety. This demand is reshaping material selection in applications involving close human contact and long-term exposure
- For instance, Eastman Chemical Company supplies non-phthalate plasticizers such as Eastman 168, which are widely adopted in food packaging, medical devices, and childcare products due to their proven safety profile. These materials help manufacturers comply with regulations set by organizations such as the U.S. FDA and the European Chemicals Agency
- The healthcare sector is significantly driving this demand as hospitals and medical device manufacturers seek materials with minimal leaching and toxicity. Non-phthalate plasticizers are increasingly used in medical tubing, IV bags, and disposable devices to enhance patient safety
- Consumer goods manufacturers are also transitioning toward safer plasticizers to meet growing consumer expectations for non-toxic household and personal products. This shift is influencing large-scale adoption in toys, furnishings, and everyday plastic items
- Overall, the expanding requirement for non-toxic materials across regulated and consumer-facing industries is positioning non-phthalate plasticizers as essential components in modern polymer formulations
Restraint/Challenge
“High Production Costs and Limited Availability of Raw Materials”
- The North America Non-Phthalate Plasticizers Market faces challenges related to high production costs and limited availability of suitable raw materials, which can restrict large-scale adoption in cost-sensitive applications. Producing advanced non-phthalate formulations often requires specialized feedstocks and complex processing techniques
- For instance, Evonik Industries relies on high-purity alcohols and specialty intermediates to manufacture its non-phthalate plasticizers, increasing dependency on stable raw material supply chains. Fluctuations in availability and pricing of these inputs can directly impact manufacturing costs
- The reliance on bio-based or specialty raw materials further intensifies cost pressures, as these resources are often subject to agricultural variability and limited sourcing options. This can affect supply consistency and pricing stability for manufacturers
- Strict quality and performance requirements also increase production complexity, requiring advanced processing controls and testing standards. These factors contribute to longer production cycles and higher operational expenses
- The challenge of balancing performance, regulatory compliance, and cost efficiency continues to constrain market expansion in price-sensitive regions. Addressing raw material sourcing and production optimization remains critical for improving affordability and broader adoption of non-phthalate plasticizers
North America Non-Phthalate Plasticizers Market Scope
The market is segmented on the basis of type, PVC compatibility, application, and end-user.
• By Type
On the basis of type, the North America Non-Phthalate Plasticizers Market is segmented into monomeric plasticizers and polymeric plasticizers. The monomeric plasticizers segment dominated the market with the largest revenue share of 55.6% in 2025, driven by their strong plasticizing efficiency and wide usage across flexible PVC applications. Manufacturers prefer monomeric variants due to their cost-effectiveness and ability to deliver desirable softness, durability, and processing performance. These plasticizers are extensively used in flooring, cables, and films where balanced flexibility and mechanical strength are required. Their compatibility with existing PVC formulations further supports large-scale adoption across industrial and consumer applications.
The polymeric plasticizers segment is anticipated to register the fastest growth from 2026 to 2033, supported by rising demand for low-migration and high-performance materials. Polymeric plasticizers offer superior resistance to volatility, extraction, and aging, making them suitable for long-life and high-temperature applications. Increasing regulatory pressure on material safety and durability is accelerating their adoption in automotive, medical, and specialty PVC products.
• By PVC Compatibility
On the basis of PVC compatibility, the market is segmented into primary and secondary plasticizers. The primary plasticizers segment held the dominant market share in 2025, owing to their ability to provide the main plasticizing effect while maintaining strong compatibility with PVC resin. These plasticizers are widely used as the core component in flexible PVC formulations for construction materials, cables, and coated fabrics. Their efficiency in improving elasticity, workability, and long-term performance drives consistent demand. The availability of multiple bio-based and non-toxic primary options further strengthens their market position.
The secondary plasticizers segment is expected to grow at the fastest rate during the forecast period, driven by their increasing use as performance enhancers alongside primary plasticizers. Secondary plasticizers help improve flame resistance, cost optimization, and specific mechanical properties. Growing customization of PVC compounds for niche industrial uses is supporting the rapid expansion of this segment.
• By Application
On the basis of application, the North America Non-Phthalate Plasticizers Market is segmented into flooring and wall coverings, wire and cable, films and sheets, coated fabrics, adhesive and sealants, and others. The flooring and wall coverings segment dominated the market in 2025, supported by high consumption of flexible PVC in residential and commercial construction. Non-phthalate plasticizers are increasingly preferred in this application due to indoor air quality concerns and stricter safety standards. Their ability to provide durability, flexibility, and stain resistance supports large-volume usage. Continuous infrastructure development and renovation activities further sustain demand.
The wire and cable segment is projected to witness the fastest growth from 2026 to 2033, driven by expanding power transmission, telecommunications, and renewable energy installations. Non-phthalate plasticizers improve insulation performance, heat resistance, and safety compliance in cables. Rising investments in smart grids and electric vehicles are further accelerating growth in this application.
• By End-User
On the basis of end-user, the market is segmented into building and construction, automotive, consumer goods, sports and leisure, healthcare, electrical and electronics, food and beverages, and others. The building and construction segment accounted for the largest market share in 2025, driven by extensive use of flexible PVC products in flooring, roofing membranes, pipes, and wall coverings. Non-phthalate plasticizers are increasingly adopted to meet green building standards and regulatory requirements. Their long service life and performance stability support widespread usage across large-scale projects.
The healthcare segment is expected to register the fastest growth over the forecast period, supported by rising demand for safe and biocompatible medical products. Non-phthalate plasticizers are preferred in medical tubing, blood bags, and disposable devices due to low toxicity and reduced leaching risks. Growing healthcare expenditure and stricter material safety regulations are accelerating adoption across medical applications.
North America Non-Phthalate Plasticizers Market Regional Analysis
- U.S. dominated the North America Non-Phthalate Plasticizers Market with the largest revenue share in 2025, driven by stringent regulatory frameworks on chemical safety, high adoption of sustainable materials, and strong demand from construction, healthcare, and consumer goods industries
- Robust environmental regulations enforced by agencies such as the U.S. Environmental Protection Agency, along with continuous investments in advanced polymer research and sustainable manufacturing, encourage widespread adoption of non-phthalate plasticizers. The strong presence of leading chemical manufacturers, ongoing product innovation, and long-term supply agreements with downstream PVC processors further reinforce the country’s leadership position in the regional market
- Rising focus on low-toxicity materials, compliance with food-contact and medical-grade standards, and increasing use of non-phthalate plasticizers in flexible PVC applications ensure that the U.S. maintains its dominant role throughout the forecast period
Canada North America Non-Phthalate Plasticizers Market Insight
Canada is projected to register the fastest CAGR in the North America Non-Phthalate Plasticizers Market from 2026 to 2033, supported by growing emphasis on environmental sustainability, increasing construction activity, and rising adoption of safer materials across consumer and industrial applications. Expanding demand for non-phthalate plasticizers in building materials, wire and cable, and packaging is accelerating market growth. Collaborations between domestic compounders and global chemical companies, along with investments in sustainable material development, are strengthening supply capabilities. Government support for green building standards and chemical safety regulations positions Canada as the fastest-growing market in the region.
Mexico North America Non-Phthalate Plasticizers Market Insight
Mexico is expected to grow steadily from 2026 to 2033, driven by expanding manufacturing activity, increasing exports of PVC-based products, and rising awareness of chemical safety standards. Growth in automotive, construction, and consumer goods manufacturing is supporting consistent demand for non-phthalate plasticizers. Government initiatives to strengthen industrial production, along with gradual alignment with North American environmental regulations, support steady market expansion. The presence of regional plastic compounders and growing partnerships with U.S.-based chemical suppliers contribute to sustained growth across the forecast period.
North America Non-Phthalate Plasticizers Market Share
The non-phthalate plasticizers industry is primarily led by well-established companies, including:
- Plastics Corp (U.S.)
- Harman Corporation (U.S.)
- Evonik Industries AG (Germany)
- Eastman Chemical Company (U.S.)
- DIC CORPORATION (Japan)
- Kao Corporation (Japan)
- LG Chem (South Korea)
- Perstorp (Sweden)
- UPC Technology Corporation (Taiwan)
- Kaifeng Jiuhong Chemical Co., Ltd. (China)
- Henan GO Biotech Co.,Ltd (China)
- Valtris Specialty Chemicals (U.S.)
- Velsicol Chemical LLC (U.S.)
- Ferro Corporation (U.S.)
- Mitsubishi Chemical Corporation (Japan)
Latest Developments in North America Non-Phthalate Plasticizers Market
- In January 2024, Evonik Industries expanded its sustainable chemicals portfolio with the launch of a high-performance non-phthalate plasticizer designed for sensitive applications such as medical tubing and food wraps. This innovation aligns with Evonik’s commitment to environmentally friendly solutions, offering enhanced safety and performance while reducing reliance on traditional phthalates. The new plasticizer ensures low migration and durability, making it ideal for industries requiring stringent material standards
- In January 2024, Perstorp introduced Pevalen Pro 100, a revolutionary non-phthalate plasticizer made from 100% renewable carbon using mass balance principles. This innovation significantly improves the sustainability of flexible PVC applications, reducing the product’s carbon footprint by approximately 80% compared to fossil-based alternatives. Designed to uphold high performance while enhancing environmental impact, Pevalen Pro 100 redefines PVC plasticizing technology. Its development reflects Perstorp’s dedication to sustainable solutions, ensuring durability and efficiency without compromising safety or quality
- In December 2023, South Korea’s Aekyung Chemical acquired a 50% stake in VPCHEM, LG Chem’s Vietnam-based subsidiary specializing in plasticizer production and sales. This strategic move aims to strengthen Aekyung Chemical’s presence in the plasticizers market, including non-phthalate alternatives. With this acquisition, Aekyung Chemical expands its production capacity, positioning itself to meet growing global demand for environmentally friendly plasticizers. The deal enhances its ability to supply sustainable solutions to North American and European markets while maintaining a strong foothold in Asia
- In December 2022, Hanwha Solutions introduced Eco-DEHCH, a phthalate-free plasticizer designed for exceptional heat and cold resistance, making it ideal for outdoor applications. This innovation aligns with Hanwha Solutions’ commitment to sustainable materials, offering an eco-friendly alternative to traditional plasticizers. By expanding its product range, the company aims to meet growing global demand for safer, high-performance plasticizers. Eco-DEHCH is recognized for its durability and environmental benefits, reinforcing Hanwha’s position in the market
- In April 2021, Eastman Chemical Company acquired 3F Feed & Food, a European leader in additives for animal feed and human food. This strategic acquisition strengthens Eastman’s animal nutrition business, integrating 3F’s expertise into its Additives & Functional Products segment. The move enhances Eastman’s ability to develop next-generation solutions, supporting global sustainability trends and improving farm productivity. With 3F’s organic acid derivatives and phytogenics, Eastman expands its portfolio to meet growing demand for safer, high-performance additives
SKU-

- Interactive Data Analysis Dashboard
- Company Analysis Dashboard for high growth potential opportunities
- Research Analyst Access for customization & queries
- Competitor Analysis with Interactive dashboard
- Latest News, Updates & Trend analysis
- Harness the Power of Benchmark Analysis for Comprehensive Competitor Tracking
North America Non Phthalate Plasticizers Market, Supply Chain Analysis and Ecosystem Framework
To support market growth and help clients navigate the impact of geopolitical shifts, DBMR has integrated in-depth supply chain analysis into its North America Non Phthalate Plasticizers Market research reports. This addition empowers clients to respond effectively to global changes affecting their industries. The supply chain analysis section includes detailed insights such as North America Non Phthalate Plasticizers Market consumption and production by country, price trend analysis, the impact of tariffs and geopolitical developments, and import and export trends by country and HSN code. It also highlights major suppliers with data on production capacity and company profiles, as well as key importers and exporters. In addition to research, DBMR offers specialized supply chain consulting services backed by over a decade of experience, providing solutions like supplier discovery, supplier risk assessment, price trend analysis, impact evaluation of inflation and trade route changes, and comprehensive market trend analysis.
Data collection and base year analysis are done using data collection modules with large sample sizes. The stage includes obtaining market information or related data through various sources and strategies. It includes examining and planning all the data acquired from the past in advance. It likewise envelops the examination of information inconsistencies seen across different information sources. The market data is analysed and estimated using market statistical and coherent models. Also, market share analysis and key trend analysis are the major success factors in the market report. To know more, please request an analyst call or drop down your inquiry.
The key research methodology used by DBMR research team is data triangulation which involves data mining, analysis of the impact of data variables on the market and primary (industry expert) validation. Data models include Vendor Positioning Grid, Market Time Line Analysis, Market Overview and Guide, Company Positioning Grid, Patent Analysis, Pricing Analysis, Company Market Share Analysis, Standards of Measurement, Global versus Regional and Vendor Share Analysis. To know more about the research methodology, drop in an inquiry to speak to our industry experts.
Data Bridge Market Research is a leader in advanced formative research. We take pride in servicing our existing and new customers with data and analysis that match and suits their goal. The report can be customized to include price trend analysis of target brands understanding the market for additional countries (ask for the list of countries), clinical trial results data, literature review, refurbished market and product base analysis. Market analysis of target competitors can be analyzed from technology-based analysis to market portfolio strategies. We can add as many competitors that you require data about in the format and data style you are looking for. Our team of analysts can also provide you data in crude raw excel files pivot tables (Fact book) or can assist you in creating presentations from the data sets available in the report.


