
North America Non Radiographic Axial Spondyloarthritis Therapeutics Market
Market Size in USD Billion
 USD
3.01 Billion
USD
5.09 Billion
2025
2033
USD
3.01 Billion
USD
5.09 Billion
2025
2033
| 2026 - 2033 | |
| USD 3.01 Billion | |
| USD 5.09 Billion | |
| % | |
|
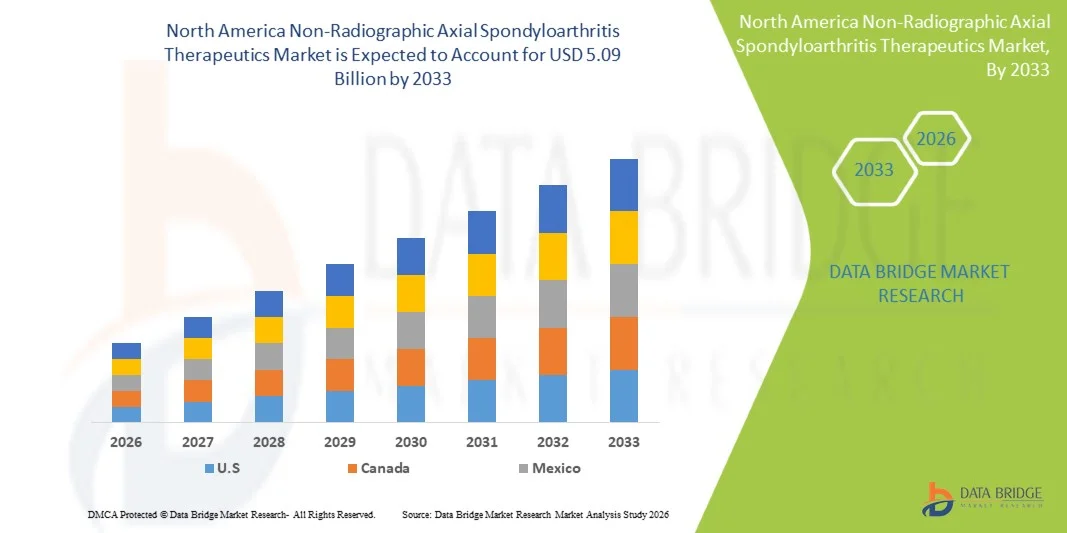
North America Non-Radiographic Axial Spondyloarthritis Therapeutics Market Size
- The North America non-radiographic axial spondyloarthritis therapeutics market size was valued at USD 3.01 Billion in 2025and is expected to reach USD 5.09 Billion by 2033, at a CAGR of 6.9% during the forecast period
- The market growth is primarily driven by the rising prevalence and improved diagnosis of non-radiographic axial spondyloarthritis, supported by increased awareness among clinicians and patients. Advances in imaging techniques such as MRI have enabled earlier detection of inflammatory back pain, expanding the diagnosed patient pool eligible for treatment.
- Strong expansion of biologic and targeted therapies is significantly accelerating market development. The increasing adoption of TNF inhibitors, IL-17 inhibitors, and emerging JAK inhibitors has improved treatment outcomes, particularly for patients who do not respond adequately to conventional NSAIDs.
North America Non-Radiographic Axial Spondyloarthritis Therapeutics Market Analysis
- The North America Non-Radiographic Axial Spondyloarthritis Therapeutics market is experiencing steady expansion driven by the rising prevalence of inflammatory spine disorders and the growing need for effective long-term disease management across key healthcare systems such as the U.S. and Canada. Increasing patient awareness, improved diagnostic capabilities, and higher adoption of advanced biologic therapies are further supporting market growth.
- The U.S. accounts for approximately 79.95% market share in 2025 and is projected to register a CAGR of 6.8%, supported by strong reimbursement frameworks, widespread availability of rheumatology specialists, and increasing utilization of advanced treatment options such as TNF inhibitors, IL-17 inhibitors, and JAK inhibitors for early and sustained disease control.
- The Mexico is the fastest-growing region in the North America Non-Radiographic Axial Spondyloarthritis Therapeutics Market, driven by its high disease awareness, large patient pool with autoimmune disorders, and strong presence of advanced healthcare infrastructure.
- Market growth is fueled by increasing healthcare initiatives for early diagnosis and chronic disease management, expansion of specialty rheumatology care, and rising investments in biologic drug development. Growing adoption of mass screening programs, improved access to advanced therapeutics, and continuous clinical research are playing a key role in enhancing patient outcomes and disease control.
- In 2025, the Medication segment dominate the market with a 78.66% share, reflecting strong demand for biologic therapies and targeted treatment options such as TNF inhibitors, IL-17 inhibitors, and JAK inhibitors. These medications play a critical role in reducing inflammation, slowing disease progression, and improving long-term functional outcomes in non-radiographic axial spondyloarthritis care.
Report Scope and Non-Radiographic Axial Spondyloarthritis Therapeutics Market Segmentation
|
Attributes |
Non-Radiographic Axial Spondyloarthritis Therapeutics Market Key Market Insights |
|
Segments Covered |
• By Treatment Type: Medication, Surgery, Physical Therapy and Others
|
|
Countries Covered |
North America · U.S. · Canada · Mexico |
|
Key Market Players |
· Novartis AG (Switzerland) · Pfizer Inc. (U.S.) · AbbVie Inc. (U.S.) · UCB Group (Belgium) · Eli Lilly and Company (U.S.) · Biogen (U.S.) · Johnson & Johnson (U.S.) · Amgen Inc. (U.S.) · Bristol-Myers Squibb (U.S.) · Merck KGaA (Germany) · Sanofi (France) · F. Hoffmann-La Roche Ltd (Switzerland) · Boehringer Ingelheim (Germany) · Astellas Pharma Inc. (Japan) · Gedeon Richter Plc. (Hungary) · Sun Pharmaceutical Industries Ltd (India) · Lupin Limited (India) · Dr. Reddy’s Laboratories Limited (India) · Teva Pharmaceutical Industries Ltd (Israel) · Zydus Group (India) · Viatris Inc. (U.S.) · Fresenius Kabi (Germany) · Kyowa Kirin Co., Ltd (Japan) · Celltrion Inc. (South Korea) · Torrent Pharmaceuticals Ltd (India) · Samsung Bioepis (South Korea) · Alkem Laboratories (India) · Cipla (India) · Sandoz (Switzerland) · Takeda Pharmaceutical Company Limited (Japan) · Biocad (Russia) |
|
Market Opportunities |
· Development of targeted therapies and novel biologics with improved efficacy and safety profiles · Expansion of biosimilars market reducing treatment costs and improving accessibility · Growing focus on personalized medicine and precision therapeutics |
|
Value Added Data Infosets |
In addition to the market insights such as market value, growth rate, market segments, geographical coverage, market players, and market scenario, the market report curated by the Data Bridge Market Research team includes in-depth expert analysis, import/export analysis, pricing analysis, production consumption analysis, and pestle analysis. |
North America Non-Radiographic Axial Spondyloarthritis Therapeutics MarketTrends
“Rising demand for advanced and targeted therapeutic solutions for inflammatory spine disorders”
- The demand for advanced therapeutic options for non-radiographic axial spondyloarthritis is increasing North Americaly as patients, physicians, and healthcare systems seek more effective long-term disease control beyond conventional NSAIDs. The introduction and growing adoption of biologics, including TNF inhibitors and IL-17 inhibitors, along with targeted synthetic DMARDs, is significantly improving pain management, inflammation control, and overall quality of life in patients with nr-axSpA.
- Factors such as rising disease awareness, improved diagnostic capabilities (including MRI-based detection of early sacroiliitis), evolving clinical guidelines, and increasing recognition of axial spondyloarthritis as a spectrum disorder are driving earlier diagnosis and wider treatment adoption across both developed and emerging healthcare markets.
- As patients with nr-axSpA face chronic pain, mobility limitations, and risk of disease progression, the demand for long-term, safe, and effective treatment regimens has grown substantially. This has encouraged the use of advanced biologic therapies that not only reduce symptoms but also help prevent structural damage and improve functional outcomes.
- Increasing burden of autoimmune and inflammatory diseases, along with genetic predisposition factors such as HLA-B27 association, is contributing to a growing patient pool requiring continuous management. Coupled with delayed diagnosis in many regions, this is further increasing the need for advanced and accessible therapeutic options.
- Additionally, the growing adoption of biosimilars and next-generation biologic therapies represents a major opportunity for the North America nr-axSpA Therapeutics Market. As healthcare systems aim to improve affordability and expand patient access to high-cost biologics, the availability of cost-effective biosimilars, combined with advancements in precision medicine and immunology research, is expected to further accelerate market growth
North America Non-Radiographic Axial Spondyloarthritis Therapeutics Market trends
Driver
“Increasing prevalence of non-radiographic axial spondyloarthritis and improved disease awareness”
- The expansion of the North America Non-Radiographic Axial Spondyloarthritis (nr-axSpA) Therapeutics Market is strongly driven by the increasing recognition of disease prevalence and a substantial rise in awareness among healthcare providers and patients.
- Historically underdiagnosed due to the absence of definitive radiographic damage, nr-axSpA is now being increasingly identified through improved clinical classification frameworks and the broader adoption of advanced imaging techniques. International rheumatology bodies and public health organizations have intensified efforts to promote early identification of inflammatory back pain and axial spondyloarthritis spectrum disorders, thereby reducing diagnostic delays.
- Concurrently, patient advocacy initiatives and educational campaigns have enhanced disease visibility, encouraging earlier healthcare-seeking behavior and physician intervention. These developments are expanding the diagnosed patient pool and accelerating the uptake of targeted therapies, positioning disease awareness and prevalence growth as a fundamental driver of market demand.
- In May 2023, the European Alliance of Associations for Rheumatology highlighted new research and clinical insights on axial spondyloarthritis at its annual congress, emphasizing improved disease understanding and the importance of early identification strategies, which support increased diagnosis of non-radiographic cases.
- In 2023, the Assessment of SpondyloArthritis international Society in collaboration with EULAR released updated management recommendations for axial spondyloarthritis, reinforcing structured diagnostic and treatment pathways that enhance early detection and awareness among clinicians.
- Rising disease awareness, improved diagnostic pathways, and increasing recognition of nr-axSpA prevalence are expanding the diagnosed patient population and driving earlier therapeutic intervention.
- Continued efforts by rheumatology organizations to promote early detection and standardized disease management are expected to support sustained growth in the Global Non-Radiographic Axial Spondyloarthritis (nr-axSpA) Therapeutics Market.
Restraint/Challenge
“High cost of biologic therapies limiting patient access in low- and middle-income regions”
- The North America Non-Radiographic Axial Spondyloarthritis (nr-axSpA) Therapeutics Market is significantly constrained by the high cost of biologic therapies, which continues to limit patient access, particularly across low- and middle-income regions. Biologic agents, including tumor necrosis factor inhibitors and interleukin-17 inhibitors, involve complex development and manufacturing processes that contribute to elevated pricing structures.
- This cost burden poses a substantial challenge for healthcare systems with limited financial resources and for patients lacking comprehensive reimbursement coverage. In many emerging economies, constrained healthcare budgets and fragmented insurance frameworks further restrict access to these advanced therapies, resulting in delayed treatment initiation and suboptimal disease management.
- Despite their proven clinical efficacy, affordability barriers remain a critical impediment to widespread adoption, thereby moderating the overall growth potential of the nr-axSpA therapeutics market.
- In February 2025, the World Health Organization reported that biologic medicines, although highly effective for chronic diseases, remain inaccessible to many patients North Americaly due to their high costs, particularly in low- and middle-income countries with constrained healthcare budgets.
- In November 2024, the Access to Medicine Foundation highlighted that significant gaps persist in access to essential medicines in low-income countries, noting that affordability and limited coverage of advanced therapies continue to restrict patient reach despite industry initiatives
- The high cost of biologic therapies and limited reimbursement coverage continue to restrict patient access, particularly in emerging and resource-constrained healthcare markets, thereby hindering treatment adoption.
- Persistent affordability challenges and disparities in healthcare funding are expected to remain key barriers to the widespread utilization of advanced nr-axSpA therapies, moderating overall market growth.
North America Non-Radiographic Axial Spondyloarthritis Therapeutics Market Scope
North America Non-Radiographic Axial Spondyloarthritis Therapeutics Market is categorized into five notable segments which are based on treatment type, drug, route of administration, end user, and distribution channel.
- By Treatment Type
On the basis of treatment type, the North America Non-Radiographic Axial Spondyloarthritis Therapeutics Market is segmented into Medication, Surgery, Physical Therapy, and Others. In 2026, Medication is anticipated to dominate the market with 78.78% market share, driven by its critical role in providing first-line disease control, reducing inflammation, managing chronic pain, and its widespread use of biologics and targeted DMARD therapies as standard care for nr-axSpA patients.
The Medication segment in the market is expected to grow the fastest with a CAGR of 7.1% from 2026 to 2033, supported by increasing adoption of biologic therapies such as TNF and IL-17 inhibitors, rising diagnosis rates, and continuous advancements in targeted treatment options that improve long-term patient outcomes and delay disease progression.
- By drug type
On the basis of drug type, the North America Non-Radiographic Axial Spondyloarthritis Therapeutics Market is segmented into Adalimumab, Secukinumab, Etanercept, Ixekizumab, Upadacitinib, Certolizumab Pegol, Golimumab, Infliximab, Tofacitinib, and Others. In 2026, Adalimumab is anticipated to dominate the market with 27.38% market share, driven by its strong clinical efficacy, widespread physician preference as a first-line biologic TNF inhibitor, and extensive real-world evidence supporting its long-term effectiveness in reducing inflammation and disease progression in nr-axSpA patients.
The Upadacitinib segment in the market is expected to grow the fastest with a CAGR of 8.3% from 2026 to 2033, driven by increasing adoption of oral targeted synthetic DMARDs, strong efficacy in JAK pathway inhibition, improved patient convenience compared to injectable biologics, and rising preference for advanced therapies offering rapid symptom relief and flexible administration.
- By Route of Administration
On the basis of route of administration, the North America Non-Radiographic Axial Spondyloarthritis Therapeutics Market is segmented into Subcutaneous, Oral, Intravenous, and Others. In 2026, the Subcutaneous segment is anticipated to dominate the market with 47.94% market share, driven by its widespread use in biologic therapies, improved patient compliance through self-administration, and its effectiveness in delivering long-acting targeted treatments for chronic inflammatory conditions like nr-axSpA.
The Oral segment in the market is expected to grow the fastest with a CAGR of 8.0% from 2026 to 2033, supported by increasing adoption of oral targeted synthetic DMARDs such as JAK inhibitors, growing patient preference for non-invasive treatment options, and advancements in oral drug formulations that offer greater convenience, faster onset of action, and improved long-term adherence.
- By End User
On the basis of end user, the North America Non-Radiographic Axial Spondyloarthritis Therapeutics Market is segmented into Specialty Clinics, Homecare, Hospitals, Pharmacy & Retailers, and Others. In 2026, Specialty Clinics are anticipated to dominate the market with 31.83% market share, driven by the growing preference for specialized rheumatology care, improved access to expert diagnosis and biologic therapy management, and the rising role of these clinics in providing targeted, long-term treatment for chronic inflammatory conditions like nr-axSpA.
The Homecare segment in the market is expected to grow the fastest with a CAGR of 7.7% from 2026 to 2033, supported by increasing adoption of self-administered biologic therapies, rising demand for patient-centric and convenient treatment settings, and advancements in home-based monitoring and telehealth services that enable continuous disease management outside traditional healthcare facilities.
- By Distribution Channel
On the basis of distribution channel, the North America Non-Radiographic Axial Spondyloarthritis Therapeutics Market is segmented into Hospital Pharmacy, Retail Pharmacy, Direct Tender, Online Pharmacy, and Others. In 2026, the Hospital Pharmacy segment is anticipated to dominate the market with 35.63% market share, driven by the high reliance on hospital-based dispensing for biologics and advanced therapies, physician-led treatment initiation, and the strong role of hospitals in managing moderate to severe nr-axSpA cases requiring specialized care and monitoring.
The Online Pharmacy segment in the market is expected to grow the fastest with a CAGR of 7.4% from 2026 to 2033, supported by increasing digitalization of healthcare services, rising adoption of e-pharmacy platforms for medication access, improved convenience for chronic disease patients requiring long-term therapy, and growing integration of telemedicine with prescription fulfillment systems.
North America Non-Radiographic Axial Spondyloarthritis Therapeutics Market Country Analysis
- In 2026, the U.S. is expected to hold the largest share of the North America Non-Radiographic Axial Spondyloarthritis Therapeutics Market, accounting for 79.80% of regional demand. With a projected CAGR of 6.7%, growth is driven by rising prevalence of autoimmune and inflammatory spine disorders, increasing adoption of advanced biologic therapies, expanding access to rheumatology specialists, and strong clinical infrastructure supporting early diagnosis and long-term disease management.
- The region benefits from advanced healthcare systems, supportive reimbursement policies, and increasing investments in biologic drug development and clinical research. Expanding applications of targeted therapies such as TNF inhibitors, IL-17 inhibitors, and JAK inhibitors, along with growing emphasis on precision medicine and early intervention strategies, continue to drive market penetration and sustained long-term growth.
U.S. Non-Radiographic Axial Spondyloarthritis Therapeutics Market Insight
The U.S. Non-Radiographic Axial Spondyloarthritis Therapeutics Market holds the largest share of 79.95% within North America, driven by strong disease awareness, early diagnostic adoption, and a highly developed rheumatology care ecosystem. Widespread use of biologic therapies and targeted synthetic DMARDs, along with robust clinical trial activity and strong pharmaceutical presence, is significantly accelerating treatment uptake. Healthcare providers increasingly rely on advanced therapies such as TNF inhibitors, IL-17 inhibitors, and JAK inhibitors to manage disease progression, improve patient mobility, and enhance long-term outcomes.
Canada Non-Radiographic Axial Spondyloarthritis Therapeutics Market Insight
The Canada Non-Radiographic Axial Spondyloarthritis Therapeutics Market is projected to witness the fastest growth within North America, driven by rising awareness of autoimmune diseases, improving access to specialist care, and increasing adoption of advanced biologic and biosimilar therapies. Growing investments in healthcare infrastructure, expanding rheumatology services, and increasing focus on early diagnosis and chronic disease management are further supporting market expansion. In addition, government-backed healthcare initiatives, rising patient access to specialty medications, and continuous improvements in treatment guidelines are accelerating the adoption of innovative therapeutic options across the country.
Non-Radiographic Axial Spondyloarthritis Therapeutics Market Share
The non-radiographic axial spondyloarthritis therapeutics market is primarily led by well-established companies, including:
- Novartis AG (Switzerland)
- Pfizer Inc. (U.S.)
- AbbVie Inc. (U.S.)
- UCB Group (Belgium)
- Eli Lilly and Company (U.S.)
- Biogen (U.S.)
- Johnson & Johnson (U.S.)
- Amgen Inc. (U.S.)
- Bristol-Myers Squibb (U.S.)
- Merck KGaA (Germany)
- Sanofi (France)
- Hoffmann-La Roche Ltd (Switzerland)
- Boehringer Ingelheim (Germany)
- Astellas Pharma Inc. (Japan)
- Gedeon Richter Plc. (Hungary)
- Sun Pharmaceutical Industries Ltd (India)
- Lupin Limited (India)
- Reddy’s Laboratories Limited (India)
- Teva Pharmaceutical Industries Ltd (Israel)
- Zydus Group (India)
- Viatris Inc. (U.S.)
- Fresenius Kabi (Germany)
- Kyowa Kirin Co., Ltd (Japan)
- Celltrion Inc. (South Korea)
- Torrent Pharmaceuticals Ltd (India)
- Samsung Bioepis (South Korea)
- Alkem Laboratories (India)
- Cipla (India)
- Sandoz (Switzerland)
- Takeda Pharmaceutical Company Limited (Japan)
- Biocad (Russia)
Latest Developments in North America Non-Radiographic Axial Spondyloarthritis Therapeutics Market
- In April 2026 – The company received European Commission approval for Rhapsido, the first oral targeted treatment for chronic spontaneous urticaria, marking a major dermatology innovation.
- In November 2025, Pfizer shareholders approved the acquisition of Metsera, giving Pfizer access to a pipeline of 2026 Acquisition next-generation obesity and cardiometabolic therapies. This strengthens its long term growth by diversifying beyond declining COVID related revenues and addressing upcoming patent expiries The deal is expected to boost Pfizer’s competitive position in the rapidly expanding North America obesity drug market (projected to reach ~$150B), intensifying competition with players like Novo Nordisk and Eli Lilly while potentially driving future revenue and market share gains if pipeline drugs succeed.
- In April 2026 – AbbVie announced an update on its Biologics License Application (BLA) for TrenibotulinumtoxinE (TrenibotE) in the U.S. The FDA issued a Complete Response Letter due to manufacturing-related issues, but did not raise concerns about safety or effectiveness. AbbVie stated it will address the FDA’s feedback and resubmit the application for review.
- In April 2026: UCB partnered with a UK university to develop “digital antibodies” using artificial intelligence, aiming to 2026 2025 Partnership Expansion accelerate drug discovery and improve treatment precision. This collaboration reflects the company’s growing focus on advanced technologies in biopharma innovation.
- In April 2026 – Eli Lilly announced the acquisition of Ajax Therapeutics for up to $2.3 billion, strengthening its oncology pipeline with a novel treatment for blood cancer (myelofibrosis)
SKU-

- Interactive Data Analysis Dashboard
- Company Analysis Dashboard for high growth potential opportunities
- Research Analyst Access for customization & queries
- Competitor Analysis with Interactive dashboard
- Latest News, Updates & Trend analysis
- Harness the Power of Benchmark Analysis for Comprehensive Competitor Tracking
Table of Content
1 INTRODUCTION
1.1 OBJECTIVES OF THE STUDY
1.2 MARKET DEFINITION
1.3 OVERVIEW OF NORTH AMERICA NON-RADIOGRAPHIC AXIAL SPONDYLOARTHRITIS THERAPEUTICS MARKET
1.4 LIMITATIONS
1.5 MARKETS COVERED
2 MARKET SEGMENTATION
2.1 MARKETS COVERED
2.2 GEOGRAPHICAL SCOPE
2.3 YEARS CONSIDERED FOR THE STUDY
2.4 CURRENCY AND PRICING
2.5 DBMR TRIPOD DATA VALIDATION MODEL
2.6 MULTIVARIATE MODELLING
2.7 PRIMARY INTERVIEWS WITH KEY OPINION LEADERS
2.8 DBMR MARKET POSITION GRID
2.9 MARKET END USER COVERAGE GRID
2.1 VENDOR SHARE ANALYSIS
2.11 SECONDARY SOURCES
2.12 ASSUMPTIONS
3 EXECUTIVE SUMMARY
4 PREMIUM INSIGHTS
4.1 PORTER’S FIVE FORCES
4.1.1 THREAT OF NEW ENTRANTS
4.1.2 THREAT OF SUBSTITUTES
4.1.3 BARGAINING POWER OF BUYERS
4.1.4 BARGAINING POWER OF SUPPLIERS
4.1.5 INDUSTRY RIVALRY
4.2 BRAND OUTLOOK
4.3 COST ANALYSIS BREAKDOWN
4.3.1 DRUG ACQUISITION COSTS AND PRICING DYNAMICS
4.3.2 MANUFACTURING AND BIOLOGICS PRODUCTION COSTS
4.3.3 RESEARCH AND DEVELOPMENT EXPENDITURE
4.3.4 DISTRIBUTION, LOGISTICS, AND COLD CHAIN MANAGEMENT
4.3.5 ADMINISTRATION AND HEALTHCARE SYSTEM COSTS
4.3.6 IMPACT OF BIOSIMILARS AND COMPETITIVE PRICING
4.3.7 REIMBURSEMENT FRAMEWORKS AND PATIENT ACCESS
4.3.8 MARKET DEVELOPMENTS INFLUENCING COST STRUCTURES
4.3.9 CONCLUSION
4.4 INDUSTRY ECOSYSTEM ANALYSIS
4.4.1 OVERVIEW OF THE INDUSTRY ECOSYSTEM STRUCTURE
4.4.2 DRUG DISCOVERY AND TRANSLATIONAL RESEARCH ECOSYSTEM
4.4.3 CLINICAL DEVELOPMENT AND TRIAL INFRASTRUCTURE
4.4.4 MANUFACTURING AND BIOPHARMACEUTICAL SUPPLY CHAIN ECOSYSTEM
4.4.5 REGULATORY AND HEALTH AUTHORITY ECOSYSTEM
4.4.6 HEALTHCARE DELIVERY AND PRESCRIBING ECOSYSTEM
4.4.7 DISTRIBUTION AND PHARMACEUTICAL ACCESS CHANNELS
4.4.8 PATIENT ADVOCACY AND DISEASE AWARENESS ECOSYSTEM
4.4.9 PRICING AND MARKET ACCESS ECOSYSTEM
4.5 INNOVATION TRACKER AND STRATEGIC ANALYSIS
4.5.1 MAJOR DEALS AND STRATEGIC ALLIANCES ANALYSIS
4.5.1.1 JOINT VENTURES
4.5.1.2 MERGERS AND ACQUISITIONS
4.5.1.3 LICENSING AND PARTNERSHIP
4.5.1.4 TECHNOLOGY COLLABORATIONS
4.5.1.5 STRATEGIC DIVESTMENTS
4.5.2 NUMBER OF PRODUCTS IN DEVELOPMENT
4.5.3 STAGE OF DEVELOPMENT
4.5.4 TIMELINES AND MILESTONES
4.5.5 INNOVATION STRATEGIES AND METHODOLOGIES
4.5.6 RISK ASSESSMENT AND MITIGATION
4.5.7 FUTURE OUTLOOK
4.6 PATENT ANALYSIS
4.6.1 PATENT QUALITY AND STRENGTH
4.6.2 COUNTRY PATENT LANDSCAPE.
4.6.3 IP STRATEGY AND MANAGEMENT
4.6.4 LICENSING AND COLLABORATION
4.7 PRICING ANALYSIS
4.7.1 PREMIUM PRICING STRUCTURE DOMINATED BY BIOLOGICS AND TARGETED THERAPIES
4.7.2 BIOLOGICS AS THE KEY REVENUE AND PRICE REALIZATION SEGMENT
4.7.3 LOW-COST VOLUME SEGMENT LED BY NSAIDS AND CONVENTIONAL THERAPIES
4.7.4 REGIONAL PRICING DISPARITY ACROSS NORTH AMERICA MARKETS
4.7.5 BIOSIMILARS DRIVING DOWNWARD PRICE CORRECTION
4.7.6 HEALTH ECONOMIC BURDEN AND PAYER-DRIVEN PRICING PRESSURE
4.8 PROFIT MARGINS SCENARIO
4.8.1 OVERVIEW OF PROFIT MARGIN DYNAMICS
4.8.2 REVENUE STRUCTURE AND PRICING POWER IN BIOLOGIC THERAPIES
4.8.3 COST STRUCTURE AND MANUFACTURING ECONOMICS
4.8.4 IMPACT OF BIOSIMILARS AND COMPETITIVE EROSION
4.8.5 REGIONAL REIMBURSEMENT AND MARKET ACCESS INFLUENCE
4.8.6 PIPELINE INNOVATION AND MARGIN EXPANSION POTENTIAL
4.8.7 REGULATORY APPROVALS AND MARKET EXPANSION CONTEXT
4.8.8 COMPETITIVE AND CLINICAL ADOPTION DYNAMICS
4.8.9 INNOVATION-DRIVEN MARGIN SUSTAINABILITY
4.8.10 CONCLUSION
4.9 RAW MATERIAL COVERAGE
4.9.1 OVERVIEW OF RAW MATERIAL LANDSCAPE
4.9.2 BIOLOGIC ACTIVE INGREDIENT PRODUCTION INPUTS
4.9.3 CELL CULTURE MEDIA AND UPSTREAM PROCESSING MATERIALS
4.9.4 CHROMATOGRAPHY AND PURIFICATION MATERIALS
4.9.5 FORMULATION EXCIPIENTS AND STABILIZATION AGENTS
4.9.6 PRIMARY PACKAGING MATERIALS
4.9.7 SECONDARY PACKAGING AND COLD CHAIN LOGISTICS MATERIALS
4.9.8 QUALITY STANDARDS AND REGULATORY MATERIAL COMPLIANCE
4.9.9 SUPPLY CHAIN CONSTRAINTS AND RISK FACTORS
4.9.10 EMERGING TRENDS IN RAW MATERIAL INNOVATION
4.1 TECHNOLOGICAL ADVANCEMENTS
4.10.1 EVOLUTION OF TARGETED BIOLOGIC THERAPIES
4.10.2 EMERGENCE OF IL-17 INHIBITORS AND NOVEL MECHANISTIC PATHWAYS
4.10.3 ADVANCEMENT OF ORAL SMALL MOLECULE THERAPIES
4.10.4 BIOMARKER-DRIVEN DIAGNOSIS AND TREATMENT OPTIMIZATION
4.10.5 DIGITAL HEALTH INTEGRATION AND REMOTE MONITORING
4.10.6 ADVANCES IN DRUG DELIVERY SYSTEMS
4.10.7 ONGOING RESEARCH IN NEXT-GENERATION THERAPEUTICS
4.10.8 INTEGRATION OF PRECISION MEDICINE APPROACHES
4.10.9 CONCLUSION
4.11 VALUE CHAIN ANALYSIS
4.11.1 RAW MATERIALS AND ACTIVE PHARMACEUTICAL INGREDIENTS
4.11.2 DRUG DISCOVERY AND PRECLINICAL DEVELOPMENT
4.11.3 MANUFACTURING AND BIOPROCESSING
4.11.4 PROCESSING, FILL-FINISH AND STERILIZATION
4.11.5 PACKAGING AND LABELING
4.11.6 DISTRIBUTION AND LOGISTICS
4.11.7 CONCLUSION
4.12 VENDOR SELECTION CRITERIA
4.12.1 CLINICAL EFFICACY AND EVIDENCE-BASED DIFFERENTIATION
4.12.2 MECHANISM OF ACTION AND PORTFOLIO BREADTH
4.12.3 REGULATORY COMPLIANCE AND NORTH AMERICA MARKET ACCESS
4.12.4 PRICING STRATEGY AND REIMBURSEMENT LANDSCAPE
4.12.5 MANUFACTURING CAPABILITIES AND SUPPLY CHAIN RELIABILITY
4.12.6 STRATEGIC COLLABORATIONS AND INNOVATION CAPACITY
4.12.7 REAL-WORLD EVIDENCE AND POST-MARKETING SURVEILLANCE
4.12.8 MARKET PRESENCE AND PHYSICIAN ENGAGEMENT
4.12.9 CONCLUSION
5 TARIFFS & IMPACT ON THE MARKET
5.1 CURRENT TARIFF RATE(S) IN TOP-5 COUNTRY MARKETS
5.2 OUTLOOK: LOCAL PRODUCTION VERSUS IMPORT RELIANCE
5.3 VENDOR SELECTION CRITERIA DYNAMICS
5.4 IMPACT ON SUPPLY CHAIN
5.4.1 RAW MATERIAL PROCUREMENT
5.4.2 MANUFACTURING AND PRODUCTION
5.4.3 LOGISTICS AND DISTRIBUTION
5.4.4 PRICE PITCHING AND MARKET POSITION
5.5 INDUSTRY PARTICIPANTS: PROACTIVE MOVES
5.5.1 SUPPLY CHAIN OPTIMIZATION
5.5.2 JOINT VENTURE ESTABLISHMENTS
6 REGULATORY FRAMEWORK AND APPROVAL PATHWAYS
6.1 OVERVIEW
6.2 REGIONAL REGULATORY AND REIMBURSEMENT LANDSCAPES
6.3 PRICING, HEALTH TECHNOLOGY ASSESSMENT AND COVERAGE
6.4 POST-MARKETING SURVEILLANCE AND PHARMACOVIGILANCE
7 MARKET OVERVIEW
7.1 DRIVER
7.1.1 INCREASING PREVALENCE OF NON-RADIOGRAPHIC AXIAL SPONDYLOARTHRITIS AND IMPROVED DISEASE AWARENESS
7.1.2 GROWING ADOPTION OF BIOLOGICS SUCH AS TNF INHIBITORS AND IL-17 INHIBITORS FOR EARLY-STAGE TREATMENT
7.1.3 ADVANCEMENTS IN DIAGNOSTIC TECHNIQUES ENABLING EARLIER AND MORE ACCURATE DETECTION
7.1.4 RISING HEALTHCARE EXPENDITURE AND IMPROVED ACCESS TO SPECIALTY CARE IN EMERGING MARKETS
7.2 RESTRAINT
7.2.1 HIGH COST OF BIOLOGIC THERAPIES LIMITING PATIENT ACCESS IN LOW- AND MIDDLE-INCOME REGIONS
7.2.2 STRINGENT REGULATORY APPROVAL PROCESSES FOR NOVEL THERAPEUTICS DELAYING MARKET ENTRY
7.3 OPPORTUNITIES
7.3.1 DEVELOPMENT OF TARGETED THERAPIES AND NOVEL BIOLOGICS WITH IMPROVED EFFICACY AND SAFETY PROFILES
7.3.2 EXPANSION OF BIOSIMILARS MARKET REDUCING TREATMENT COSTS AND IMPROVING ACCESSIBILITY
7.3.3 GROWING FOCUS ON PERSONALIZED MEDICINE AND PRECISION THERAPEUTICS
7.4 CHALLENGES
7.4.1 COMPLEXITY IN DISEASE DIAGNOSIS DUE TO LACK OF RADIOGRAPHIC EVIDENCE IN EARLY STAGES
7.4.2 PATIENT ADHERENCE ISSUES DUE TO CHRONIC NATURE OF TREATMENT
8 NORTH AMERICA NON-RADIOGRAPHIC AXIAL SPONDYLOARTHRITIS THERAPEUTICS MARKET, BY TREATMENT TYPE
8.1 OVERVIEW
8.2 NORTH AMERICA NON-RADIOGRAPHIC AXIAL SPONDYLOARTHRITIS THERAPEUTICS MARKET, BY REGION, 2018-2033 (USD THOUSAND)
8.2.1 NORTH AMERICA
8.2.2 EUROPE
8.2.3 ASIA-PACIFIC
8.2.4 SOUTH AMERICA
8.2.5 MIDDLE EAST & AFRICA
8.3 NORTH AMERICA NON-RADIOGRAPHIC AXIAL SPONDYLOARTHRITIS THERAPEUTICS MARKET, BY TREATMENT TYPE, 2018-2033 (USD THOUSAND)
8.3.1 MEDICATION
8.3.2 SURGERY
8.3.3 PHYSICAL THERAPY
8.3.4 OTHERS
8.4 NORTH AMERICA MEDICATION IN NON-RADIOGRAPHIC AXIAL SPONDYLOARTHRITIS THERAPEUTICS MARKET, BY TYPE, 2018-2033 (USD THOUSAND)
8.4.1 BIOLOGICS
8.4.2 NSAIDS
8.4.3 ANALGESICS
8.4.4 DISEASE-MODIFYING ANTIRHEUMATIC DRUGS (DMARDS)
8.4.5 OTHERS
8.5 NORTH AMERICA BIOLOGICS IN NON-RADIOGRAPHIC AXIAL SPONDYLOARTHRITIS THERAPEUTICS MARKET, BY TYPE, 2018-2033 (USD THOUSAND)
8.5.1 TNF INHIBITORS
8.5.2 INTERLEUKIN (IL-17) INHIBITORS
8.5.3 JAK INHIBITORS
8.5.4 OTHERS
8.6 NORTH AMERICA TNF INHIBITORS IN NON-RADIOGRAPHIC AXIAL SPONDYLOARTHRITIS THERAPEUTICS MARKET, BY TYPE, 2018-2033 (USD THOUSAND)
8.6.1 ADALIMUMAB
8.6.2 ETANERCEPT
8.6.3 CERTOLIZUMAB PEGOL
8.6.4 INFLIXIMAB
8.6.5 OTHERS
8.7 NORTH AMERICA INTERLEUKIN (IL-17) INHIBITORS IN NON-RADIOGRAPHIC AXIAL SPONDYLOARTHRITIS THERAPEUTICS MARKET, BY TYPE, 2018-2033 (USD THOUSAND)
8.7.1 SECUKINUMAB
8.7.2 IXEKIZUMAB
8.7.3 OTHERS
8.8 NORTH AMERICA JAK INHIBITORS IN NON-RADIOGRAPHIC AXIAL SPONDYLOARTHRITIS THERAPEUTICS MARKET, BY TYPE, 2018-2033 (USD THOUSAND)
8.8.1 UPADACITINIB
8.8.2 TOFACITINIB
8.8.3 OTHERS
8.9 NORTH AMERICA NSAIDS IN NON-RADIOGRAPHIC AXIAL SPONDYLOARTHRITIS THERAPEUTICS MARKET, BY TYPE, 2018-2033 (USD THOUSAND)
8.9.1 TRADITIONAL NSAIDS
8.9.2 SELECTIVE COX-2 INHIBITORS
8.9.3 OTHERS
8.1 NORTH AMERICA MEDICATION IN NON-RADIOGRAPHIC AXIAL SPONDYLOARTHRITIS THERAPEUTICS MARKET, BY REGION, 2018-2033 (USD THOUSAND)
8.10.1 NORTH AMERICA
8.10.2 EUROPE
8.10.3 ASIA-PACIFIC
8.10.4 SOUTH AMERICA
8.10.5 MIDDLE EAST AND AFRICA
8.11 NORTH AMERICA SURGERY IN NON-RADIOGRAPHIC AXIAL SPONDYLOARTHRITIS THERAPEUTICS MARKET, BY TYPE, 2018-2033 (USD THOUSAND)
8.11.1 JOINT REPLACEMENT
8.11.2 SPINAL FUSION
8.11.3 OTHERS
8.12 NORTH AMERICA SURGERY IN NON-RADIOGRAPHIC AXIAL SPONDYLOARTHRITIS THERAPEUTICS MARKET, BY REGION, 2018-2033 (USD THOUSAND)
8.12.1 NORTH AMERICA
8.12.2 EUROPE
8.12.3 ASIA-PACIFIC
8.12.4 SOUTH AMERICA
8.12.5 MIDDLE EAST AND AFRICA
8.13 NORTH AMERICA PHYSICAL THERAPY IN NON-RADIOGRAPHIC AXIAL SPONDYLOARTHRITIS THERAPEUTICS MARKET, BY TYPE, 2018-2033 (USD THOUSAND)
8.13.1 EXERCISE-BASED APPROACHES
8.13.2 HYDROTHERAPY
8.13.3 OTHERS
8.14 NORTH AMERICA PHYSICAL THERAPY IN NON-RADIOGRAPHIC AXIAL SPONDYLOARTHRITIS THERAPEUTICS MARKET, BY REGION, 2018-2033 (USD THOUSAND)
8.14.1 NORTH AMERICA
8.14.2 EUROPE
8.14.3 ASIA-PACIFIC
8.14.4 SOUTH AMERICA
8.14.5 MIDDLE EAST AND AFRICA
8.15 NORTH AMERICA OTHER IN NON-RADIOGRAPHIC AXIAL SPONDYLOARTHRITIS THERAPEUTICS MARKET, BY REGION, 2018-2033 (USD THOUSAND)
8.15.1 NORTH AMERICA
8.15.2 EUROPE
8.15.3 ASIA-PACIFIC
8.15.4 SOUTH AMERICA
8.15.5 MIDDLE EAST AND AFRICA
9 NORTH AMERICA NON-RADIOGRAPHIC AXIAL SPONDYLOARTHRITIS THERAPEUTICS MARKET, BY DRUG
9.1 OVERVIEW
9.2 NORTH AMERICA NON-RADIOGRAPHIC AXIAL SPONDYLOARTHRITIS THERAPEUTICS MARKET, BY DRUG, 2018-2033 (USD THOUSAND)
9.2.1 ADALIMUMAB
9.2.2 SECUKINUMAB
9.2.3 ETANERCEPT
9.2.4 IXEKIZUMAB
9.2.5 UPADACITINIB
9.2.6 CERTOLIZUMAB PEGOL
9.2.7 GOLIMUMAB
9.2.8 INFLIXIMAB
9.2.9 TOFACITINIB
9.2.10 OTHERS
9.3 NORTH AMERICA ADALIMUMAB IN NON-RADIOGRAPHIC AXIAL SPONDYLOARTHRITIS THERAPEUTICS MARKET, BY REGION, 2018-2033 (USD THOUSAND)
9.3.1 NORTH AMERICA
9.3.2 EUROPE
9.3.3 ASIA-PACIFIC
9.3.4 SOUTH AMERICA
9.3.5 MIDDLE EAST AND AFRICA
9.4 NORTH AMERICA SECUKINUMAB IN NON-RADIOGRAPHIC AXIAL SPONDYLOARTHRITIS THERAPEUTICS MARKET, BY REGION, 2018-2033 (USD THOUSAND)
9.4.1 NORTH AMERICA
9.4.2 EUROPE
9.4.3 ASIA-PACIFIC
9.4.4 SOUTH AMERICA
9.4.5 MIDDLE EAST AND AFRICA
9.5 NORTH AMERICA ETANERCEPT IN NON-RADIOGRAPHIC AXIAL SPONDYLOARTHRITIS THERAPEUTICS MARKET, BY REGION, 2018-2033 (USD THOUSAND)
9.5.1 NORTH AMERICA
9.5.2 EUROPE
9.5.3 ASIA-PACIFIC
9.5.4 SOUTH AMERICA
9.5.5 MIDDLE EAST AND AFRICA
9.6 NORTH AMERICA IXEKIZUMAB IN NON-RADIOGRAPHIC AXIAL SPONDYLOARTHRITIS THERAPEUTICS MARKET, BY REGION, 2018-2033 (USD THOUSAND)
9.6.1 NORTH AMERICA
9.6.2 EUROPE
9.6.3 ASIA-PACIFIC
9.6.4 SOUTH AMERICA
9.6.5 MIDDLE EAST AND AFRICA
9.7 NORTH AMERICA UPADACITINIB IN NON-RADIOGRAPHIC AXIAL SPONDYLOARTHRITIS THERAPEUTICS MARKET, BY REGION, 2018-2033 (USD THOUSAND)
9.7.1 NORTH AMERICA
9.7.2 EUROPE
9.7.3 ASIA-PACIFIC
9.7.4 SOUTH AMERICA
9.7.5 MIDDLE EAST AND AFRICA
9.8 NORTH AMERICA CERTOLIZUMAB PEGOL IN NON-RADIOGRAPHIC AXIAL SPONDYLOARTHRITIS THERAPEUTICS MARKET, BY REGION, 2018-2033 (USD THOUSAND)
9.8.1 NORTH AMERICA
9.8.2 EUROPE
9.8.3 ASIA-PACIFIC
9.8.4 SOUTH AMERICA
9.8.5 MIDDLE EAST AND AFRICA
9.9 NORTH AMERICA GOLIMUMAB IN NON-RADIOGRAPHIC AXIAL SPONDYLOARTHRITIS THERAPEUTICS MARKET, BY REGION, 2018-2033 (USD THOUSAND)
9.9.1 NORTH AMERICA
9.9.2 EUROPE
9.9.3 ASIA-PACIFIC
9.9.4 SOUTH AMERICA
9.9.5 MIDDLE EAST AND AFRICA
9.1 NORTH AMERICA INFLIXIMAB IN NON-RADIOGRAPHIC AXIAL SPONDYLOARTHRITIS THERAPEUTICS MARKET, BY REGION, 2018-2033 (USD THOUSAND)
9.10.1 NORTH AMERICA
9.10.2 EUROPE
9.10.3 ASIA-PACIFIC
9.10.4 SOUTH AMERICA
9.10.5 MIDDLE EAST AND AFRICA
9.11 NORTH AMERICA TOFACITINIB IN NON-RADIOGRAPHIC AXIAL SPONDYLOARTHRITIS THERAPEUTICS MARKET, BY REGION, 2018-2033 (USD THOUSAND)
9.11.1 NORTH AMERICA
9.11.2 EUROPE
9.11.3 ASIA-PACIFIC
9.11.4 SOUTH AMERICA
9.11.5 MIDDLE EAST AND AFRICA
9.12 NORTH AMERICA OTHER IN NON-RADIOGRAPHIC AXIAL SPONDYLOARTHRITIS THERAPEUTICS MARKET, BY REGION, 2018-2033 (USD THOUSAND)
9.12.1 NORTH AMERICA
9.12.2 EUROPE
9.12.3 ASIA-PACIFIC
9.12.4 SOUTH AMERICA
9.12.5 MIDDLE EAST AND AFRICA
10 NORTH AMERICA NON-RADIOGRAPHIC AXIAL SPONDYLOARTHRITIS THERAPEUTICS MARKET, BY ROUTE OF ADMINISTRATION
10.1 OVERVIEW
10.2 NORTH AMERICA NON-RADIOGRAPHIC AXIAL SPONDYLOARTHRITIS THERAPEUTICS MARKET, BY ROUTE OF ADMINISTRATION, 2018-2033 (USD THOUSAND)
10.2.1 SUBCUTANEOUS
10.2.2 ORAL
10.2.3 INTRAVENOUS
10.2.4 OTHERS
10.3 NORTH AMERICA SUBCUTANEOUS IN NON-RADIOGRAPHIC AXIAL SPONDYLOARTHRITIS THERAPEUTICS MARKET, BY REGION, 2018-2033 (USD THOUSAND)
10.3.1 NORTH AMERICA
10.3.2 EUROPE
10.3.3 ASIA-PACIFIC
10.3.4 SOUTH AMERICA
10.3.5 MIDDLE EAST AND AFRICA
10.4 NORTH AMERICA ORAL IN NON-RADIOGRAPHIC AXIAL SPONDYLOARTHRITIS THERAPEUTICS MARKET, BY REGION, 2018-2033 (USD THOUSAND)
10.4.1 NORTH AMERICA
10.4.2 EUROPE
10.4.3 ASIA-PACIFIC
10.4.4 SOUTH AMERICA
10.4.5 MIDDLE EAST AND AFRICA
10.5 NORTH AMERICA INTRAVENOUS IN NON-RADIOGRAPHIC AXIAL SPONDYLOARTHRITIS THERAPEUTICS MARKET, BY REGION, 2018-2033 (USD THOUSAND)
10.5.1 NORTH AMERICA
10.5.2 EUROPE
10.5.3 ASIA-PACIFIC
10.5.4 SOUTH AMERICA
10.5.5 MIDDLE EAST AND AFRICA
10.6 NORTH AMERICA OTHERS IN NON-RADIOGRAPHIC AXIAL SPONDYLOARTHRITIS THERAPEUTICS MARKET, BY REGION, 2018-2033 (USD THOUSAND)
10.6.1 NORTH AMERICA
10.6.2 EUROPE
10.6.3 ASIA-PACIFIC
10.6.4 SOUTH AMERICA
10.6.5 MIDDLE EAST AND AFRICA
11 NORTH AMERICA NON-RADIOGRAPHIC AXIAL SPONDYLOARTHRITIS THERAPEUTICS MARKET, BY END USER
11.1 OVERVIEW
11.2 NORTH AMERICA NON-RADIOGRAPHIC AXIAL SPONDYLOARTHRITIS THERAPEUTICS MARKET, BY END USER, 2018-2033 (USD THOUSAND)
11.2.1 SPECIALTY CLINICS
11.2.2 HOMECARE
11.2.3 HOSPITALS
11.2.4 PHARMACY & RETAILERS
11.2.5 OTHERS
11.3 NORTH AMERICA SPECIALTY CLINICS IN NON-RADIOGRAPHIC AXIAL SPONDYLOARTHRITIS THERAPEUTICS MARKET, BY REGION, 2018-2033 (USD THOUSAND)
11.3.1 NORTH AMERICA
11.3.2 EUROPE
11.3.3 ASIA-PACIFIC
11.3.4 SOUTH AMERICA
11.3.5 MIDDLE EAST AND AFRICA
11.4 NORTH AMERICA HOMECARE IN NON-RADIOGRAPHIC AXIAL SPONDYLOARTHRITIS THERAPEUTICS MARKET, BY REGION, 2018-2033 (USD THOUSAND)
11.4.1 NORTH AMERICA
11.4.2 EUROPE
11.4.3 ASIA-PACIFIC
11.4.4 SOUTH AMERICA
11.4.5 MIDDLE EAST AND AFRICA
11.5 NORTH AMERICA HOSPITALS IN NON-RADIOGRAPHIC AXIAL SPONDYLOARTHRITIS THERAPEUTICS MARKET, BY REGION, 2018-2033 (USD THOUSAND)
11.5.1 NORTH AMERICA
11.5.2 EUROPE
11.5.3 ASIA-PACIFIC
11.5.4 SOUTH AMERICA
11.5.5 MIDDLE EAST AND AFRICA
11.6 NORTH AMERICA PHARMACY & RETAILERS IN NON-RADIOGRAPHIC AXIAL SPONDYLOARTHRITIS THERAPEUTICS MARKET, BY REGION, 2018-2033 (USD THOUSAND)
11.6.1 NORTH AMERICA
11.6.2 EUROPE
11.6.3 ASIA-PACIFIC
11.6.4 SOUTH AMERICA
11.6.5 MIDDLE EAST AND AFRICA
11.7 NORTH AMERICA OTHERS IN NON-RADIOGRAPHIC AXIAL SPONDYLOARTHRITIS THERAPEUTICS MARKET, BY REGION, 2018-2033 (USD THOUSAND)
11.7.1 NORTH AMERICA
11.7.2 EUROPE
11.7.3 ASIA-PACIFIC
11.7.4 SOUTH AMERICA
11.7.5 MIDDLE EAST AND AFRICA
12 NORTH AMERICA NON-RADIOGRAPHIC AXIAL SPONDYLOARTHRITIS THERAPEUTICS MARKET, BY DISTRIBUTION CHANNEL
12.1 OVERVIEW
12.2 NORTH AMERICA NON-RADIOGRAPHIC AXIAL SPONDYLOARTHRITIS THERAPEUTICS MARKET, BY DISTRIBUTION CHANNEL, 2018-2033 (USD THOUSAND)
12.2.1 HOSPITAL PHARMACY
12.2.2 RETAIL PHARMACY
12.2.3 DIRECT TENDER
12.2.4 ONLINE PHARMACY
12.2.5 OTHERS
12.3 NORTH AMERICA HOSPITAL PHARMACY IN NON-RADIOGRAPHIC AXIAL SPONDYLOARTHRITIS THERAPEUTICS MARKET, BY REGION, 2018-2033 (USD THOUSAND)
12.3.1 NORTH AMERICA
12.3.2 EUROPE
12.3.3 ASIA-PACIFIC
12.3.4 SOUTH AMERICA
12.3.5 MIDDLE EAST AND AFRICA
12.4 NORTH AMERICA RETAIL PHARMACY IN NON-RADIOGRAPHIC AXIAL SPONDYLOARTHRITIS THERAPEUTICS MARKET, BY REGION, 2018-2033 (USD THOUSAND)
12.4.1 NORTH AMERICA
12.4.2 EUROPE
12.4.3 ASIA-PACIFIC
12.4.4 SOUTH AMERICA
12.4.5 MIDDLE EAST AND AFRICA
12.5 NORTH AMERICA DIRECT TENDER IN NON-RADIOGRAPHIC AXIAL SPONDYLOARTHRITIS THERAPEUTICS MARKET, BY REGION, 2018-2033 (USD THOUSAND)
12.5.1 NORTH AMERICA
12.5.2 EUROPE
12.5.3 ASIA-PACIFIC
12.5.4 SOUTH AMERICA
12.5.5 MIDDLE EAST AND AFRICA
12.6 NORTH AMERICA ONLINE PHARMACY IN NON-RADIOGRAPHIC AXIAL SPONDYLOARTHRITIS THERAPEUTICS MARKET, BY REGION, 2018-2033 (USD THOUSAND)
12.6.1 NORTH AMERICA
12.6.2 EUROPE
12.6.3 ASIA-PACIFIC
12.6.4 SOUTH AMERICA
12.6.5 MIDDLE EAST AND AFRICA
12.7 NORTH AMERICA OTHERS IN NON-RADIOGRAPHIC AXIAL SPONDYLOARTHRITIS THERAPEUTICS MARKET, BY REGION, 2018-2033 (USD THOUSAND)
12.7.1 NORTH AMERICA
12.7.2 EUROPE
12.7.3 ASIA-PACIFIC
12.7.4 SOUTH AMERICA
12.7.5 MIDDLE EAST AND AFRICA
13 NORTH AMERICA NON-RADIOGRAPHIC AXIAL SPONDYLOARTHRITIS THERAPEUTICS MARKET, BY REGION
13.1 NORTH AMERICA
13.1.1 U.S.
13.1.2 CANADA
13.1.3 MEXICO
14 NORTH AMERICA NON-RADIOGRAPHIC AXIAL SPONDYLOARTHRITIS THERAPEUTICS MARKET: COMPANY LANDSCAPE
14.1 COMPANY SHARE ANALYSIS: GLOBAL
15 SWOT ANALYSIS
16 COMPANY PROFILE MANUFRACTURER
16.1 NOVARTIS AG
16.1.1 COMPANY SNAPSHOT
16.1.2 REVENUE ANALYSIS
16.1.3 COMPANY SHARE ANALYSIS
16.1.4 PRODUCT PORTFOLIO
16.1.5 RECENT DEVELOPMENT
16.2 PFIZER INC.
16.2.1 COMPANY SNAPSHOT
16.2.2 REVENUE ANALYSIS
16.2.3 COMPANY SHARE ANALYSIS
16.2.4 PRODUCT PORTFOLIO
16.2.5 RECENT DEVELOPMENT
16.3 ABBVIE INC.
16.3.1 COMPANY SNAPSHOT
16.3.2 REVENUE ANALYSIS
16.3.3 COMPANY SHARE ANALYSIS
16.3.4 PRODUCT PORTFOLIO
16.3.5 RECENT DEVELOPMENT
16.4 UCB S.A.
16.4.1 COMPANY SNAPSHOT
16.4.2 REVENUE ANALYSIS
16.4.3 COMPANY SHARE ANALYSIS
16.4.4 PRODUCT PORTFOLIO
16.4.5 RECENT DEVELOPMENT
16.5 LILLY
16.5.1 COMPANY SNAPSHOT
16.5.2 REVENUE ANALYSIS
16.5.3 COMPANY SHARE ANALYSIS
16.5.4 PRODUCT PORTFOLIO
16.5.5 RECENT DEVELOPMENT
16.6 BIOGEN
16.6.1 COMPANY SNAPSHOT
16.6.2 REVENUE ANALYSIS
16.6.3 PRODUCT PORTFOLIO
16.6.4 RECENT DEVELOPMENT
16.7 ALKEM
16.7.1 COMPANY SNAPSHOT
16.7.2 REVENUE ANALYSIS
16.7.3 PRODUCT PORTFOLIO
16.7.4 RECENT DEVELOPMENT
16.8 AMGEN INC.
16.8.1 COMPANY SNAPSHOT
16.8.2 REVENUE ANALYSIS
16.8.3 PRODUCT PORTFOLIO
16.8.4 RECENT DEVELOPMENT
16.9 ASTELLAS PHARMA INC
16.9.1 COMPANY SNAPSHOT
16.9.2 REVENUE ANALYSIS
16.9.3 PRODUCT PORTFOLIO
16.9.4 RECENT DEVELOPMENT
16.1 BIOCAD
16.10.1 COMPANY SNAPSHOT
16.10.2 PRODUCT PORTFOLIO
16.10.3 RECENT DEVELOPMENT
16.11 BOEHRINGER INGELHEIM INTERNATIONAL GMBH.
16.11.1 COMPANY SNAPSHOT
16.11.2 PRODUCT PORTFOLIO
16.11.3 RECENT DEVELOPMENT
16.12 BRISTOL-MYERS SQUIBB (BMS)
16.12.1 COMPANY SNAPSHOT
16.12.2 REVENUE ANALYSIS
16.12.3 PRODUCT PORTFOLIO
16.12.4 RECENT DEVELOPMENT
16.13 CELLTRION INC.
16.13.1 COMPANY SNAPSHOT
16.13.2 REVENUE ANALYSIS
16.13.3 PRODUCT PORTFOLIO
16.13.4 RECENT DEVELOPMENTS
16.14 CIPLA
16.14.1 COMPANY SNAPSHOT
16.14.2 REVENUE ANALYSIS
16.14.3 PRODUCT PORTFOLIO
16.14.4 RECENT DEVELOPMENTS
16.15 DR.REDDY’S LABORATORIES LTD.
16.15.1 COMPANY SNAPSHOT
16.15.2 REVENUE ANALYSIS
16.15.3 PRODUCT PORTFOLIO
16.15.4 RECENT DEVELOPMENTS
16.16 F. HOFFMANN-LA ROCHE LTD
16.16.1 COMPANY SNAPSHOT
16.16.2 REVENUE ANALYSIS
16.16.3 PRODUCT PORTFOLIO
16.16.4 RECENT DEVELOPMENT
16.17 FRESENIUS SE & CO. KGAA
16.17.1 COMPANY SNAPSHOT
16.17.2 REVENUE ANALYSIS
16.17.3 PRODUCT PORTFOLIO
16.17.4 RECENT DEVELOPMENT
16.18 GEDEON RICHTER PLC.
16.18.1 COMPANY SNAPSHOT
16.18.2 REVENUE ANALYSIS
16.18.3 PRODUCT PORTFOLIO
16.18.4 RECENT DEVELOPMENTS
16.19 JOHNSON & JOHNSON AND ITS AFFILIATES
16.19.1 COMPANY SNAPSHOT
16.19.2 REVENUE ANALYSIS
16.19.3 PRODUCT PORTFOLIO
16.19.4 RECENT DEVELOPMENT
16.2 KYOWA KIRIN CO., LTD.
16.20.1 COMPANY SNAPSHOT
16.20.2 REVENUE ANALYSIS
16.20.3 PRODUCT PORTFOLIO
16.20.4 RECENT DEVELOPMENT
16.21 LUPIN
16.21.1 COMPANY SNAPSHOT
16.21.2 REVENUE ANALYSIS
16.21.3 PRODUCT PORTFOLIO
16.21.4 RECENT DEVELOPMENTS
16.22 MERCK KGAA
16.22.1 COMPANY SNAPSHOT
16.22.2 REVENUE ANALYSIS
16.22.3 PRODUCT PORTFOLIO
16.22.4 RECENT DEVELOPMENT
16.23 SAMSUNG BIOEPIS
16.23.1 COMPANY SNAPSHOT
16.23.2 PRODUCT PORTFOLIO
16.23.3 RECENT DEVELOPMENT
16.24 SANDOZ.INC
16.24.1 COMPANY SNAPSHOT
16.24.2 REVENUE ANALYSIS
16.24.3 PRODUCT PORTFOLIO
16.24.4 RECENT DEVELOPMENT
16.25 SANOFI
16.25.1 COMPANY SNAPSHOT
16.25.2 REVENUE ANALYSIS
16.25.3 PRODUCT PORTFOLIO
16.25.4 RECENT DEVELOPMENT
16.26 SUN PHARMACEUTICAL INDUSTRIES LTD.
16.26.1 COMPANY SNAPSHOT
16.26.2 REVENUE ANALYSIS
16.26.3 PRODUCT PORTFOLIO
16.26.4 RECENT DEVELOPMENTS
16.27 TAKEDA PHARMACEUTICAL COMPANY LIMITED.
16.27.1 COMPANY SNAPSHOT
16.27.2 REVENUE ANALYSIS
16.27.3 PRODUCT PORTFOLIO
16.27.4 RECENT DEVELOPMENT
16.28 TEVA PHARMACEUTICAL INDUSTRIES LTD.
16.28.1 COMPANY SNAPSHOT
16.28.2 REVENUE ANALYSIS
16.28.3 PRODUCT PORTFOLIO
16.28.4 RECENT DEVELOPMENT
16.29 TORRENT PHARMACEUTICALS LTD.
16.29.1 COMPANY SNAPSHOT
16.29.2 REVENUE ANALYSIS
16.29.3 PRODUCT PORTFOLIO
16.29.4 RECENT DEVELOPMENTS
16.3 VIATRIS INC.
16.30.1 COMPANY SNAPSHOT
16.30.2 REVENUE ANALYSIS
16.30.3 PRODUCT PORTFOLIO
16.30.4 RECENT DEVELOPMENTS
16.31 ZYDUS GROUP
16.31.1 COMPANY SNAPSHOT
16.31.2 REVENUE ANALYSIS
16.31.3 PRODUCT PORTFOLIO
16.31.4 RECENT DEVELOPMENT
17 COMPANY PROFILE DISTRIBUTOR
17.1 ALFRESA PHARMA CORPORATION
17.1.1 COMPANY SNAPSHOT
17.1.2 REVENUE ANALYSIS
17.1.3 PRODUCT PORTFOLIO
17.1.4 RECENT DEVELOPMENT
17.2 ASTUTE HEALTHCARE LTD.
17.2.1 COMPANY SNAPSHOT
17.2.2 PRODUCT PORTFOLIO
17.2.3 RECENT DEVELOPMENT
17.3 CARDINAL HEALTH
17.3.1 COMPANY SNAPSHOT
17.3.2 REVENUE ANALYSIS
17.3.3 PRODUCT PORTFOLIO
17.3.4 RECENT DEVELOPMENT
17.4 CENCORA, INC.
17.4.1 COMPANY SNAPSHOT
17.4.2 REVENUE ANALYSIS
17.4.3 PRODUCT PORTFOLIO
17.4.4 RECENT DEVELOPMENT
17.5 MCKESSON CORPORATION
17.5.1 COMPANY SNAPSHOT
17.5.2 REVENUE ANALYSIS
17.5.3 PRODUCT PORTFOLIO
17.5.4 RECENT DEVELOPMENT
17.6 MEDIPAL HOLDINGS CORPORATION
17.6.1 COMPANY SNAPSHOT
17.6.2 REVENUE ANALYSIS
17.6.3 PRODUCT PORTFOLIO
17.6.4 RECENT DEVELOPMENT
17.7 PHOENIX PHARMA SE
17.7.1 COMPANY SNAPSHOT
17.7.2 PRODUCT PORTFOLIO
17.7.3 RECENT DEVELOPMENT
17.8 SMITH DRUG COMPANY
17.8.1 COMPANY SNAPSHOT
17.8.2 PRODUCT PORTFOLIO
17.8.3 RECENT DEVELOPMENT
17.9 ZUELLIG PHARMA
17.9.1 COMPANY SNAPSHOT
17.9.2 PRODUCT PORTFOLIO
17.9.3 RECENT DEVELOPMENT
18 QUESTIONNAIRE
19 RELATED REPORTS
List of Table
TABLE 1 COST BREAKDOWN (BIOLOGIC VS NON-BIOLOGIC THERAPY)
TABLE 2 DRUG COST BENCHMARKS (NORTH AMERICA PRICING PERSPECTIVE)
TABLE 3 NORTH AMERICA NON-RADIOGRAPHIC AXIAL SPONDYLOARTHRITIS THERAPEUTICS MARKET, BY REGION, 2018-2033 (USD THOUSAND)
TABLE 4 NORTH AMERICA NON-RADIOGRAPHIC AXIAL SPONDYLOARTHRITIS THERAPEUTICS MARKET, BY TREATMENT TYPE, 2018-2033 (USD THOUSAND)
TABLE 5 NORTH AMERICA MEDICATION IN NON-RADIOGRAPHIC AXIAL SPONDYLOARTHRITIS THERAPEUTICS MARKET, BY TYPE, 2018-2033 (USD THOUSAND)
TABLE 6 NORTH AMERICA BIOLOGICS IN NON-RADIOGRAPHIC AXIAL SPONDYLOARTHRITIS THERAPEUTICS MARKET, BY TYPE, 2018-2033 (USD THOUSAND)
TABLE 7 NORTH AMERICA TNF INHIBITORS IN NON-RADIOGRAPHIC AXIAL SPONDYLOARTHRITIS THERAPEUTICS MARKET, BY TYPE, 2018-2033 (USD THOUSAND)
TABLE 8 NORTH AMERICA INTERLEUKIN (IL-17) INHIBITORS IN NON-RADIOGRAPHIC AXIAL SPONDYLOARTHRITIS THERAPEUTICS MARKET, BY TYPE, 2018-2033 (USD THOUSAND)
TABLE 9 NORTH AMERICA JAK INHIBITORS IN NON-RADIOGRAPHIC AXIAL SPONDYLOARTHRITIS THERAPEUTICS MARKET, BY TYPE, 2018-2033 (USD THOUSAND)
TABLE 10 NORTH AMERICA NSAIDS IN NON-RADIOGRAPHIC AXIAL SPONDYLOARTHRITIS THERAPEUTICS MARKET, BY TYPE, 2018-2033 (USD THOUSAND)
TABLE 11 NORTH AMERICA MEDICATION IN NON-RADIOGRAPHIC AXIAL SPONDYLOARTHRITIS THERAPEUTICS MARKET, BY REGION, 2018-2033 (USD THOUSAND)
TABLE 12 NORTH AMERICA SURGERY IN NON-RADIOGRAPHIC AXIAL SPONDYLOARTHRITIS THERAPEUTICS MARKET, BY TYPE, 2018-2033 (USD THOUSAND)
TABLE 13 NORTH AMERICA SURGERY IN NON-RADIOGRAPHIC AXIAL SPONDYLOARTHRITIS THERAPEUTICS MARKET, BY REGION, 2018-2033 (USD THOUSAND)
TABLE 14 NORTH AMERICA PHYSICAL THERAPY IN NON-RADIOGRAPHIC AXIAL SPONDYLOARTHRITIS THERAPEUTICS MARKET, BY TYPE, 2018-2033 (USD THOUSAND)
TABLE 15 NORTH AMERICA PHYSICAL THERAPY IN NON-RADIOGRAPHIC AXIAL SPONDYLOARTHRITIS THERAPEUTICS MARKET, BY REGION, 2018-2033 (USD THOUSAND)
TABLE 16 NORTH AMERICA OTHER IN NON-RADIOGRAPHIC AXIAL SPONDYLOARTHRITIS THERAPEUTICS MARKET, BY REGION, 2018-2033 (USD THOUSAND)
TABLE 17 NORTH AMERICA NON-RADIOGRAPHIC AXIAL SPONDYLOARTHRITIS THERAPEUTICS MARKET, BY DRUG, 2018-2033 (USD THOUSAND)
TABLE 18 NORTH AMERICA ADALIMUMAB IN NON-RADIOGRAPHIC AXIAL SPONDYLOARTHRITIS THERAPEUTICS MARKET, BY REGION, 2018-2033 (USD THOUSAND)
TABLE 19 NORTH AMERICA SECUKINUMAB IN NON-RADIOGRAPHIC AXIAL SPONDYLOARTHRITIS THERAPEUTICS MARKET, BY REGION, 2018-2033 (USD THOUSAND)
TABLE 20 NORTH AMERICA ETANERCEPT IN NON-RADIOGRAPHIC AXIAL SPONDYLOARTHRITIS THERAPEUTICS MARKET, BY REGION, 2018-2033 (USD THOUSAND)
TABLE 21 NORTH AMERICA IXEKIZUMAB IN NON-RADIOGRAPHIC AXIAL SPONDYLOARTHRITIS THERAPEUTICS MARKET, BY REGION, 2018-2033 (USD THOUSAND)
TABLE 22 NORTH AMERICA UPADACITINIB IN NON-RADIOGRAPHIC AXIAL SPONDYLOARTHRITIS THERAPEUTICS MARKET, BY REGION, 2018-2033 (USD THOUSAND)
TABLE 23 NORTH AMERICA CERTOLIZUMAB PEGOL IN NON-RADIOGRAPHIC AXIAL SPONDYLOARTHRITIS THERAPEUTICS MARKET, BY REGION, 2018-2033 (USD THOUSAND)
TABLE 24 NORTH AMERICA GOLIMUMAB IN NON-RADIOGRAPHIC AXIAL SPONDYLOARTHRITIS THERAPEUTICS MARKET, BY REGION, 2018-2033 (USD THOUSAND)
TABLE 25 NORTH AMERICA INFLIXIMAB IN NON-RADIOGRAPHIC AXIAL SPONDYLOARTHRITIS THERAPEUTICS MARKET, BY REGION, 2018-2033 (USD THOUSAND)
TABLE 26 NORTH AMERICA TOFACITINIB IN NON-RADIOGRAPHIC AXIAL SPONDYLOARTHRITIS THERAPEUTICS MARKET, BY REGION, 2018-2033 (USD THOUSAND)
TABLE 27 NORTH AMERICA OTHER IN NON-RADIOGRAPHIC AXIAL SPONDYLOARTHRITIS THERAPEUTICS MARKET, BY REGION, 2018-2033 (USD THOUSAND)
TABLE 28 NORTH AMERICA NON-RADIOGRAPHIC AXIAL SPONDYLOARTHRITIS THERAPEUTICS MARKET, BY ROUTE OF ADMINISTRATION, 2018-2033 (USD THOUSAND)
TABLE 29 NORTH AMERICA SUBCUTANEOUS IN NON-RADIOGRAPHIC AXIAL SPONDYLOARTHRITIS THERAPEUTICS MARKET, BY REGION, 2018-2033 (USD THOUSAND)
TABLE 30 NORTH AMERICA ORAL IN NON-RADIOGRAPHIC AXIAL SPONDYLOARTHRITIS THERAPEUTICS MARKET, BY REGION, 2018-2033 (USD THOUSAND)
TABLE 31 NORTH AMERICA INTRAVENOUS IN NON-RADIOGRAPHIC AXIAL SPONDYLOARTHRITIS THERAPEUTICS MARKET, BY REGION, 2018-2033 (USD THOUSAND)
TABLE 32 NORTH AMERICA OTHERS IN NON-RADIOGRAPHIC AXIAL SPONDYLOARTHRITIS THERAPEUTICS MARKET, BY REGION, 2018-2033 (USD THOUSAND)
TABLE 33 NORTH AMERICA NON-RADIOGRAPHIC AXIAL SPONDYLOARTHRITIS THERAPEUTICS MARKET, BY END USER, 2018-2033 (USD THOUSAND)
TABLE 34 NORTH AMERICA SPECIALTY CLINICS IN NON-RADIOGRAPHIC AXIAL SPONDYLOARTHRITIS THERAPEUTICS MARKET, BY REGION, 2018-2033 (USD THOUSAND)
TABLE 35 NORTH AMERICA HOMECARE IN NON-RADIOGRAPHIC AXIAL SPONDYLOARTHRITIS THERAPEUTICS MARKET, BY REGION, 2018-2033 (USD THOUSAND)
TABLE 36 NORTH AMERICA HOSPITALS IN NON-RADIOGRAPHIC AXIAL SPONDYLOARTHRITIS THERAPEUTICS MARKET, BY REGION, 2018-2033 (USD THOUSAND)
TABLE 37 NORTH AMERICA PHARMACY & RETAILERS IN NON-RADIOGRAPHIC AXIAL SPONDYLOARTHRITIS THERAPEUTICS MARKET, BY REGION, 2018-2033 (USD THOUSAND)
TABLE 38 NORTH AMERICA OTHERS IN NON-RADIOGRAPHIC AXIAL SPONDYLOARTHRITIS THERAPEUTICS MARKET, BY REGION, 2018-2033 (USD THOUSAND)
TABLE 39 NORTH AMERICA NON-RADIOGRAPHIC AXIAL SPONDYLOARTHRITIS THERAPEUTICS MARKET, BY DISTRIBUTION CHANNEL, 2018-2033 (USD THOUSAND)
TABLE 40 NORTH AMERICA HOSPITAL PHARMACY IN NON-RADIOGRAPHIC AXIAL SPONDYLOARTHRITIS THERAPEUTICS MARKET, BY REGION, 2018-2033 (USD THOUSAND)
TABLE 41 NORTH AMERICA RETAIL PHARMACY IN NON-RADIOGRAPHIC AXIAL SPONDYLOARTHRITIS THERAPEUTICS MARKET, BY REGION, 2018-2033 (USD THOUSAND)
TABLE 42 NORTH AMERICA DIRECT TENDER IN NON-RADIOGRAPHIC AXIAL SPONDYLOARTHRITIS THERAPEUTICS MARKET, BY REGION, 2018-2033 (USD THOUSAND)
TABLE 43 NORTH AMERICA ONLINE PHARMACY IN NON-RADIOGRAPHIC AXIAL SPONDYLOARTHRITIS THERAPEUTICS MARKET, BY REGION, 2018-2033 (USD THOUSAND)
TABLE 44 NORTH AMERICA OTHERS IN NON-RADIOGRAPHIC AXIAL SPONDYLOARTHRITIS THERAPEUTICS MARKET, BY REGION, 2018-2033 (USD THOUSAND)
TABLE 45 NORTH AMERICA NON-RADIOGRAPHIC AXIAL SPONDYLOARTHRITIS THERAPEUTICS MARKET, BY COUNTRY, 2018-2033 (USD THOUSAND)
TABLE 46 NORTH AMERICA NON-RADIOGRAPHIC AXIAL SPONDYLOARTHRITIS THERAPEUTICS MARKET, BY TREATMENT TYPE, 2018-2033 (USD THOUSAND)
TABLE 47 NORTH AMERICA MEDICATION IN NON-RADIOGRAPHIC AXIAL SPONDYLOARTHRITIS THERAPEUTICS MARKET, BY TYPE, 2018-2033 (USD THOUSAND)
TABLE 48 NORTH AMERICA BIOLOGICS IN NON-RADIOGRAPHIC AXIAL SPONDYLOARTHRITIS THERAPEUTICS MARKET, BY TYPE, 2018-2033 (USD THOUSAND)
TABLE 49 NORTH AMERICA TNF INHIBITORS IN NON-RADIOGRAPHIC AXIAL SPONDYLOARTHRITIS THERAPEUTICS MARKET, BY TYPE, 2018-2033 (USD THOUSAND)
TABLE 50 NORTH AMERICA INTERLEUKIN (IL-17) INHIBITORS IN NON-RADIOGRAPHIC AXIAL SPONDYLOARTHRITIS THERAPEUTICS MARKET, BY TYPE, 2018-2033 (USD THOUSAND)
TABLE 51 NORTH AMERICA JAK INHIBITORS IN NON-RADIOGRAPHIC AXIAL SPONDYLOARTHRITIS THERAPEUTICS MARKET, BY TYPE, 2018-2033 (USD THOUSAND)
TABLE 52 NORTH AMERICA NSAIDS IN NON-RADIOGRAPHIC AXIAL SPONDYLOARTHRITIS THERAPEUTICS MARKET, BY TYPE, 2018-2033 (USD THOUSAND)
TABLE 53 NORTH AMERICA SURGERY IN NON-RADIOGRAPHIC AXIAL SPONDYLOARTHRITIS THERAPEUTICS MARKET, BY TYPE, 2018-2033 (USD THOUSAND)
TABLE 54 NORTH AMERICA PHYSICAL THERAPY IN NON-RADIOGRAPHIC AXIAL SPONDYLOARTHRITIS THERAPEUTICS MARKET, BY TYPE, 2018-2033 (USD THOUSAND)
TABLE 55 NORTH AMERICA NON-RADIOGRAPHIC AXIAL SPONDYLOARTHRITIS THERAPEUTICS MARKET, BY DRUG, 2018-2033 (USD THOUSAND)
TABLE 56 NORTH AMERICA NON-RADIOGRAPHIC AXIAL SPONDYLOARTHRITIS THERAPEUTICS MARKET, BY ROUTE OF ADMINISTRATION, 2018-2033 (USD THOUSAND)
TABLE 57 NORTH AMERICA NON-RADIOGRAPHIC AXIAL SPONDYLOARTHRITIS THERAPEUTICS MARKET, BY END USER, 2018-2033 (USD THOUSAND)
TABLE 58 NORTH AMERICA NON-RADIOGRAPHIC AXIAL SPONDYLOARTHRITIS THERAPEUTICS MARKET, BY DISTRIBUTION CHANNEL, 2018-2033 (USD THOUSAND)
TABLE 59 U.S. NON-RADIOGRAPHIC AXIAL SPONDYLOARTHRITIS THERAPEUTICS MARKET, BY TREATMENT TYPE, 2018-2033 (USD THOUSAND)
TABLE 60 U.S. MEDICATION IN NON-RADIOGRAPHIC AXIAL SPONDYLOARTHRITIS THERAPEUTICS MARKET, BY TYPE, 2018-2033 (USD THOUSAND)
TABLE 61 U.S. BIOLOGICS IN NON-RADIOGRAPHIC AXIAL SPONDYLOARTHRITIS THERAPEUTICS MARKET, BY TYPE, 2018-2033 (USD THOUSAND)
TABLE 62 U.S. TNF INHIBITORS IN NON-RADIOGRAPHIC AXIAL SPONDYLOARTHRITIS THERAPEUTICS MARKET, BY TYPE, 2018-2033 (USD THOUSAND)
TABLE 63 U.S. INTERLEUKIN (IL-17) INHIBITORS IN NON-RADIOGRAPHIC AXIAL SPONDYLOARTHRITIS THERAPEUTICS MARKET, BY TYPE, 2018-2033 (USD THOUSAND)
TABLE 64 U.S. JAK INHIBITORS IN NON-RADIOGRAPHIC AXIAL SPONDYLOARTHRITIS THERAPEUTICS MARKET, BY TYPE, 2018-2033 (USD THOUSAND)
TABLE 65 U.S. NSAIDS IN NON-RADIOGRAPHIC AXIAL SPONDYLOARTHRITIS THERAPEUTICS MARKET, BY TYPE, 2018-2033 (USD THOUSAND)
TABLE 66 U.S. SURGERY IN NON-RADIOGRAPHIC AXIAL SPONDYLOARTHRITIS THERAPEUTICS MARKET, BY TYPE, 2018-2033 (USD THOUSAND)
TABLE 67 U.S. PHYSICAL THERAPY IN NON-RADIOGRAPHIC AXIAL SPONDYLOARTHRITIS THERAPEUTICS MARKET, BY TYPE, 2018-2033 (USD THOUSAND)
TABLE 68 U.S. NON-RADIOGRAPHIC AXIAL SPONDYLOARTHRITIS THERAPEUTICS MARKET, BY DRUG, 2018-2033 (USD THOUSAND)
TABLE 69 U.S. NON-RADIOGRAPHIC AXIAL SPONDYLOARTHRITIS THERAPEUTICS MARKET, BY ROUTE OF ADMINISTRATION, 2018-2033 (USD THOUSAND)
TABLE 70 U.S. NON-RADIOGRAPHIC AXIAL SPONDYLOARTHRITIS THERAPEUTICS MARKET, BY END USER, 2018-2033 (USD THOUSAND)
TABLE 71 U.S. NON-RADIOGRAPHIC AXIAL SPONDYLOARTHRITIS THERAPEUTICS MARKET, BY DISTRIBUTION CHANNEL, 2018-2033 (USD THOUSAND)
TABLE 72 CANADA NON-RADIOGRAPHIC AXIAL SPONDYLOARTHRITIS THERAPEUTICS MARKET, BY TREATMENT TYPE, 2018-2033 (USD THOUSAND)
TABLE 73 CANADA MEDICATION IN NON-RADIOGRAPHIC AXIAL SPONDYLOARTHRITIS THERAPEUTICS MARKET, BY TYPE, 2018-2033 (USD THOUSAND)
TABLE 74 CANADA BIOLOGICS IN NON-RADIOGRAPHIC AXIAL SPONDYLOARTHRITIS THERAPEUTICS MARKET, BY TYPE, 2018-2033 (USD THOUSAND)
TABLE 75 CANADA TNF INHIBITORS IN NON-RADIOGRAPHIC AXIAL SPONDYLOARTHRITIS THERAPEUTICS MARKET, BY TYPE, 2018-2033 (USD THOUSAND)
TABLE 76 CANADA INTERLEUKIN (IL-17) INHIBITORS IN NON-RADIOGRAPHIC AXIAL SPONDYLOARTHRITIS THERAPEUTICS MARKET, BY TYPE, 2018-2033 (USD THOUSAND)
TABLE 77 CANADA JAK INHIBITORS IN NON-RADIOGRAPHIC AXIAL SPONDYLOARTHRITIS THERAPEUTICS MARKET, BY TYPE, 2018-2033 (USD THOUSAND)
TABLE 78 CANADA NSAIDS IN NON-RADIOGRAPHIC AXIAL SPONDYLOARTHRITIS THERAPEUTICS MARKET, BY TYPE, 2018-2033 (USD THOUSAND)
TABLE 79 CANADA SURGERY IN NON-RADIOGRAPHIC AXIAL SPONDYLOARTHRITIS THERAPEUTICS MARKET, BY TYPE, 2018-2033 (USD THOUSAND)
TABLE 80 CANADA PHYSICAL THERAPY IN NON-RADIOGRAPHIC AXIAL SPONDYLOARTHRITIS THERAPEUTICS MARKET, BY TYPE, 2018-2033 (USD THOUSAND)
TABLE 81 CANADA NON-RADIOGRAPHIC AXIAL SPONDYLOARTHRITIS THERAPEUTICS MARKET, BY DRUG, 2018-2033 (USD THOUSAND)
TABLE 82 CANADA NON-RADIOGRAPHIC AXIAL SPONDYLOARTHRITIS THERAPEUTICS MARKET, BY ROUTE OF ADMINISTRATION, 2018-2033 (USD THOUSAND)
TABLE 83 CANADA NON-RADIOGRAPHIC AXIAL SPONDYLOARTHRITIS THERAPEUTICS MARKET, BY END USER, 2018-2033 (USD THOUSAND)
TABLE 84 CANADA NON-RADIOGRAPHIC AXIAL SPONDYLOARTHRITIS THERAPEUTICS MARKET, BY DISTRIBUTION CHANNEL, 2018-2033 (USD THOUSAND)
TABLE 85 MEXICO NON-RADIOGRAPHIC AXIAL SPONDYLOARTHRITIS THERAPEUTICS MARKET, BY TREATMENT TYPE, 2018-2033 (USD THOUSAND)
TABLE 86 MEXICO MEDICATION IN NON-RADIOGRAPHIC AXIAL SPONDYLOARTHRITIS THERAPEUTICS MARKET, BY TYPE, 2018-2033 (USD THOUSAND)
TABLE 87 MEXICO BIOLOGICS IN NON-RADIOGRAPHIC AXIAL SPONDYLOARTHRITIS THERAPEUTICS MARKET, BY TYPE, 2018-2033 (USD THOUSAND)
TABLE 88 MEXICO TNF INHIBITORS IN NON-RADIOGRAPHIC AXIAL SPONDYLOARTHRITIS THERAPEUTICS MARKET, BY TYPE, 2018-2033 (USD THOUSAND)
TABLE 89 MEXICO INTERLEUKIN (IL-17) INHIBITORS IN NON-RADIOGRAPHIC AXIAL SPONDYLOARTHRITIS THERAPEUTICS MARKET, BY TYPE, 2018-2033 (USD THOUSAND)
TABLE 90 MEXICO JAK INHIBITORS IN NON-RADIOGRAPHIC AXIAL SPONDYLOARTHRITIS THERAPEUTICS MARKET, BY TYPE, 2018-2033 (USD THOUSAND)
TABLE 91 MEXICO NSAIDS IN NON-RADIOGRAPHIC AXIAL SPONDYLOARTHRITIS THERAPEUTICS MARKET, BY TYPE, 2018-2033 (USD THOUSAND)
TABLE 92 MEXICO SURGERY IN NON-RADIOGRAPHIC AXIAL SPONDYLOARTHRITIS THERAPEUTICS MARKET, BY TYPE, 2018-2033 (USD THOUSAND)
TABLE 93 MEXICO PHYSICAL THERAPY IN NON-RADIOGRAPHIC AXIAL SPONDYLOARTHRITIS THERAPEUTICS MARKET, BY TYPE, 2018-2033 (USD THOUSAND)
TABLE 94 MEXICO NON-RADIOGRAPHIC AXIAL SPONDYLOARTHRITIS THERAPEUTICS MARKET, BY DRUG, 2018-2033 (USD THOUSAND)
TABLE 95 MEXICO NON-RADIOGRAPHIC AXIAL SPONDYLOARTHRITIS THERAPEUTICS MARKET, BY ROUTE OF ADMINISTRATION, 2018-2033 (USD THOUSAND)
TABLE 96 MEXICO NON-RADIOGRAPHIC AXIAL SPONDYLOARTHRITIS THERAPEUTICS MARKET, BY END USER, 2018-2033 (USD THOUSAND)
TABLE 97 MEXICO NON-RADIOGRAPHIC AXIAL SPONDYLOARTHRITIS THERAPEUTICS MARKET, BY DISTRIBUTION CHANNEL, 2018-2033 (USD THOUSAND)
List of Figure
FIGURE 1 NORTH AMERICA NON-RADIOGRAPHIC AXIAL SPONDYLOARTHRITIS THERAPEUTICS MARKET: SEGMENTATION
FIGURE 2 NORTH AMERICA NON-RADIOGRAPHIC AXIAL SPONDYLOARTHRITIS THERAPEUTICS MARKET: DATA TRIANGULATION
FIGURE 3 NORTH AMERICA NON-RADIOGRAPHIC AXIAL SPONDYLOARTHRITIS THERAPEUTICS MARKET: DROC ANALYSIS
FIGURE 4 NORTH AMERICA NON-RADIOGRAPHIC AXIAL SPONDYLOARTHRITIS THERAPEUTICS MARKET: NORTH AMERICA VS REGIONAL ANALYSIS
FIGURE 5 NORTH AMERICA NON-RADIOGRAPHIC AXIAL SPONDYLOARTHRITIS THERAPEUTICS MARKET: COMPANY RESEARCH ANALYSIS
FIGURE 6 NORTH AMERICA NON-RADIOGRAPHIC AXIAL SPONDYLOARTHRITIS THERAPEUTICS MARKET: INTERVIEW DEMOGRAPHICS
FIGURE 7 NORTH AMERICA NON-RADIOGRAPHIC AXIAL SPONDYLOARTHRITIS THERAPEUTICS MARKET: DBMR MARKET POSITION GRID
FIGURE 8 NORTH AMERICA NON-RADIOGRAPHIC AXIAL SPONDYLOARTHRITIS THERAPEUTICS MARKET: MARKET APPLICATION COVERAGE GRID
FIGURE 9 NORTH AMERICA NON-RADIOGRAPHIC AXIAL SPONDYLOARTHRITIS THERAPEUTICS MARKET : VENDOR SHARE ANALYSIS
FIGURE 10 EXECUTIVE SUMMARY
FIGURE 11 NORTH AMERICA NON-RADIOGRAPHIC AXIAL SPONDYLOARTHRITIS THERAPEUTICS MARKET: SEGMENTATION
FIGURE 12 FOUR SEGMENTS COMPRISE THE NORTH AMERICA NON-RADIOGRAPHIC AXIAL SPONDYLOARTHRITIS THERAPEUTICS MARKET, BY TREATMENT TYPE (2025)
FIGURE 13 STRATEGIC DECISIONS
FIGURE 14 NORTH AMERICA IS EXPECTED TO DOMINATE THE NORTH AMERICA NON-RADIOGRAPHIC AXIAL SPONDYLOARTHRITIS THERAPEUTICS MARKET AND ASIA PACIFIC IS GROWING WITH THE HIGHEST CAGR IN THE FORECAST PERIOD OF 2026 TO 2033
FIGURE 15 INCREASING PREVALENCE OF NON-RADIOGRAPHIC AXIAL SPONDYLOARTHRITIS AND IMPROVED DISEASE AWARENESS EXPECTED TO DRIVE THE NORTH AMERICA NON-RADIOGRAPHIC AXIAL SPONDYLOARTHRITIS THERAPEUTICS MARKET IN THE FORECAST PERIOD OF 2026 TO 2033
FIGURE 16 MEDICATION SEGMENT IS EXPECTED TO ACCOUNT FOR THE LARGEST SHARE OF THE NORTH AMERICA NON-RADIOGRAPHIC AXIAL SPONDYLOARTHRITIS THERAPEUTICS MARKET IN 2026 & 2033
FIGURE 17 55
FIGURE 18 PATENT VS IPC CODE
FIGURE 19 PATENT DISTRIBUTION COUNTRY WISE
FIGURE 20 PATENT DISTRIBUTION YEAR WISE
FIGURE 21 PATENT DISTRIBUTION APPLICANT WISE
FIGURE 22 DROC ANALYSIS
FIGURE 23 NORTH AMERICA NON-RADIOGRAPHIC AXIAL SPONDYLOARTHRITIS THERAPEUTICS MARKET: BY TREATMENT TYPE, 2025
FIGURE 24 NORTH AMERICA NON-RADIOGRAPHIC AXIAL SPONDYLOARTHRITIS THERAPEUTICS MARKET: BY TREATMENT TYPE, 2026 TO 2033 (USD MILLION)
FIGURE 25 NORTH AMERICA NON-RADIOGRAPHIC AXIAL SPONDYLOARTHRITIS THERAPEUTICS MARKET: BY TREATMENT TYPE, CAGR (2026- 2033)
FIGURE 26 NORTH AMERICA NON-RADIOGRAPHIC AXIAL SPONDYLOARTHRITIS THERAPEUTICS MARKET: BY TREATMENT TYPE, LIFELINE CURVE
FIGURE 27 NORTH AMERICA NON-RADIOGRAPHIC AXIAL SPONDYLOARTHRITIS THERAPEUTICS MARKET: BY DRUG, 2025
FIGURE 28 NORTH AMERICA NON-RADIOGRAPHIC AXIAL SPONDYLOARTHRITIS THERAPEUTICS MARKET: BY DRUG, 2026 TO 2033 (USD MILLION)
FIGURE 29 NORTH AMERICA NON-RADIOGRAPHIC AXIAL SPONDYLOARTHRITIS THERAPEUTICS MARKET: BY DRUG, CAGR (2026- 2033)
FIGURE 30 NORTH AMERICA NON-RADIOGRAPHIC AXIAL SPONDYLOARTHRITIS THERAPEUTICS MARKET: BY DRUG, LIFELINE CURVE
FIGURE 31 NORTH AMERICA NON-RADIOGRAPHIC AXIAL SPONDYLOARTHRITIS THERAPEUTICS MARKET: BY ROUTE OF ADMINISTRATION, 2025
FIGURE 32 NORTH AMERICA NON-RADIOGRAPHIC AXIAL SPONDYLOARTHRITIS THERAPEUTICS MARKET: BY ROUTE OF ADMINISTRATION, 2026 TO 2033 (USD MILLION)
FIGURE 33 NORTH AMERICA NON-RADIOGRAPHIC AXIAL SPONDYLOARTHRITIS THERAPEUTICS MARKET: BY ROUTE OF ADMINISTRATION, CAGR (2026- 2033)
FIGURE 34 NORTH AMERICA NON-RADIOGRAPHIC AXIAL SPONDYLOARTHRITIS THERAPEUTICS MARKET: BY ROUTE OF ADMINISTRATION, LIFELINE CURVE
FIGURE 35 NORTH AMERICA NON-RADIOGRAPHIC AXIAL SPONDYLOARTHRITIS THERAPEUTICS MARKET: BY END USER, 2025
FIGURE 36 NORTH AMERICA NON-RADIOGRAPHIC AXIAL SPONDYLOARTHRITIS THERAPEUTICS MARKET: BY END USER, 2026 TO 2033 (USD MILLION)
FIGURE 37 NORTH AMERICA NON-RADIOGRAPHIC AXIAL SPONDYLOARTHRITIS THERAPEUTICS MARKET: BY END USER, CAGR (2026- 2033)
FIGURE 38 NORTH AMERICA NON-RADIOGRAPHIC AXIAL SPONDYLOARTHRITIS THERAPEUTICS MARKET: BY END USER, LIFELINE CURVE
FIGURE 39 NORTH AMERICA NON-RADIOGRAPHIC AXIAL SPONDYLOARTHRITIS THERAPEUTICS MARKET: BY DISTRIBUTION CHANNEL, 2025
FIGURE 40 NORTH AMERICA NON-RADIOGRAPHIC AXIAL SPONDYLOARTHRITIS THERAPEUTICS MARKET: BY DISTRIBUTION CHANNEL, 2026 TO 2033 (USD MILLION)
FIGURE 41 NORTH AMERICA NON-RADIOGRAPHIC AXIAL SPONDYLOARTHRITIS THERAPEUTICS MARKET: BY DISTRIBUTION CHANNEL, CAGR (2026- 2033)
FIGURE 42 NORTH AMERICA NON-RADIOGRAPHIC AXIAL SPONDYLOARTHRITIS THERAPEUTICS MARKET: BY DISTRIBUTION CHANNEL, LIFELINE CURVE
FIGURE 43 NORTH AMERICA NON-RADIOGRAPHIC AXIAL SPONDYLOARTHRITIS THERAPEUTICS MARKET: SNAPSHOT (2025)
FIGURE 44 NORTH AMERICA NON-RADIOGRAPHIC AXIAL SPONDYLOARTHRITIS THERAPEUTICS MARKET: COMPANY SHARE 2025 (%)
Data collection and base year analysis are done using data collection modules with large sample sizes. The stage includes obtaining market information or related data through various sources and strategies. It includes examining and planning all the data acquired from the past in advance. It likewise envelops the examination of information inconsistencies seen across different information sources. The market data is analysed and estimated using market statistical and coherent models. Also, market share analysis and key trend analysis are the major success factors in the market report. To know more, please request an analyst call or drop down your inquiry.
The key research methodology used by DBMR research team is data triangulation which involves data mining, analysis of the impact of data variables on the market and primary (industry expert) validation. Data models include Vendor Positioning Grid, Market Time Line Analysis, Market Overview and Guide, Company Positioning Grid, Patent Analysis, Pricing Analysis, Company Market Share Analysis, Standards of Measurement, Global versus Regional and Vendor Share Analysis. To know more about the research methodology, drop in an inquiry to speak to our industry experts.
Data Bridge Market Research is a leader in advanced formative research. We take pride in servicing our existing and new customers with data and analysis that match and suits their goal. The report can be customized to include price trend analysis of target brands understanding the market for additional countries (ask for the list of countries), clinical trial results data, literature review, refurbished market and product base analysis. Market analysis of target competitors can be analyzed from technology-based analysis to market portfolio strategies. We can add as many competitors that you require data about in the format and data style you are looking for. Our team of analysts can also provide you data in crude raw excel files pivot tables (Fact book) or can assist you in creating presentations from the data sets available in the report.


