
North America Nut Oil Market
Market Size in USD Billion
 USD
22.55 Billion
USD
41.46 Billion
2025
2033
USD
22.55 Billion
USD
41.46 Billion
2025
2033
| 2026 - 2033 | |
| USD 22.55 Billion | |
| USD 41.46 Billion | |
| % | |
|
North America Nut Oil Market Size
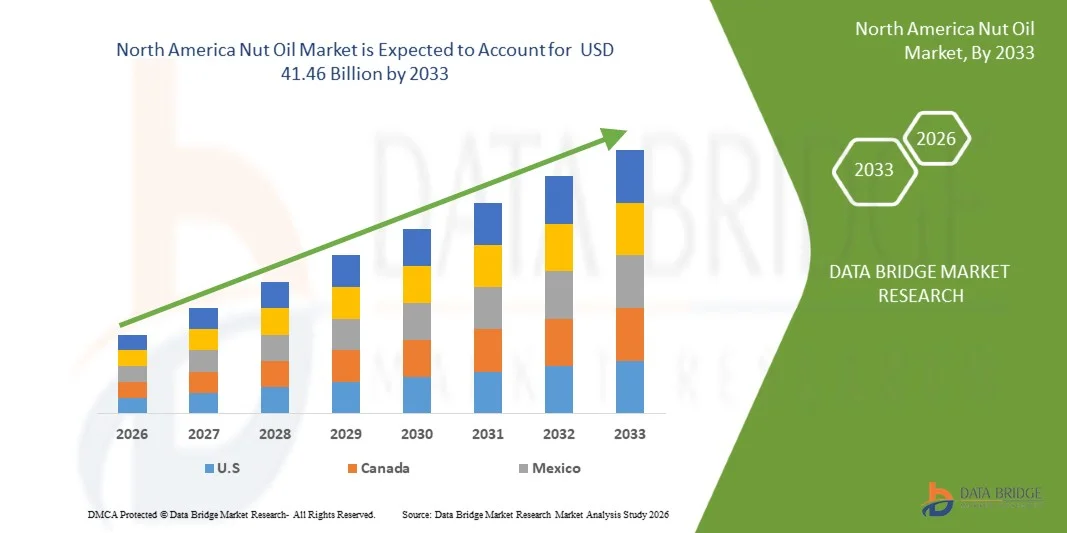
- The North America nut oil market size was valued at USD 22.55 billion in 2025 and is expected to reach USD 41.46 billion by 2033, at a CAGR of 7.30% during the forecast period
- The market growth is largely fuelled by the increasing consumer preference for natural and plant-based oils for cooking and skincare
- Rising awareness about the health benefits of nut oils, such as improved heart health and antioxidant properties
North America Nut Oil Market Analysis
- The market is witnessing a shift towards organic and cold-pressed nut oils due to their superior nutritional profile and minimal processing
- Manufacturers are focusing on product innovation and introducing blends and flavored nut oils to attract health-conscious consumers
- U.S. dominated the nut oil market by holding the largest market revenue share in 2025 due to its advanced food processing ecosystem, high consumer awareness regarding functional and nutrient-dense oils, and strong presence of leading manufacturers
- Canada is expected to witness the highest compound annual growth rate (CAGR) in the North America nut oil market due to rising health consciousness, growing demand for organic and cold-pressed oils, and expanding availability of specialty nut oils through both retail and online distribution channels
- The conventional segment held the largest market revenue share in 2025 driven by its wider availability, lower price point, and strong use across food processing and personal care applications. Conventional nut oils continue to dominate mainstream retail shelves due to established supply chains and broader consumer acceptance
Report Scope and North America Nut Oil Market Segmentation
|
Attributes |
North America Nut Oil Key Market Insights |
|
Segments Covered |
|
|
Countries Covered |
North America
|
|
Key Market Players |
|
|
Market Opportunities |
|
|
Value Added Data Infosets |
In addition to the insights on market scenarios such as market value, growth rate, segmentation, geographical coverage, and major players, the market reports curated by the Data Bridge Market Research also include in-depth expert analysis, pricing analysis, brand share analysis, consumer survey, demography analysis, supply chain analysis, value chain analysis, raw material/consumables overview, vendor selection criteria, PESTLE Analysis, Porter Analysis, and regulatory framework. |
North America Nut Oil Market Trends
“Rise of Cold-Pressed and Nutrient-Rich Oils in the Nut Oil Market”
- The growing consumer shift toward cold-pressed nut oils is reshaping the market by offering minimally processed, nutrient-dense products. These oils retain higher antioxidant and vitamin content, meeting the rising preference for natural and functional ingredients. The trend is especially strong among buyers adopting preventive health and clean-label lifestyles
- The rising demand for premium edible oils in urban and semi-urban regions is accelerating adoption of almond, walnut, hazelnut, and macadamia oils. These oils are increasingly used in gourmet cooking, functional foods, and specialty diets due to their superior flavor and nutritional profile. Their growing presence in retail and e-commerce channels is further boosting household uptake
- The affordability and improved availability of cold-press extraction technology are enabling small manufacturers to enter the market, supporting localized production growth. These technologies provide higher extraction efficiency, lower operational complexity, and better-quality yields. As a result, community-level processing units are gaining traction across emerging economies
- For instance, in 2023, many small-scale oil processors reported increased sales of cold-pressed nut oils after adopting compact extraction machines. These technologies improved purity and consistency, boosting the competitiveness of local producers and supporting employment generation in rural communities
- While demand for cold-pressed nut oils is rising, sustained market growth depends on consumer education, quality standardization, and competitive pricing. Manufacturers need to build strong value-based positioning with emphasis on purity, traceability, and authentic sourcing. Aligning offerings with health, sustainability, and premium lifestyle trends will be essential for long-term success
North America Nut Oil Market Dynamics
Driver
“Increasing Demand for Functional and Nutrient-Dense Oils”
- The rise in health and wellness trends is driving consumers toward nutrient-rich oils that offer heart health, anti-inflammatory, and skin-nourishing benefits. Oils such as walnut and almond contain omega fatty acids, antioxidants, and vitamins that support holistic well-being. This shift reflects a broader consumer move toward food products with scientifically backed functional benefits
- Consumers are increasingly aware of the functional advantages of nut oils for culinary and personal care applications. The versatility of these oils allows them to be used in salads, gourmet preparations, skincare serums, and natural cosmetics. The preference for plant-based and chemical-free ingredients continues to support stronger cross-industry adoption
- Industry initiatives such as clean labeling, transparent sourcing, and organic certifications are enhancing trust among consumers. In addition, premium brands are highlighting farm-to-bottle traceability to strengthen product authenticity and differentiation. These initiatives align with global demand for minimally processed oils that meet sustainability and purity expectations
- For instance, in 2022, multiple food manufacturers reformulated their premium product lines to include cold-pressed nut oils, strengthening overall market demand. This shift supported product premiumization and helped brands cater to health-conscious consumers, encouraging suppliers to scale up high-quality nut oil production
- While consumer awareness is a strong growth driver, the market requires sustained product innovation, effective branding, and competitive pricing strategies to maintain long-term momentum. Companies must invest in premium packaging, targeted marketing, and differentiated product attributes. Continuous R&D in extraction and formulation technologies will further support market expansion
Restraint/Challenge
“High Production Costs and Limited Raw Material Availability”
- The high cost of nut cultivation and the low oil yield from nuts such as macadamia and hazelnut contribute to elevated production expenses. These challenges result in premium retail pricing, restricting accessibility for cost-sensitive consumers. In addition, producers face rising input costs related to labor, irrigation, and orchard management
- In many nut-producing regions, limited processing infrastructure and inadequate post-harvest handling systems reduce production efficiency. Smaller manufacturers often lack modern machinery and technical training needed to ensure consistent output. These gaps lead to quality variations that affect brand credibility and market competitiveness
- Supply chain constraints, such as seasonal availability and climate-induced fluctuations in nut production, create volatility in raw material supply. Erratic weather conditions affect flowering cycles and yield stability, disrupting production planning. This volatility also leads to frequent price swings, affecting both manufacturers and distributors
- For instance, in 2023, several nut oil producers experienced supply shortages due to inconsistent raw material availability linked to adverse weather conditions. The reduced harvest volumes created procurement challenges for processors, impacting production, distribution networks, and export commitments
- While technological advancements are gradually improving extraction efficiency, addressing raw material shortages and production costs remains essential. Investments in climate-resilient farming, integrated supply chains, and improved processing capabilities are necessary for future stability. Sustainable cultivation practices will play a pivotal role in ensuring long-term growth of the nut oil market
North America Nut Oil Market Scope
The market is segmented on the basis of category, product type, end use, and distribution channel
• By Category
On the basis of category, the North America nut oil market is segmented into organic and conventional. The conventional segment held the largest market revenue share in 2025 driven by its wider availability, lower price point, and strong use across food processing and personal care applications. Conventional nut oils continue to dominate mainstream retail shelves due to established supply chains and broader consumer acceptance.
The organic segment is expected to witness the fastest growth rate from 2026 to 2033 driven by rising consumer preference for clean-label, chemical-free, and sustainably sourced products. Organic nut oils appeal to health-conscious buyers seeking natural purity and premium nutritional value. Increasing adoption in skincare, aromatherapy, and high-end culinary uses is significantly boosting segment expansion.
• By Product Type
On the basis of product type, the North America nut oil market is segmented into Almond Oil, Brazil Nut Oil, Cashews Oil, Chestnuts Oil, Filberts Oil, Hazelnut Oil, Hickory Nuts Oil, Macadamia Oil, Pecan Oil, Pine Nut Oil, Pistachio Oil, Walnut Oil, Peanut Oil, Argan Oil, Marula Oil, Mongongo Oil and Others. Almond and walnut oils held the largest market revenue share in 2025 driven by their wide application in food preparation, skincare, and wellness formulations. Their strong nutritional profile and established consumer familiarity support consistent demand across industries.
Macadamia, argan, and marula oils are expected to witness the fastest growth rate from 2026 to 2033 driven by rising interest in premium, exotic, and nutrient-dense oils. These oils are increasingly used in high-value personal care, luxury cosmetics, and therapeutic blends due to their superior emollient properties. Expanding adoption in specialty foods and natural beauty products is further amplifying their growth.
• By End Use
On the basis of end use, the North America nut oil market is segmented into Food Processing Industries, Personal Care & Cosmetic Industries, Direct Consumption, Aromatherapy, Paints & Varnishes and Others. The food processing industries segment held the largest market revenue share in 2025 driven by strong utilization of nut oils in bakery, confectionery, functional foods, and gourmet formulations. Their rich flavor, natural antioxidants, and nutritional appeal support widespread food industry integration.
The personal care & cosmetic industries segment is expected to witness the fastest growth rate from 2026 to 2033 driven by increasing demand for natural emollients, plant-based moisturizers, and nutrient-rich ingredients in skincare and haircare formulations. Nut oils such as almond, argan, and macadamia are highly preferred for their hydrating, anti-inflammatory, and restorative properties. Growing wellness trends and premium cosmetic launches continue to propel segment growth.
• By Distribution Channel
On the basis of distribution channel, the North America nut oil market is segmented into direct and indirect. The indirect segment held the largest market revenue share in 2025 driven by the extensive presence of supermarkets, specialty stores, and e-commerce platforms that offer multiple nut oil varieties. Wide product visibility and retailer-led promotions further support strong consumer reach.
The direct segment is expected to witness the fastest growth rate from 2026 to 2033 driven by rising adoption of brand-owned online stores, farm-to-consumer models, and direct sales channels. Direct distribution enables manufacturers to offer fresher products, assured purity, and competitive pricing. Increasing consumer inclination toward authentic, traceable, and source-verified products is boosting this segment’s expansion.
North America Nut Oil Market Regional Analysis
- U.S. dominated the nut oil market by holding the largest market revenue share in 2025 due to its advanced food processing ecosystem, high consumer awareness regarding functional and nutrient-dense oils, and strong presence of leading manufacturers
- The increasing use of nut oils in health-focused foods, personal care formulations, and aromatherapy products continues to boost market demand
- A well-established retail network and rising preference for premium natural oils further reinforce its leadership
Canada Nut Oil Market Insight
Canada is expected to witness the fastest growth rate from 2026 to 2033, driven by increasing consumer awareness regarding the health benefits of nut-based oils. The rising popularity of natural, organic, and cold-pressed oils is encouraging manufacturers to expand their product offerings across food, skincare, and aromatherapy segments. Growth in artisanal and small-batch production, combined with supportive clean-label trends, is further shaping consumer preferences. In addition, the expansion of retail and online channels is making specialty nut oils more accessible, accelerating overall market growth
North America Nut Oil Market Share
The North America nut oil industry is primarily led by well-established companies, including:
- ADM – Archer Daniels Midland (U.S.)
- Bunge Limited (U.S.)
- Cargill, Incorporated (U.S.)
- La Tourangelle, Inc. (U.S.)
- Spectrum Organics – Part of Hain Celestial Group (U.S.)
- Nutiva, Inc. (U.S.)
- NOW Health Group / NOW Foods (U.S.)
- Caloy Company LP (U.S.)
- Richardson International Limited (Canada)
- Ventura Foods (U.S.)
SKU-

- Interactive Data Analysis Dashboard
- Company Analysis Dashboard for high growth potential opportunities
- Research Analyst Access for customization & queries
- Competitor Analysis with Interactive dashboard
- Latest News, Updates & Trend analysis
- Harness the Power of Benchmark Analysis for Comprehensive Competitor Tracking
North America Nut Oil Market, Supply Chain Analysis and Ecosystem Framework
To support market growth and help clients navigate the impact of geopolitical shifts, DBMR has integrated in-depth supply chain analysis into its North America Nut Oil Market research reports. This addition empowers clients to respond effectively to global changes affecting their industries. The supply chain analysis section includes detailed insights such as North America Nut Oil Market consumption and production by country, price trend analysis, the impact of tariffs and geopolitical developments, and import and export trends by country and HSN code. It also highlights major suppliers with data on production capacity and company profiles, as well as key importers and exporters. In addition to research, DBMR offers specialized supply chain consulting services backed by over a decade of experience, providing solutions like supplier discovery, supplier risk assessment, price trend analysis, impact evaluation of inflation and trade route changes, and comprehensive market trend analysis.
Data collection and base year analysis are done using data collection modules with large sample sizes. The stage includes obtaining market information or related data through various sources and strategies. It includes examining and planning all the data acquired from the past in advance. It likewise envelops the examination of information inconsistencies seen across different information sources. The market data is analysed and estimated using market statistical and coherent models. Also, market share analysis and key trend analysis are the major success factors in the market report. To know more, please request an analyst call or drop down your inquiry.
The key research methodology used by DBMR research team is data triangulation which involves data mining, analysis of the impact of data variables on the market and primary (industry expert) validation. Data models include Vendor Positioning Grid, Market Time Line Analysis, Market Overview and Guide, Company Positioning Grid, Patent Analysis, Pricing Analysis, Company Market Share Analysis, Standards of Measurement, Global versus Regional and Vendor Share Analysis. To know more about the research methodology, drop in an inquiry to speak to our industry experts.
Data Bridge Market Research is a leader in advanced formative research. We take pride in servicing our existing and new customers with data and analysis that match and suits their goal. The report can be customized to include price trend analysis of target brands understanding the market for additional countries (ask for the list of countries), clinical trial results data, literature review, refurbished market and product base analysis. Market analysis of target competitors can be analyzed from technology-based analysis to market portfolio strategies. We can add as many competitors that you require data about in the format and data style you are looking for. Our team of analysts can also provide you data in crude raw excel files pivot tables (Fact book) or can assist you in creating presentations from the data sets available in the report.


