
North America Ocular Pain Market
Market Size in USD Million
 USD
541.88 Million
USD
1,048.43 Million
2025
2033
USD
541.88 Million
USD
1,048.43 Million
2025
2033
| 2026 - 2033 | |
| USD 541.88 Million | |
| USD 1,048.43 Million | |
| % | |
|
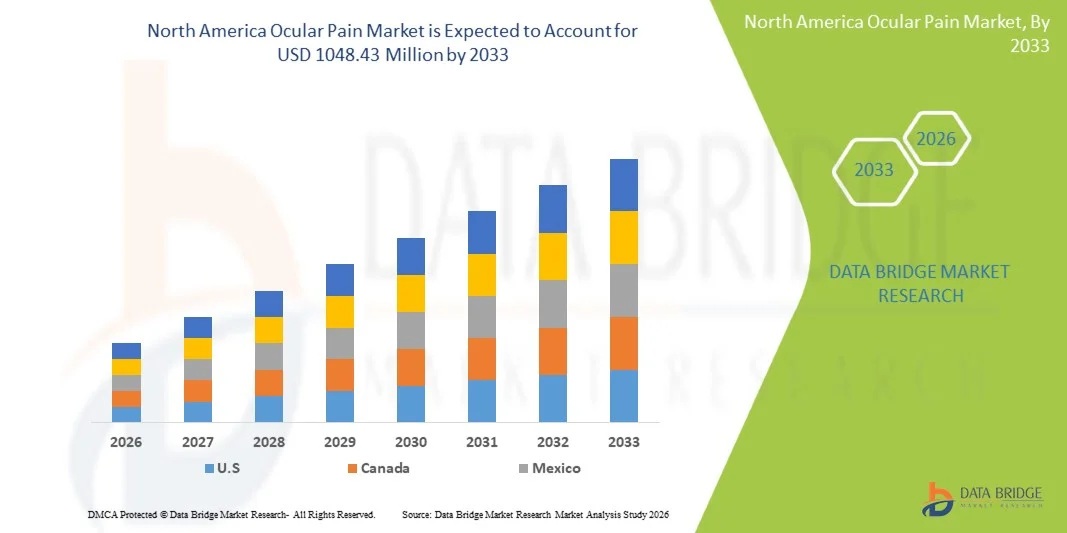
North America Ocular Pain Market Size
- The North America Ocular Pain Market size was valued at USD 541.88 Million in 2025 and is expected to reach USD 1048.43 Million by 2033, at a CAGR of 8.60% during the forecast period
- The market growth is largely fueled by the rising prevalence of eye-related disorders, increasing screen time, environmental pollution, and a growing aging population, all of which are contributing to a higher incidence of ocular pain in both developed and developing regions
- Furthermore, increasing awareness about eye health, improved access to ophthalmic care, and continuous advancements in diagnostic and therapeutic technologies are driving the demand for effective Ocular Pain treatment solutions, thereby significantly boosting the industry’s overall growth
North America Ocular Pain Market Analysis
- Ocular Pain, referring to discomfort, soreness, or irritation in and around the eye caused by conditions such as dry eye syndrome, infections, inflammation, migraine-associated pain, and neurological disorders, has become a growing concern in both clinical and home-care settings due to increased digital screen exposure, environmental pollutants, and lifestyle-related eye strain
- The escalating demand for ocular pain treatment solutions is primarily fueled by the rising prevalence of chronic eye conditions, extended use of digital devices, increasing geriatric population, and improved awareness of eye health management among consumers worldwide
- The U.S. dominated the North America Ocular Pain Market with the largest revenue share of 37.6% in 2025, supported by advanced healthcare infrastructure, high patient awareness, widespread access to ophthalmologists, and strong presence of key pharmaceutical and medical device manufacturers developing innovative ocular therapeutics
- Canada is expected to be the fastest-growing region in the North America Ocular Pain Market, registering a CAGR of 8.9% during the forecast period, driven by rising investments in healthcare, increasing aging population, improved access to vision care services, and growing adoption of advanced treatment options
- The Treatment segment dominated the largest market revenue share of 68.9% in 2025, as a majority of patients experiencing ocular pain directly seek relief through medication or therapeutic intervention
Report Scope and North America Ocular Pain Market Segmentation
|
Attributes |
North America Ocular Pain Key Market Insights |
|
Segments Covered |
|
|
Countries Covered |
North America
|
|
Key Market Players |
|
|
Market Opportunities |
|
|
Value Added Data Infosets |
In addition to the insights on market scenarios such as market value, growth rate, segmentation, geographical coverage, and major players, the market reports curated by the Data Bridge Market Research also include in-depth expert analysis, patient epidemiology, pipeline analysis, pricing analysis, and regulatory framework. |
North America Ocular Pain Market Trends
“Advancements in Targeted Ophthalmic Therapies and Personalized Pain Management”
- A significant and accelerating trend in the North America Ocular Pain Market is the growing emphasis on targeted ophthalmic therapies and personalized treatment approaches designed to manage chronic and acute eye pain more effectively. Increasing understanding of the underlying inflammatory and neuropathic mechanisms associated with ocular pain has led to the development of more specialized medications and treatment regimens
- For instance, prescription eye drops containing anti-inflammatory agents, corticosteroids, and cyclosporine are increasingly being used to treat pain associated with dry eye disease, post-surgical irritation, and corneal damage. Similarly, the introduction of biologic treatments for autoimmune-related ocular inflammation is providing improved outcomes for patients suffering from persistent eye pain caused by conditions such as uveitis and scleritis
- The use of combination therapies, including lubricating eye drops, oral NSAIDs, and immunomodulatory drugs, is gaining traction as they address multiple causes of pain simultaneously. These therapies are being tailored based on the severity of symptoms, duration of discomfort, and underlying clinical condition, allowing clinicians to design more personalized treatment plans for patients
- In addition, the integration of advanced diagnostic technologies, such as corneal imaging and tear film analysis, is enabling ophthalmologists to identify the specific source of pain more accurately. This helps reduce trial-and-error prescribing and improves overall treatment success rates, particularly in patients with chronic ocular surface disorders
- The growing demand for non-invasive and long-acting pain relief solutions has also led to a surge in the development of sustained-release ophthalmic formulations and preservative-free eye drops, which reduce irritation and improve patient comfort
- This trend towards customized, science-driven, and patient-centric treatment approaches is fundamentally reshaping the management of ocular pain. As a result, pharmaceutical companies are investing heavily in research and development to introduce innovative therapies that provide faster relief, longer duration of action, and fewer side effects
- With increasing screen time, environmental pollution, and rising prevalence of eye disorders, the demand for advanced ocular pain management solutions is expected to grow steadily across both clinical and home-care settings in North America
North America Ocular Pain Market Dynamics
Driver
“Rising Prevalence of Eye Disorders and Increasing Treatment Awareness”
- The increasing prevalence of eye disorders such as dry eye syndrome, conjunctivitis, glaucoma, diabetic retinopathy, and post-surgical inflammation is a major driver of the growing demand for ocular pain treatments in North America. Prolonged exposure to digital screens, environmental pollutants, and aging populations are significantly contributing to chronic eye discomfort and irritation
- For instance, in May 2024, several ophthalmology associations across North America intensified public awareness campaigns highlighting the risks of prolonged digital screen exposure and its link to ocular surface damage, encouraging early diagnosis and treatment of ocular discomfort and pain. Such initiatives are expected to accelerate market growth during the forecast period
- As patients become more aware of the consequences of untreated eye pain, there is a greater willingness to seek medical attention and invest in prescription and OTC eye care products. This increased awareness is driving demand for analgesic eye drops, anti-inflammatory medications, and lubricants
- Furthermore, the rising number of ophthalmic surgeries, including LASIK and cataract procedures, has increased the need for post-operative pain management, contributing to higher consumption of ocular pain relief products. Hospitals and clinics are continuously upgrading their treatment protocols to incorporate more effective pain control therapies
- The expanding availability of advanced pharmaceutical formulations, improved access to eye care specialists, and increased healthcare spending in the region are also supporting the growth of the North America Ocular Pain Market across residential, clinical, and institutional settings
Restraint/Challenge
“Side Effects, Limited Long-Term Use, and High Cost of Advanced Therapies”
- Despite the growing demand, the North America Ocular Pain Market faces significant challenges due to the potential side effects associated with long-term use of corticosteroids and NSAIDs, including increased intraocular pressure, cataract formation, and corneal complications. These risks often limit prolonged treatment, especially in chronic cases
- In addition, certain patients develop tolerance or reduced responsiveness to commonly prescribed medications, making pain management increasingly difficult. This creates a need for more complex and expensive combination therapies, which may not be affordable for all patient groups
- For instance, patients who use corticosteroid eye drops for extended periods often require continuous monitoring due to the risk of developing secondary glaucoma, which increases both clinical burden and overall treatment costs. This acts as a restraint on widespread long-term use
- The high cost of advanced biologics and novel drug formulations also restricts accessibility, particularly for uninsured or underinsured patients. While these therapies offer improved outcomes, their premium pricing can significantly limit adoption in cost-sensitive populations
- Moreover, the lack of awareness in certain rural and underserved regions causes delayed diagnosis and improper treatment, worsening symptoms and reducing the effectiveness of available therapies
- Overcoming these challenges will require the development of safer long-term alternatives, cost-effective generics, and improved patient education programs to ensure sustained growth of the ocular pain treatment market
North America Ocular Pain Market Scope
The market is segmented on the basis of disease type, type, application, route of administration, drug type, population type, end user, and distribution channel.
• By Disease Type
On the basis of disease type, the North America Ocular Pain Market is segmented into Ocular Pain with Eye Diseases and Ocular Pain without Primary Eye Diseases. The Ocular Pain with Eye Diseases segment dominated the largest market revenue share of 62.4% in 2025, driven by the high prevalence of conditions such as conjunctivitis, corneal abrasions, glaucoma, uveitis, dry eye syndrome, and infections that directly cause discomfort and pain in the eye. These conditions often require immediate medical attention and consistent therapeutic intervention to reduce inflammation, relieve pain, and prevent vision loss. A growing aging population, increased screen time, rising incidence of eye infections, and chronic disorders such as glaucoma contribute significantly to this segment’s growth. Patients experiencing visual impairment or ocular inflammation are more likely to seek professional treatment, increasing demand for diagnostic procedures and therapeutic drugs. Improved diagnostic technologies in ophthalmology are aiding early identification of eye-related causes of pain, further increasing treatment uptake. The growing number of hospital admissions linked to eye trauma, corneal damage, and postoperative pain after ophthalmic procedures is also strengthening this segment. Increased accessibility to eye care services in urban areas and awareness campaigns about ocular health are supporting growth. Additionally, the expansion of ophthalmology departments across hospitals is contributing to a higher treatment rate. These combined factors firmly position this segment as the market leader.
The Ocular Pain without Primary Eye Diseases segment is expected to witness the fastest CAGR of 8.6% from 2026 to 2033, driven by increasing diagnosis of referred pain caused by migraines, sinusitis, neurological disorders, and systemic inflammatory conditions. This type of pain does not originate directly from eye disease but significantly affects ocular comfort, driving patients to seek ophthalmological and neurological consultation. Growing awareness about neuropathic and referred ocular pain is encouraging more targeted diagnosis and specialized treatment approaches. As headache disorders, migraine prevalence, and sinus-related complications continue to rise globally, this segment gains significant traction. Technological advancements in imaging and pain diagnosis allow improved differentiation between primary and referred eye pain. Increasing collaboration between neurologists, ENT specialists, and ophthalmologists is improving overall pain management. Enhanced access to healthcare and better recognition of non-ocular causes of eye pain are accelerating growth. Increasing prescriptions of non-opioid analgesics and neurological drugs are supporting market expansion. Further, rising patient awareness and improved reporting of symptoms will continue to push growth during the forecast period.
• By Type
On the basis of type, the North America Ocular Pain Market is segmented into Diagnosis and Treatment. The Treatment segment dominated the largest market revenue share of 68.9% in 2025, as a majority of patients experiencing ocular pain directly seek relief through medication or therapeutic intervention. This includes the use of anti-inflammatory drugs, lubricating eye drops, antibiotics, antivirals, analgesics, and corticosteroids that effectively manage underlying causes. The rising prevalence of chronic disorders such as dry eye disease, glaucoma, and uveitis is significantly driving demand for continuous treatment. Increasing cases of eye allergies due to pollution and environmental changes also contribute to the growing reliance on pharmaceutical management. Post-surgical ophthalmic pain relief is another key factor expanding this segment. Pharmaceutical companies continue to launch improved drug formulations with better efficacy and fewer side effects. The expansion of retail and online pharmacies has made treatments more accessible. Increased physician reliance on drug-based interventions rather than observation alone is another supporting factor. Growing awareness about early symptom management is also increasing treatment demand.
The Diagnosis segment is expected to witness the fastest CAGR of 9.3% from 2026 to 2033, due to rapid advancements in ophthalmic diagnostic technologies such as optical coherence tomography, slit-lamp examinations, and advanced imaging systems. Early and accurate diagnosis is becoming increasingly critical for preventing complications such as vision loss. Rising awareness of preventive eye care is encouraging more individuals to undergo routine screenings and diagnostic evaluations. Government and NGO initiatives promoting eye health check-ups are accelerating adoption. The establishment of specialty ophthalmology clinics and diagnostic centers is expanding access to testing services. Continuous improvements in AI-powered diagnostic tools (for imaging analysis only, not referenced in integration) improve detection rates. Increasing investment in ophthalmic research is developing more precise diagnostic devices. Growth in the geriatric population, who are more susceptible to eye conditions, further accelerates demand for regular diagnostic assessments.
• By Application
On the basis of application, the North America Ocular Pain Market is segmented into Conjunctivitis, Corneal Abrasion, Blepharitis, Sty, Iritis, Sinusitis, Migraines, Glaucoma, and Others. The Conjunctivitis segment dominated the largest market revenue share of 35.7% in 2025, owing to its extremely high prevalence across all age groups and its strong association with ocular pain, irritation, redness, and discomfort. Both bacterial and viral conjunctivitis contribute significantly to outpatient visits in hospitals and clinics. Seasonal allergies and environmental pollutants further intensify the incidence rate, leading to increased demand for antibiotics, antihistamines, and anti-inflammatory drugs. School-aged children and working adults are especially affected, contributing to higher treatment volumes. The contagious nature of conjunctivitis encourages early medical intervention, which strengthens pharmaceutical demand. Rising awareness regarding eye hygiene and infection control is increasing the number of diagnosed cases. Healthcare systems across developing and developed regions report a steady rise in conjunctivitis-related consultations. Accessibility of over-the-counter medications is also driving this segment’s strong dominance. In addition, improved diagnostic measures are helping identify conjunctivitis faster, resulting in quicker treatment initiation and sustained market leadership.
The Migraines segment is expected to witness the fastest CAGR of 9.8% from 2026 to 2033, driven by the increasing global burden of neurological disorders and stress-related conditions. Ocular pain is a frequent symptom associated with migraine attacks, leading many patients to seek targeted treatment. Lifestyle changes, higher screen exposure, irregular sleep patterns, and rising work-related stress contribute to the growing prevalence of migraines worldwide. Improved recognition of eye-related migraine symptoms by healthcare professionals is accelerating diagnosis. The integration of multidisciplinary care involving neurologists and ophthalmologists is resulting in better management of ocular migraine pain. Increased demand for preventive migraine therapies and pain management medications supports this segment’s expansion. Growing awareness through health campaigns is also encouraging patients to seek proper treatment. Continuous pharmaceutical innovations targeting neurological pathways further contribute to high projected growth.
• By Route of Administration
On the basis of route of administration, the North America Ocular Pain Market is segmented into Topical, Periocular, Intraocular, and Oral. The Topical segment dominated the largest market revenue share of 48.5% in 2025, driven by the widespread use of eye drops, gels, and ointments for directly treating local ocular pain. Topical formulations are highly preferred due to their fast-acting nature, ease of use, and minimal systemic side effects. They are commonly prescribed for conditions such as conjunctivitis, dry eye disease, corneal abrasions, and blepharitis. Increased availability of preservative-free and long-lasting formulations is encouraging higher adoption. Patients prefer topical drugs because they are non-invasive and can be self-administered at home. Technological advancements in drug delivery systems have improved absorption and effectiveness. Rising awareness of early eye treatment is increasing reliance on topical therapies. Healthcare providers often choose this route as the first line of treatment, making it the dominant segment. Growing production of topical medications by pharmaceutical companies further strengthens its market position.
The Oral segment is expected to witness the fastest CAGR of 8.9% from 2026 to 2033, largely due to increased incidence of ocular pain caused by systemic and neurological conditions such as sinusitis and migraines. Oral analgesics, anti-inflammatory agents, and antibiotics play a crucial role in managing referred or widespread pain. Patients with chronic conditions often require long-term oral medication, increasing overall demand. Growing patient preference for non-invasive and convenient therapy methods is also contributing to this rise. Increased prescription rates for neuropathic pain drugs are boosting segment growth. Oral drugs are easily accessible through both prescription and over-the-counter channels, supporting wider use. Improvements in drug safety profiles are encouraging physicians to recommend oral agents more frequently. The expansion of telemedicine and e-prescription services is further simplifying access to oral treatments.
• By Drug Type
On the basis of drug type, the North America Ocular Pain Market is segmented into Prescription and Over-the-Counter (OTC). The Prescription segment dominated the largest market revenue share of 64.3% in 2025, due to the critical role of antibiotics, corticosteroids, and specialized anti-inflammatory drugs used in moderate to severe ocular conditions. Complex eye disorders such as glaucoma, iritis, corneal injury, and infections require professional diagnosis and prescription-based therapy. Patients undergoing surgical procedures or suffering from chronic eye conditions are more reliant on physician-guided treatment. The increasing rate of ophthalmic surgeries and advanced treatments supports high prescription demand. Introduction of newer branded ophthalmic drugs with improved efficacy further strengthens the segment. Prescription medications are also essential for controlling complications and preventing vision loss. Hospitals and specialty clinics routinely use prescription drugs, boosting overall market volume. Strong regulatory control ensures trust and credibility, pushing higher adoption rates. The expansion of health insurance coverage for prescription medications also contributes to dominance.
The OTC segment is expected to witness the fastest CAGR of 10.1% from 2026 to 2033, driven by a growing preference for self-care and early symptom management. Mild ocular pain, irritation, and dryness are increasingly being treated using OTC lubricants, antihistamines, and pain-relief drops. Rising consumer awareness about eye health and easy availability of products at retail and online pharmacies are pushing growth. Busy lifestyles and limited access to immediate consultation encourage OTC use. Increased branding and marketing of eye-care products are also expanding consumer trust. Improved formulation quality has made OTC products more effective and safe for frequent usage. Growth in digital health information and self-diagnosis trends further boosts adoption. This segment also benefits from reduced consultation costs and convenience, making it highly attractive, especially in developing regions.
• By Population Type
On the basis of population type, the North America Ocular Pain Market is segmented into Adults and Geriatric. The Adults segment dominated the largest market revenue share of 57.8% in 2025, primarily due to higher exposure to digital screens, environmental pollution, workplace eye strain, and lifestyle-related eye conditions. Increasing prevalence of dry eye, allergies, corneal injuries, and infections is common in the working-age population. Long screen hours and digital fatigue significantly contribute to ocular discomfort. Higher health-seeking behavior among adults also increases diagnosis and treatment rates. Rise in contact lens usage is another key factor increasing ocular complications. The adult population is more likely to invest in treatments for fast recovery due to work productivity concerns. Better access to healthcare services and stronger awareness about eye health further support segment leadership. Adults are also more prone to migraines and sinus-related ocular pain. These combined elements keep this group as the dominant consumer of ocular pain therapies.
The Geriatric segment is expected to witness the fastest CAGR of 9.4% from 2026 to 2033, driven by the rapidly aging global population and the increasing prevalence of age-related eye diseases. Conditions such as glaucoma, cataracts (post-surgery pain), macular degeneration, and chronic dry eye are highly common in elderly individuals. Declining immune function makes older adults more susceptible to infections and inflammation. Frequent need for ophthalmic surgeries in geriatrics increases post-operative pain management requirements. Growing healthcare investments in elderly care further strengthen demand. Governments worldwide are implementing geriatric eye care programs, supporting this trend. Increased life expectancy also expands the target base for continuous treatment. Family members and caregivers are increasingly seeking specialized treatment for elderly patients, supporting consistent market growth.
• By End User
On the basis of end user, the North America Ocular Pain Market is segmented into Hospitals, Specialty Clinics, Home Healthcare Settings, Ophthalmology Centers, Ambulatory Surgical Centers, and Others. The Hospitals segment dominated the largest market revenue share of 41.6% in 2025, due to the availability of advanced diagnostic and treatment facilities under one roof. Severe ocular pain cases, eye trauma, and post-surgical conditions are primarily managed in hospital settings. Presence of specialized ophthalmologists, neurologists, and surgical teams drives higher patient volume. Emergency eye care services are more accessible in hospitals, increasing patient dependence on these institutions. Advanced infrastructure enables accurate diagnosis and timely treatment. Hospitals also handle the majority of government-funded and insured patients, boosting their financial share. Growing urbanization and infrastructure development in the healthcare sector further increase hospital accessibility. Rising number of ophthalmic procedures also strengthens this segment. Strong trust among patients ensures continued dominance.
The Ophthalmology Centers segment is expected to witness the fastest CAGR of 10.3% from 2026 to 2033, driven by the increasing demand for specialized and focused eye care services. These centers are equipped with dedicated professionals and cutting-edge technology for diagnosing and treating ocular pain more efficiently. Growing preference for specialized care over general hospitals is accelerating patient flow into such facilities. Faster appointment availability and shorter waiting periods also contribute to their rising popularity. Expansion of private ophthalmology chains and franchise models is further driving growth. Increased investments in modern diagnostic equipment are improving patient outcomes. Medical tourism for eye-care is also benefiting specialty centers. Personalized treatment plans in such settings make them highly attractive for long-term management of chronic ocular conditions.
• By Distribution Channel
On the basis of distribution channel, the North America Ocular Pain Market is segmented into Direct Tender, Hospital Pharmacy, Retail Pharmacy, Online Pharmacy, and Others. The Hospital Pharmacy segment dominated the largest market revenue share of 39.2% in 2025, as most prescription medications for ocular pain are dispensed directly within hospitals. This is especially common for surgical patients and those requiring emergency care. Strong integration between diagnosis and treatment enables immediate access to required drugs. Hospital pharmacies stock a wide range of specialized ocular medications, including injectables and advanced formulations. Controlled distribution and professional supervision ensure correct usage. Increased number of hospital admissions for eye-related issues strengthens this channel. Institutional procurement through tenders also ensures steady product supply. Physicians often recommend drugs directly available in hospital pharmacies, enhancing sales volume. This convenience and reliability keep hospital pharmacies as the dominant channel.
The Online Pharmacy segment is expected to witness the fastest CAGR of 11.5% from 2026 to 2033, driven by rapid digitalization and increasing preference for home delivery of medications. Rising smartphone usage and internet penetration are making it easier for patients to order eye medications online. Chronic patients requiring repeat medications prefer online refill options. Competitive pricing, discounts, and doorstep delivery make online channels highly attractive. Growth of e-prescription systems is also boosting the use of digital platforms. Improved trust in online pharmaceutical services further fuels demand. Expansion of verified and regulated online pharmacies is enhancing safety and acceptance. This shift toward digital healthcare solutions is expected to drive strong, long-term growth in this segment.
North America Ocular Pain Market Regional Analysis
- North America dominated the North America Ocular Pain Market with the largest revenue share in 2025
- Driven by advanced healthcare systems, high patient awareness regarding eye health, widespread availability of diagnostic facilities, and strong presence of leading pharmaceutical and ophthalmic device manufacturers
- Increasing prevalence of eye disorders such as dry eye syndrome, glaucoma, and post-surgical ocular pain has further accelerated the demand for effective treatment options across the region
U.S. North America Ocular Pain Market Insight
The U.S. North America Ocular Pain Market dominated the North America Ocular Pain Market with a revenue share of 37.6% in 2025, supported by well-established healthcare infrastructure, widespread access to trained ophthalmologists, high healthcare spending, and the presence of major companies focused on developing innovative ocular therapeutics and advanced pain management solutions. Rising cases of digital eye strain, age-related eye conditions, and post-operative eye pain are also significantly contributing to market growth in the country.
Canada North America Ocular Pain Market Insight
Canada North America Ocular Pain Market is expected to be the fastest-growing country in the North America Ocular Pain Market, registering a CAGR of 8.9% during the forecast period. This growth is attributed to rising investments in healthcare infrastructure, an increasing aging population prone to chronic eye conditions, improved access to vision care services, and growing awareness about early diagnosis and advanced treatment options for ocular pain.
North America Ocular Pain Market Share
The Ocular Pain industry is primarily led by well-established companies, including:
- Alcon Inc. (Switzerland)
- Santen Pharmaceutical Co., Ltd. (Japan)
- Sun Pharmaceutical Industries Ltd. (India)
- Teva Pharmaceutical Industries Ltd. (Israel)
- Bayer AG (Germany)
- Otsuka Pharmaceutical Co., Ltd. (Japan)
- Merck & Co., Inc. (U.S.)
- AbbVie Inc. (U.S.)
- Aurobindo Pharma Ltd. (India)
- Cipla Ltd. (India)
- Perrigo Company plc (Ireland)
- Regeneron Pharmaceuticals, Inc. (U.S.)
- Horizon Therapeutics (Ireland)
- Dr. Reddy’s Laboratories (India)
- Hikma Pharmaceuticals PLC (U.K.)
Latest Developments in North America Ocular Pain Market
- In October 2021, the U.S. Food and Drug Administration approved TYRVAYA™ (varenicline solution) nasal spray for the treatment of signs and symptoms of dry eye disease, introducing the first FDA-approved nasally administered therapy for this condition and offering an important alternative for patients who struggle with traditional eye drop administration, thereby expanding treatment options for ocular discomfort
- In October 2021, the FDA approved a supplemental indication for DEXTENZA® (dexamethasone intracanalicular insert) to include treatment of ocular itching associated with allergic conjunctivitis, in addition to its existing use in post-surgical ocular pain and inflammation, strengthening the role of sustained-release ocular drug delivery systems in managing eye-related discomfort
- In November 2022 (with the transaction completed in January 2023), Viatris announced and finalized the acquisition of Oyster Point Pharma, the developer of TYRVAYA, establishing a dedicated Eye Care business segment aimed at expanding its presence in the North American ophthalmology market and improving the commercial reach of innovative therapies addressing ocular surface pain and discomfort
- In November 2024, Aldeyra Therapeutics announced that the FDA accepted its New Drug Application for reproxalap, a novel topical therapy being developed for dry eye disease, and assigned a regulatory review timeline, highlighting one of the most closely followed late-stage developments in treatments targeting inflammation-driven ocular pain
- In April 2025, the FDA issued a Complete Response Letter for reproxalap, stating that additional clinical evidence was required to demonstrate sufficient efficacy, leading the company to outline plans for further trials and resubmission, reflecting the strict regulatory standards applied to new treatments in the ocular pain and dry eye segment
- In May 2025, Alcon received FDA approval for TRYPTYR (acoltremon ophthalmic solution) 0.003% for the treatment of signs and symptoms of dry eye disease, strengthening its ophthalmic portfolio and highlighting continued innovation in therapies that target irritation, discomfort, and inflammatory components of ocular pain
SKU-

- Interactive Data Analysis Dashboard
- Company Analysis Dashboard for high growth potential opportunities
- Research Analyst Access for customization & queries
- Competitor Analysis with Interactive dashboard
- Latest News, Updates & Trend analysis
- Harness the Power of Benchmark Analysis for Comprehensive Competitor Tracking
Data collection and base year analysis are done using data collection modules with large sample sizes. The stage includes obtaining market information or related data through various sources and strategies. It includes examining and planning all the data acquired from the past in advance. It likewise envelops the examination of information inconsistencies seen across different information sources. The market data is analysed and estimated using market statistical and coherent models. Also, market share analysis and key trend analysis are the major success factors in the market report. To know more, please request an analyst call or drop down your inquiry.
The key research methodology used by DBMR research team is data triangulation which involves data mining, analysis of the impact of data variables on the market and primary (industry expert) validation. Data models include Vendor Positioning Grid, Market Time Line Analysis, Market Overview and Guide, Company Positioning Grid, Patent Analysis, Pricing Analysis, Company Market Share Analysis, Standards of Measurement, Global versus Regional and Vendor Share Analysis. To know more about the research methodology, drop in an inquiry to speak to our industry experts.
Data Bridge Market Research is a leader in advanced formative research. We take pride in servicing our existing and new customers with data and analysis that match and suits their goal. The report can be customized to include price trend analysis of target brands understanding the market for additional countries (ask for the list of countries), clinical trial results data, literature review, refurbished market and product base analysis. Market analysis of target competitors can be analyzed from technology-based analysis to market portfolio strategies. We can add as many competitors that you require data about in the format and data style you are looking for. Our team of analysts can also provide you data in crude raw excel files pivot tables (Fact book) or can assist you in creating presentations from the data sets available in the report.


