
North America Operational Technology Market
Market Size in USD Billion
 USD
8.44 Billion
USD
13.87 Billion
2025
2033
USD
8.44 Billion
USD
13.87 Billion
2025
2033
| 2026 - 2033 | |
| USD 8.44 Billion | |
| USD 13.87 Billion | |
| % | |
|
What is the North America Operational Technology Market Size and Growth Rate?
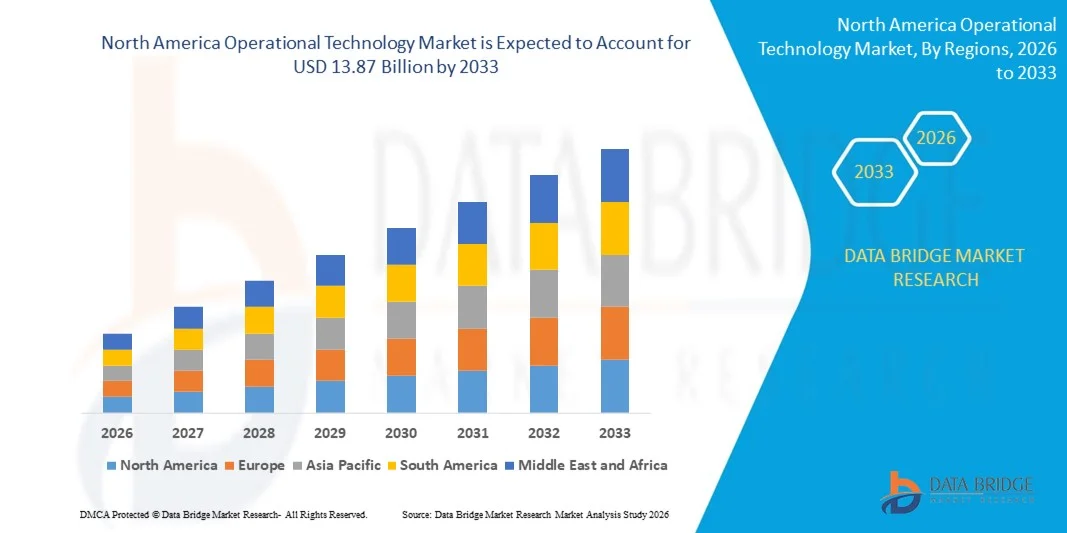
- The North America operational technology market size was valued at USD 8.44 billion in 2025 and is expected to reach USD 13.87 billion by 2033, at a CAGR of 6.40% during the forecast period
- The increase in demand for operational technology among utility companies acts as one of the major factors driving the growth of operational technology market. These are being deployed due to their benefits such as cost-saving, environmental protection and safety improvement
What are the Major Takeaways of Operational Technology Market?
- The increase in the use of operational technology due to continuous technological advancements along with lower power consumption accelerate the market growth
- The surge in the popularity of the technology owing to its characteristics such as added convenience, increased productivity and better reliability and quality has a positive impact on the market
- The U.S. dominated the North America operational technology market with the largest revenue share of 38.6% in 2024, supported by its strong industrial automation ecosystem, advanced manufacturing capabilities, and substantial investments in digital transformation and critical infrastructure protection
- Canada is witnessing the fastest growth rate of 10.84% in North America, driven by expanding renewable energy projects, industrial automation upgrades, and rising cybersecurity investments across utilities and transportation sectors
- The Hardware segment dominated the market with a 46.3% revenue share in 2024, owing to widespread deployment of industrial controllers, sensors, switches, gateways, and edge devices across manufacturing plants, utilities, and critical infrastructure
Report Scope and Operational Technology Market Segmentation
|
Attributes |
Operational Technology Key Market Insights |
|
Segments Covered |
|
|
Countries Covered |
North America
|
|
Key Market Players |
|
|
Market Opportunities |
|
|
Value Added Data Infosets |
In addition to the insights on market scenarios such as market value, growth rate, segmentation, geographical coverage, and major players, the market reports curated by the Data Bridge Market Research also include in-depth expert analysis, pricing analysis, brand share analysis, consumer survey, demography analysis, supply chain analysis, value chain analysis, raw material/consumables overview, vendor selection criteria, PESTLE Analysis, Porter Analysis, and regulatory framework. |
What is the Key Trend in the Operational Technology Market?
Rising Convergence of IT and OT with Cybersecure Industrial Platforms
- The global shift toward digital transformation is accelerating the convergence of Information Technology (IT) and Operational Technology (OT), enabling real-time monitoring, predictive analytics, and centralized control of industrial assets. Organizations are integrating cloud platforms, edge computing, and industrial IoT to enhance visibility and decision-making across production environments
- Industries are increasingly deploying cybersecure OT platforms to protect critical infrastructure from rising ransomware and targeted cyberattacks. Secure remote access, network segmentation, and zero-trust architectures are becoming standard across manufacturing, energy, and utilities sectors
- Advanced analytics, AI-driven predictive maintenance, and digital twins are improving operational efficiency while reducing downtime and maintenance costs. These capabilities allow industries to optimize asset performance and extend equipment life cycles
- For instance, Siemens AG and Schneider Electric are expanding secure industrial automation and edge-enabled OT platforms to strengthen real-time monitoring and cybersecurity resilience
- The growing emphasis on connected operations, cybersecurity compliance, and data-driven industrial intelligence is positioning integrated OT platforms at the center of next-generation industrial transformation globally
What are the Key Drivers of Operational Technology Market?
- Rapid industrial automation and smart factory adoption are increasing demand for integrated control systems that enhance productivity, reduce operational downtime, and enable predictive maintenance strategies
- Rising cybersecurity threats targeting critical infrastructure are pushing organizations to invest in advanced OT security solutions, including network monitoring, anomaly detection, and secure access management systems
- Expansion of renewable energy projects, smart grids, and digital substations is reinforcing the need for reliable supervisory control and monitoring platforms across power generation and transmission networks
- For instance, ABB and Honeywell International Inc. provide advanced distributed control systems and cybersecurity-enabled industrial platforms widely deployed in energy, oil & gas, and manufacturing sectors
- As industries modernize legacy infrastructure and adopt Industry 4.0 frameworks, OT solutions are becoming essential for ensuring secure, efficient, and scalable industrial operations
Which Factor is Challenging the Growth of the Operational Technology Market?
- High implementation costs associated with upgrading legacy industrial systems and integrating modern OT platforms present financial challenges, particularly for small and mid-sized enterprises
- Complexity in integrating legacy equipment with modern IT-based architectures often results in compatibility issues, extended deployment timelines, and increased operational risks
- Shortage of skilled cybersecurity and industrial automation professionals limits effective system deployment and ongoing management of advanced OT environments
- For instance, several industrial facilities across emerging economies have delayed OT modernization projects due to budget constraints and lack of in-house cybersecurity expertise, slowing overall adoption rates
- While OT modernization delivers long-term efficiency and resilience benefits, high capital expenditure, integration complexity, and talent shortages continue to restrain rapid market penetration
How is the Operational Technology Market Segmented?
The market is segmented on the basis of component, deployment, organization size, connectivity, technology, and end-user.
- By Component
On the basis of component, the Operational Technology market is segmented into Hardware, Software/Platform, and Services. The Hardware segment dominated the market with a 46.3% revenue share in 2024, owing to widespread deployment of industrial controllers, sensors, switches, gateways, and edge devices across manufacturing plants, utilities, and critical infrastructure. Industrial facilities continue to invest heavily in physical automation equipment to modernize legacy systems and enable real-time monitoring.
The Software/Platform segment is expected to witness the fastest growth rate from 2025 to 2032, driven by increasing adoption of industrial IoT platforms, cybersecurity solutions, predictive maintenance software, and cloud-based analytics tools that enhance operational visibility and decision-making.
- By Deployment
On the basis of deployment, the market is segmented into On Premise, Hybrid, and Cloud. The On Premise segment held the largest revenue share of 49.7% in 2024, supported by high security requirements, regulatory compliance needs, and the critical nature of industrial environments where real-time processing and low latency are essential. Many energy, oil & gas, and defense facilities prefer on-premise systems to maintain full control over operational data.
The Hybrid segment is expected to witness the fastest growth rate from 2025 to 2032, as organizations increasingly combine on-site infrastructure with cloud-based analytics to balance security, scalability, and cost efficiency.
- By Organization Size
On the basis of organization size, the market is segmented into Small and Medium Business and Large Enterprises. The Large Enterprises segment dominated with a 61.5% revenue share in 2024, driven by substantial capital investments in automation, cybersecurity, and digital transformation initiatives across manufacturing, utilities, and transportation sectors.
The Small and Medium Business segment is projected to grow at the fastest rate from 2025 to 2032, supported by declining technology costs, government digitalization programs, and increasing awareness of operational efficiency benefits.
- By Connectivity
On the basis of connectivity, the market is segmented into Wired and Wireless. The Wired segment accounted for the largest share of 58.2% in 2024, as industrial environments require stable, secure, and low-latency communication for mission-critical operations. Ethernet-based industrial networks remain the backbone of automation systems.
The Wireless segment is expected to witness the fastest growth rate from 2025 to 2032, driven by adoption of industrial Wi-Fi, 5G, and IoT-enabled remote monitoring systems across smart factories and energy grids.
- By Technology
On the basis of technology, the market is segmented into SCADA, DCS, PCD, PLC, SIS, and BAS. The SCADA segment dominated the market with a 29.4% share in 2024, owing to its extensive use in power generation, water treatment, oil & gas pipelines, and utility monitoring applications.
The Safety Instrumented Systems (SIS) segment is expected to grow at the fastest rate from 2025 to 2032, driven by stricter industrial safety regulations and rising need for risk mitigation in hazardous environments.
- By End-user
On the basis of end-user, the market is segmented into Automotive and Transportation, Building and Infrastructure, Energy and Utilities, Food and Beverage, Life Sciences, Marine and Ports, Metals and Mining, Oil and Gas, Chemicals, Pulp and Paper, and Others. The Energy and Utilities segment held the largest revenue share of 24.8% in 2024, supported by smart grid deployment, renewable integration, and digital substation modernization projects.
The Automotive and Transportation segment is expected to witness the fastest growth rate from 2025 to 2032, driven by smart manufacturing, EV production expansion, and advanced robotics integration across production facilities.
Which Region Holds the Largest Share of the Operational Technology Market?
- The U.S. dominated the North America operational technology market with the largest revenue share of 38.6% in 2024, supported by its strong industrial automation ecosystem, advanced manufacturing capabilities, and substantial investments in digital transformation and critical infrastructure protection. Leadership in aerospace, automotive production, energy management, and smart manufacturing continues to accelerate deployment of advanced OT platforms across production and utility environments
- The country’s emphasis on industrial automation, robotics integration, smart grids, and AI-driven operational analytics significantly drives demand for SCADA, DCS, PLC, and cybersecurity-enabled OT systems across manufacturing, oil & gas, and power generation sectors
- Adoption of secure industrial networks, edge computing solutions, and predictive maintenance platforms enhances operational efficiency and system resilience. Federal cybersecurity initiatives and infrastructure modernization programs further reinforce the U.S.’s leadership within the North America Operational Technology market
Canada Operational Technology Market Insight
Canada is witnessing the fastest growth rate of 10.84% in North America, driven by expanding renewable energy projects, industrial automation upgrades, and rising cybersecurity investments across utilities and transportation sectors. Increasing deployment of industrial IoT platforms, cloud-enabled monitoring systems, and smart grid technologies is accelerating OT adoption. Government-backed digital innovation strategies and infrastructure resilience programs further support long-term market growth.
Mexico Operational Technology Market Insight
Mexico is expanding steadily, supported by growing industrial manufacturing activities, automotive production hubs, and energy sector modernization initiatives. Rising implementation of automated control systems, PLC-based production lines, and industrial cybersecurity solutions is increasing demand for OT platforms. Infrastructure upgrades and nearshoring-driven factory expansions position Mexico as a key growth contributor within the North America Operational Technology market.
Which are the Top Companies in Operational Technology Market?
The operational technology industry is primarily led by well-established companies, including:
- Fortinet, Inc. (U.S.)
- Gray Matter Systems LLC (U.S.)
- Forcepoint (U.S.)
- IBM Corporation (U.S.)
- ABB (Sweden)
- General Electric (U.S.)
- Schneider Electric (France)
- Rockwell Automation, Inc. (U.S.)
- Emerson Electric Co. (U.S.)
- Advantech Co., Ltd. (Taiwan)
- Honeywell International Inc. (U.S.)
- Huawei Technologies Co., Ltd. (China)
- Oracle (U.S.)
- Wipro Limited (India)
- SCADAfence (Ireland)
- SAP SE (Germany)
- Cisco Systems (U.S.)
- Accenture (Ireland)
- Wunderlich-Malec Engineering, Inc. (U.S.)
- Yokogawa Electric Corporation (Japan)
What are the Recent Developments in Global Operational Technology Market?
- In March 2025, Fortinet, Inc. announced major enhancements to its OT Security Platform at the Gartner Digital Workplace Summit in Singapore, strengthening protection for critical infrastructure against evolving cyber threats. The update delivers improved network visibility, advanced segmentation, and secure connectivity tailored for transportation, energy, and manufacturing sectors, reinforcing Fortinet’s leadership in industrial cybersecurity solutions
- In March 2025, TXOne Networks released Version 3.2 of its Stellar solution, expanding its capabilities from endpoint protection to comprehensive detection and response across operational technology environments. The upgrade enhances threat hunting, real-time monitoring, and incident response efficiency, positioning the company strongly within the rapidly evolving OT security landscape
- In March 2025, Armis completed the acquisition of OTORIO to strengthen its cyber exposure management capabilities across OT and Cyber-Physical Systems environments. By integrating OTORIO’s Titan platform into Armis’ Centrix cloud-based platform, the company significantly expands its OT risk mitigation portfolio, accelerating its strategic expansion in industrial cybersecurity markets
- In October 2023, Dragos Inc. expanded its partnership with Rockwell Automation, Inc. to enhance ICS and OT cybersecurity capabilities globally. Through this collaboration, Rockwell made the Dragos Platform available to industrial customers with deployment and support services, strengthening enterprise-level OT threat detection and operational security implementation
- In July 2023, Stellar Cyber launched XDR for operational technology environments as part of its Open XDR Platform, enabling unified threat detection and response across both IT and OT networks. The solution incorporates OT-specific threat detection rules and enhanced network visibility, improving security resilience and protecting interconnected industrial infrastructures against increasingly sophisticated cyberattacks
SKU-

- Interactive Data Analysis Dashboard
- Company Analysis Dashboard for high growth potential opportunities
- Research Analyst Access for customization & queries
- Competitor Analysis with Interactive dashboard
- Latest News, Updates & Trend analysis
- Harness the Power of Benchmark Analysis for Comprehensive Competitor Tracking
North America Operational Technology Market, Supply Chain Analysis and Ecosystem Framework
To support market growth and help clients navigate the impact of geopolitical shifts, DBMR has integrated in-depth supply chain analysis into its North America Operational Technology Market research reports. This addition empowers clients to respond effectively to global changes affecting their industries. The supply chain analysis section includes detailed insights such as North America Operational Technology Market consumption and production by country, price trend analysis, the impact of tariffs and geopolitical developments, and import and export trends by country and HSN code. It also highlights major suppliers with data on production capacity and company profiles, as well as key importers and exporters. In addition to research, DBMR offers specialized supply chain consulting services backed by over a decade of experience, providing solutions like supplier discovery, supplier risk assessment, price trend analysis, impact evaluation of inflation and trade route changes, and comprehensive market trend analysis.
Data collection and base year analysis are done using data collection modules with large sample sizes. The stage includes obtaining market information or related data through various sources and strategies. It includes examining and planning all the data acquired from the past in advance. It likewise envelops the examination of information inconsistencies seen across different information sources. The market data is analysed and estimated using market statistical and coherent models. Also, market share analysis and key trend analysis are the major success factors in the market report. To know more, please request an analyst call or drop down your inquiry.
The key research methodology used by DBMR research team is data triangulation which involves data mining, analysis of the impact of data variables on the market and primary (industry expert) validation. Data models include Vendor Positioning Grid, Market Time Line Analysis, Market Overview and Guide, Company Positioning Grid, Patent Analysis, Pricing Analysis, Company Market Share Analysis, Standards of Measurement, Global versus Regional and Vendor Share Analysis. To know more about the research methodology, drop in an inquiry to speak to our industry experts.
Data Bridge Market Research is a leader in advanced formative research. We take pride in servicing our existing and new customers with data and analysis that match and suits their goal. The report can be customized to include price trend analysis of target brands understanding the market for additional countries (ask for the list of countries), clinical trial results data, literature review, refurbished market and product base analysis. Market analysis of target competitors can be analyzed from technology-based analysis to market portfolio strategies. We can add as many competitors that you require data about in the format and data style you are looking for. Our team of analysts can also provide you data in crude raw excel files pivot tables (Fact book) or can assist you in creating presentations from the data sets available in the report.


