
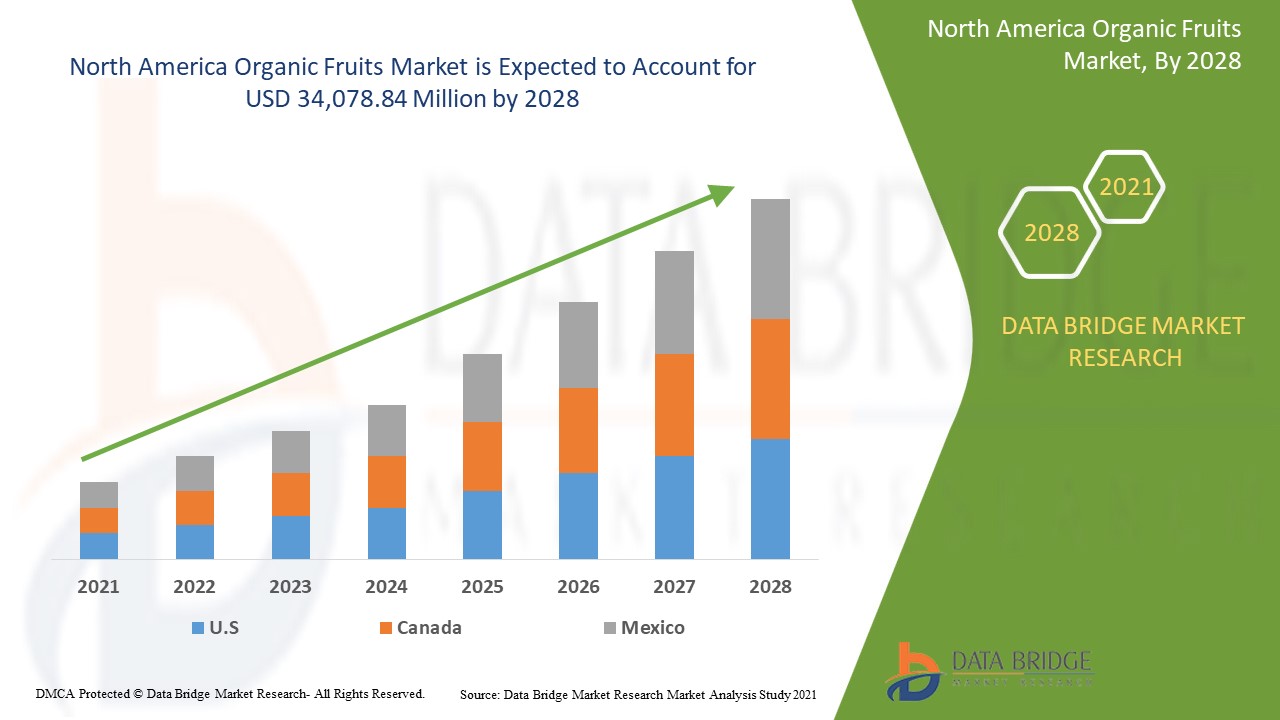
North America Organic Fruits Market
Market Size in USD Billion
 USD
19.71 Billion
USD
46.58 Billion
2024
2032
USD
19.71 Billion
USD
46.58 Billion
2024
2032
| 2025 - 2032 | |
| USD 19.71 Billion | |
| USD 46.58 Billion | |
| % | |
North America Organic Fruits Market Analysis
Organic fruits are produced by the organic farming techniques. Organic food is grown without the use of synthetic chemicals such as fertilizers and pesticides. Also it does not contain genetically modified organisms (GMOs). Organic farming has variety of benefits to the consumers as well as to environment. It helps to improve the quality of soil and the conservation of groundwater. There are various applications of organic fruits in the food & beverages industry which includes the use of organic fruits in the gummies, soft drinks, chocolates, jellies, cakes and pastries among others.
The rising demand for organic food over conventional once, rapid urbanization, increased adoption of healthy dietary lifestyles and rising practices of sustainable farming in order to preserve the environment are driving the growth of the market. The factors which are restraining the growth of the market are the high production cost & low yield, stringent government regulations and limited production of organic fruits over conventional fruits. Improved supply chain of the organic fruits and increasing awareness among the consumers for the health benefits of organic fruits can be the best opportunities for organic Fruits market. High prices of organic fruits over conventional fruits can be the challenge for the market.
This organic fruits market report provides details of market share, new developments, and product pipeline analysis, impact of domestic and localised market players, analyses opportunities in terms of emerging revenue pockets, changes in market regulations, product approvals, strategic decisions, product launches, geographic expansions, and technological innovations in the market. To understand the analysis and the market scenario contact us for an Analyst Brief, our team will help you create a revenue impact solution to achieve your desired goal.
North America Organic Fruits Market Size
North America Organic Fruits Market size was valued at USD 19.71 billion in 2024 and is projected to reach USD 46.58 billion by 2032, with a CAGR of 8.13% during the forecast period of 2025 to 2032.
Report Scope and Market Segmentation
|
Attributes |
Organic Fruits Key Market Insights |
|
Segmentation |
|
|
Countries Covered |
U.S., Canada, Mexico |
|
Key Market Players |
Kerr Concentrates, Greenyard, Z Natural Foods, LLC, Organics Unlimited, General Mills Inc., KOYAH, Dole Food Company Inc, Taylor Farms, Farmer’s Own Organics, Gustav Wulff GmbH, Royal Ridge Fruits, SunOpta, TRADIN ORGANIC AGRICULTURE B.V., and The Kraft Heinz Company |
North America Organic Fruits Market Scope
North America organic fruits market is segmented into three notable segments which are based on type, form, distribution channel and end user. The growth among segments helps you analyse niche pockets of growth and strategies to approach the market and determine your core application areas and the difference in your target markets.
Type
- apple
- Strawberries
- Raspberries
- Blue berries
- Cherry
- Pear
- Grapes
- Kiwi
- Nectarines
- Pineapples
- Mango
- Papaya
- Cantaloupe
- Banana
- Pomegranate
- Watermelon
- Orange
- Peach
- passionfruit
- others
Form
- Fresh
- Frozen
- Diced
- Puree
- powdered
- Others
Distribution Channel
- Direct
- Indirect
End-user
- Household
- Food processing industries
- Food service sector
Organic Fruits Market Regional Level Analysis
Organic fruits market is analysed and market size information is provided by containments, technology and food categories as referenced above.
The countries covered in North America organic fruits market are U.S., Canada and Mexico.
The U.S. is expected to grow with the most promising growth rate in the forecast period of 2021 to 2028 as the major industrialist focusing to develop food and beverages products by organic fruits and increasing its applications. Canada is growing due to rapid urbanization and increased adoption of healthy dietary lifestyle.
The country section of the report also provides individual market impacting factors and changes in regulation in the market domestically that impacts the current and future trends of the market. Data points such as new sales, replacement sales, country demographics, regulatory acts and import-export tariffs are some of the major pointers used to forecast the market scenario for individual countries. Also, presence and availability of global brands and their challenges faced due to large or scarce competition from local and domestic brands, impact of sales channels are considered while providing forecast analysis of the country data.
Rising Demand of Organic Fruits
Organic Fruits market also provides you with detailed market analysis for every country growth in industry with sales, components sales, impact of technological development in Organic Fruits and changes in regulatory scenarios with their support for the organic fruits market. The data is available for historic period 2010 to 2019.
Organic Fruits Market Share
Organic fruits market competitive landscape provides details by competitor. Details included are company overview, company financials, revenue generated, market potential, investment in research and development, new market initiatives, global presence, production sites and facilities, company strengths and weaknesses, product launch, product trials pipelines, product approvals, patents, product width and breadth, application dominance, technology lifeline curve. The above data points provided are only related to the companies’ focus related to North America organic fruits market.
Organic Fruits Market Leaders Operating in the Market Are:
- Kerr Concentrates
- Greenyard
- Z Natural Foods, LLC
- Organics Unlimited
- General Mills Inc.
- KOYAH
- Dole Food Company Inc
- Taylor Farms
- Farmer’s Own Organics
- Gustav Wulff GmbH
- Royal Ridge Fruits
- SunOpta
- TRADIN ORGANIC AGRICULTURE B.V.
- The Kraft Heinz Company
Latest Developments in Organic Fruits Market
- In September 2019, a Greenyard company, Bakker Barendrecht which is the largest fresh fruits and vegetable company in the Netherlands expanded its new building in Ridderkerk, the Netherlands which covers an area about 30,000 m². With this expansion, the company will be able to meet the rising demand for the high quality fruits to its customers.
SKU-

- Interactive Data Analysis Dashboard
- Company Analysis Dashboard for high growth potential opportunities
- Research Analyst Access for customization & queries
- Competitor Analysis with Interactive dashboard
- Latest News, Updates & Trend analysis
- Harness the Power of Benchmark Analysis for Comprehensive Competitor Tracking
North America Organic Fruits Market, Supply Chain Analysis and Ecosystem Framework
To support market growth and help clients navigate the impact of geopolitical shifts, DBMR has integrated in-depth supply chain analysis into its North America Organic Fruits Market research reports. This addition empowers clients to respond effectively to global changes affecting their industries. The supply chain analysis section includes detailed insights such as North America Organic Fruits Market consumption and production by country, price trend analysis, the impact of tariffs and geopolitical developments, and import and export trends by country and HSN code. It also highlights major suppliers with data on production capacity and company profiles, as well as key importers and exporters. In addition to research, DBMR offers specialized supply chain consulting services backed by over a decade of experience, providing solutions like supplier discovery, supplier risk assessment, price trend analysis, impact evaluation of inflation and trade route changes, and comprehensive market trend analysis.
Data collection and base year analysis are done using data collection modules with large sample sizes. The stage includes obtaining market information or related data through various sources and strategies. It includes examining and planning all the data acquired from the past in advance. It likewise envelops the examination of information inconsistencies seen across different information sources. The market data is analysed and estimated using market statistical and coherent models. Also, market share analysis and key trend analysis are the major success factors in the market report. To know more, please request an analyst call or drop down your inquiry.
The key research methodology used by DBMR research team is data triangulation which involves data mining, analysis of the impact of data variables on the market and primary (industry expert) validation. Data models include Vendor Positioning Grid, Market Time Line Analysis, Market Overview and Guide, Company Positioning Grid, Patent Analysis, Pricing Analysis, Company Market Share Analysis, Standards of Measurement, Global versus Regional and Vendor Share Analysis. To know more about the research methodology, drop in an inquiry to speak to our industry experts.
Data Bridge Market Research is a leader in advanced formative research. We take pride in servicing our existing and new customers with data and analysis that match and suits their goal. The report can be customized to include price trend analysis of target brands understanding the market for additional countries (ask for the list of countries), clinical trial results data, literature review, refurbished market and product base analysis. Market analysis of target competitors can be analyzed from technology-based analysis to market portfolio strategies. We can add as many competitors that you require data about in the format and data style you are looking for. Our team of analysts can also provide you data in crude raw excel files pivot tables (Fact book) or can assist you in creating presentations from the data sets available in the report.


