
North America Paper Cone Market
Market Size in USD Billion
 USD
1.56 Billion
USD
2.29 Billion
2024
2032
USD
1.56 Billion
USD
2.29 Billion
2024
2032
| 2025 - 2032 | |
| USD 1.56 Billion | |
| USD 2.29 Billion | |
| % | |
|
North America Paper Cone Market Size
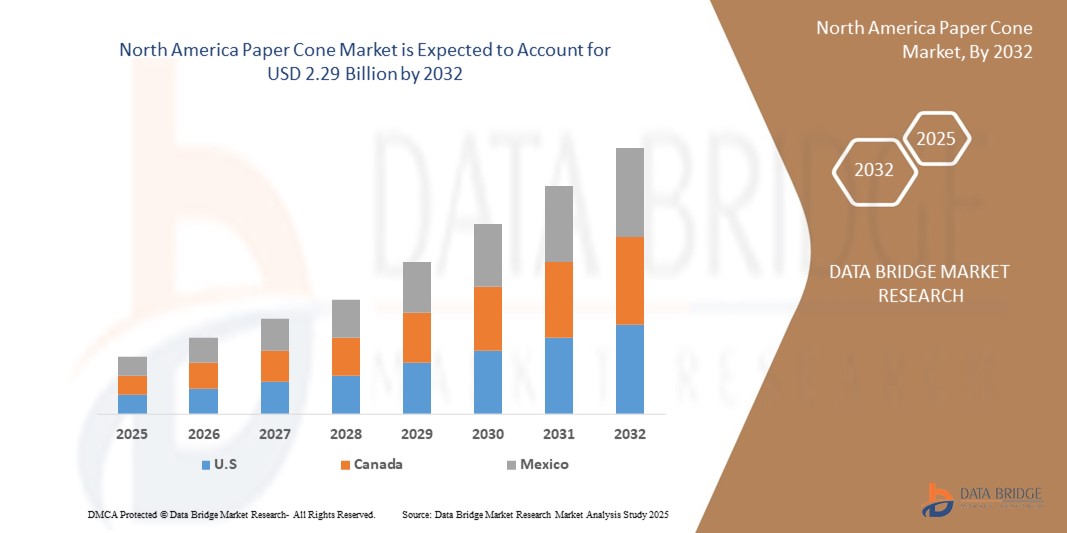
- The North America paper cone market size was valued at USD 1.56 billion in 2024 and is expected to reach USD 2.29 billion by 2032, at a CAGR of 4.90% during the forecast period
- The market growth is largely fuelled by the expanding textile and yarn manufacturing industry, increased demand for sustainable and biodegradable packaging alternatives, and rising consumer preference for eco-friendly products
- In addition, supportive government regulations promoting the use of recyclable and compostable materials are encouraging widespread adoption across industrial and commercial sectors
North America Paper Cone Market Analysis
- Paper cones are widely used as winding supports in textile manufacturing, particularly in the spinning and yarn processing segments
- The rising environmental concerns and regulatory pressure to reduce plastic usage are accelerating the adoption of paper-based alternatives across industrial applications
- U.S. paper cone market captured the largest revenue share of 79.2% in 2024, fuelled by its strong textile production base and high emphasis on sustainability in industrial packaging
- Canada is expected to witness the highest compound annual growth rate (CAGR) in the North America paper cone market due to country's commitment to sustainability, government-led initiatives to reduce plastic use, and the expansion of small and medium-scale textile operations
- The yarn paper cone segment accounted for the largest market revenue share in 2024, driven by its extensive use in the textile industry for winding and storing various types of yarn. These cones are preferred for their durability, cost-effectiveness, and compatibility with high-speed winding machines across spinning mills
Report Scope and North America Paper Cone Market Segmentation
|
Attributes |
North America Paper Cone Key Market Insights |
|
Segments Covered |
|
|
Countries Covered |
North America
|
|
Key Market Players |
|
|
Market Opportunities |
• Rising Use of Eco-Friendly Materials • Growth in Textile Automation |
|
Value Added Data Infosets |
In addition to the insights on market scenarios such as market value, growth rate, segmentation, geographical coverage, and major players, the market reports curated by the Data Bridge Market Research also include import export analysis, production capacity overview, production consumption analysis, price trend analysis, climate change scenario, supply chain analysis, value chain analysis, raw material/consumables overview, vendor selection criteria, PESTLE Analysis, Porter Analysis, and regulatory framework. |
North America Paper Cone Market Trends
“Rising Shift toward Sustainable and Biodegradable Textile Packaging”
- Manufacturers are increasingly replacing plastic cones with recyclable and biodegradable paper cones to reduce environmental impact
- Sustainability regulations are pressuring textile producers to adopt eco-friendly packaging solutions
- Paper cones align with circular economy goals and reduce landfill waste compared to plastic counterparts
- Consumers and international buyers are demanding greener production practices from textile suppliers
- For instance, Canadian textile exporters have shifted to biodegradable paper cones to comply with EU environmental import standards
North America Paper Cone Market Dynamics
Driver
“Expansion of the Textile Industry and Yarn Production in the Region”
- The growth of the textile sector in the U.S. and Mexico is driving increased demand for paper cones used in yarn winding and storage
- Rising nearshoring trends are strengthening local manufacturing and reducing dependency on overseas suppliers
- Paper cones are essential in automated yarn winding systems, making them integral to operational efficiency
- Manufacturers are forming partnerships with spinning mills to ensure consistent supply and reduce lead times
- For instance, Several U.S.-based yarn producers increased their paper cone procurement in 2023 to support expanded production lines following reshoring initiatives
Restraint/Challenge
“Volatility in Raw Material Prices and Supply Chain Disruptions”
- Price fluctuations in pulp and recycled paper directly impact production costs of paper cones
- Global supply chain instability has caused delays in sourcing raw materials for paper cone manufacturing
- Smaller manufacturers face difficulty maintaining competitive pricing amid rising logistics and energy costs
- Inconsistent raw material availability hinders the ability to scale production reliably
- For instance, In 2022, paper cone manufacturers in the southern U.S. reported shipment delays and increased costs due to global pulp shortages and freight disruptions
North America Paper Cone Market Scope
The North America paper cone market is segmented on the basis of type, number of piles, taper of the cone, size, distribution channel, and end-user.
• By Type
On the basis of type, the North America paper cone market is segmented into tight bong paper cone, jumbo paper cone, yarn paper cone, printed paper cone, bobbins, textile paper cone, wax paper cone, conical paper cone, construction cone, plain paper cone, and others. The yarn paper cone segment accounted for the largest market revenue share in 2024, driven by its extensive use in the textile industry for winding and storing various types of yarn. These cones are preferred for their durability, cost-effectiveness, and compatibility with high-speed winding machines across spinning mills.
The tight bong paper cone segment is expected to witness the fastest growth rate from 2025 to 2032, fuelled by its increasing application in industrial winding processes where high strength and moisture resistance are essential. These cones offer superior grip and are gaining traction in both textile and specialty yarn segments requiring precision and performance in demanding environments.
• By Number of Piles
On the basis of number of piles, the market is segmented into single ply and multiple ply. The multiple ply segment dominated the market in 2024 owing to its enhanced strength, load-bearing capacity, and suitability for heavy-duty applications. These cones are favored for transporting high-tension yarns and are widely used in export-grade textile packaging.
The single ply segment is expected to witness the fastest growth rate from 2025 to 2032, driven by demand from cost-sensitive applications where lightweight winding is preferred, especially in domestic and smaller-scale manufacturing setups.
• By Taper of the Cone
On the basis of taper of the cone, the market is segmented into up to 30 taper, 30 to 50 taper, and above 50 taper. The 30 to 50 taper segment held the highest market share in 2024 due to its widespread use in standard textile operations and compatibility with various yarn winding machines. These tapers ensure efficient yarn unwinding and are commonly used across spinning mills in the region.
The above 50 taper segment is expected to witness the fastest growth rate from 2025 to 2032, supported by specialized industrial applications that require steeper angles for faster unwinding and specific textile machinery configurations.
• By Size
On the basis of size, the market is segmented into 1-degree 51-minutes cone, 3-degree 51-minutes cone, 5-degree 57-minutes cone, 3-degree 30-minutes cone, 6-degree 20-minutes cone, 9-degree 51-minutes cone, 9-degree 36-minutes cone, 7-degree 22-minutes cone, and others. The 3-degree 30-minutes cone segment led the market in 2024 due to its popularity in polyester and cotton yarn winding, offering balanced support and minimal deformation during high-speed operations.
The 5-degree 57-minutes cone segment is expected to witness the fastest growth rate from 2025 to 2032, driven by increased adoption in export-focused yarn packaging that demands dimensional precision and superior stacking performance.
• By Distribution Channel
On the basis of distribution channel, the market is segmented into direct sales/B2B, specialist retailers, convenience stores, supermarkets/hypermarkets, e-commerce, and others. The direct sales/B2B segment held the largest share in 2024 as bulk orders from textile manufacturers and spinning mills are generally fulfilled through direct supplier relationships to ensure customization, pricing advantages, and timely delivery.
The e-commerce segment is expected to witness the fastest growth rate from 2025 to 2032, due to the increasing digitalization of procurement processes and the rise of small-scale textile businesses seeking flexible, on-demand supply channels.
• By End-User
On the basis of end-user, the market is segmented into textile, construction, and others. The textile segment dominated the market with the highest revenue share in 2024, propelled by the significant use of paper cones in spinning, dyeing, and winding processes across North America’s textile sector.
The construction segment is expected to witness the fastest growth rate from 2025 to 2032, due to the increasing use of conical paper forms and cylindrical molds in concrete shaping and structural casting applications, where cost-effective and disposable solutions are required.
North America Paper Cone Market Regional Analysis
- The U.S. paper cone market captured the largest revenue share of 79.2% in 2024, fuelled by its strong textile production base and high emphasis on sustainability in industrial packaging
- Major textile hubs across the southern U.S. are increasingly adopting biodegradable paper cones for yarn winding and transportation
- The growing inclination toward circular economy practices and partnerships with eco-compliant packaging suppliers are significantly contributing to market growth
- In addition, investments in smart textile manufacturing and fiber production further support the demand for precision-engineered paper cones
Canada Paper Cone Market Insight
The Canada paper cone market is expected to witness the fastest growth rate from 2025 to 2032, driven by increasing adoption of eco-friendly packaging and strong support for sustainable industrial practices. Canadian textile and nonwoven manufacturers are progressively replacing plastic cones with recyclable paper options to meet environmental regulations and customer expectations. The nation’s emphasis on circular economy initiatives, supported by both federal and provincial policies, is promoting the use of biodegradable yarn carriers in production and shipping. In addition, Canada's well-developed pulp and paper industry ensures ready access to high-quality raw materials, aiding local manufacturers in producing durable and customizable paper cones. Growing investments in eco-conscious automation within textile operations alongside rising demand from export-oriented yarn producers are expected to further consolidate Canada’s position in the North America paper cone market.
North America Paper Cone Market Share
The North America Paper Cone industry is primarily led by well-established companies, including:
- Conitex Sonoco (U.S.)
- Pacific Cones (U.S.)
SKU-

- Interactive Data Analysis Dashboard
- Company Analysis Dashboard for high growth potential opportunities
- Research Analyst Access for customization & queries
- Competitor Analysis with Interactive dashboard
- Latest News, Updates & Trend analysis
- Harness the Power of Benchmark Analysis for Comprehensive Competitor Tracking
North America Paper Cone Market, Supply Chain Analysis and Ecosystem Framework
To support market growth and help clients navigate the impact of geopolitical shifts, DBMR has integrated in-depth supply chain analysis into its North America Paper Cone Market research reports. This addition empowers clients to respond effectively to global changes affecting their industries. The supply chain analysis section includes detailed insights such as North America Paper Cone Market consumption and production by country, price trend analysis, the impact of tariffs and geopolitical developments, and import and export trends by country and HSN code. It also highlights major suppliers with data on production capacity and company profiles, as well as key importers and exporters. In addition to research, DBMR offers specialized supply chain consulting services backed by over a decade of experience, providing solutions like supplier discovery, supplier risk assessment, price trend analysis, impact evaluation of inflation and trade route changes, and comprehensive market trend analysis.
Data collection and base year analysis are done using data collection modules with large sample sizes. The stage includes obtaining market information or related data through various sources and strategies. It includes examining and planning all the data acquired from the past in advance. It likewise envelops the examination of information inconsistencies seen across different information sources. The market data is analysed and estimated using market statistical and coherent models. Also, market share analysis and key trend analysis are the major success factors in the market report. To know more, please request an analyst call or drop down your inquiry.
The key research methodology used by DBMR research team is data triangulation which involves data mining, analysis of the impact of data variables on the market and primary (industry expert) validation. Data models include Vendor Positioning Grid, Market Time Line Analysis, Market Overview and Guide, Company Positioning Grid, Patent Analysis, Pricing Analysis, Company Market Share Analysis, Standards of Measurement, Global versus Regional and Vendor Share Analysis. To know more about the research methodology, drop in an inquiry to speak to our industry experts.
Data Bridge Market Research is a leader in advanced formative research. We take pride in servicing our existing and new customers with data and analysis that match and suits their goal. The report can be customized to include price trend analysis of target brands understanding the market for additional countries (ask for the list of countries), clinical trial results data, literature review, refurbished market and product base analysis. Market analysis of target competitors can be analyzed from technology-based analysis to market portfolio strategies. We can add as many competitors that you require data about in the format and data style you are looking for. Our team of analysts can also provide you data in crude raw excel files pivot tables (Fact book) or can assist you in creating presentations from the data sets available in the report.


