
North America Pharmaceutical Solvent Market
Market Size in USD Billion
 USD
1.89 Billion
USD
2.71 Billion
2024
2032
USD
1.89 Billion
USD
2.71 Billion
2024
2032
| 2025 - 2032 | |
| USD 1.89 Billion | |
| USD 2.71 Billion | |
| % | |
|
North America Pharmaceutical Solvent Market Size
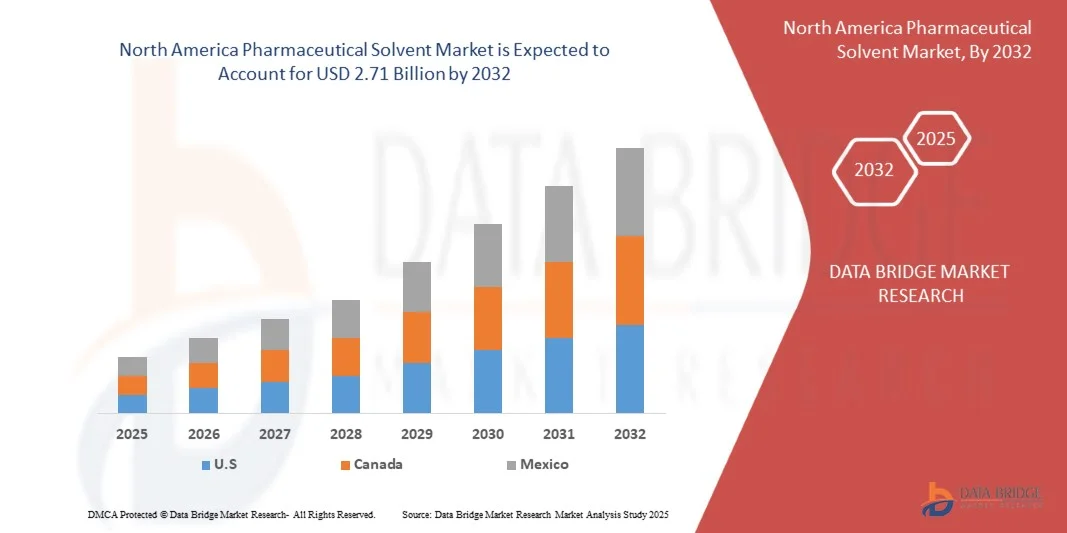
- The North America pharmaceutical solvent market size was valued at USD 1.89 billion in 2024 and is projected to reach USD 2.71 billion by 2032, growing at a CAGR of 4.60% during the forecast period.
- The market growth is primarily driven by the increasing demand for high-purity solvents in pharmaceutical manufacturing, particularly in drug formulation, synthesis, and purification processes.
- Additionally, rising investments in R&D, expansion of pharmaceutical production capacities, and stricter regulatory standards for drug quality are further propelling the demand for pharmaceutical-grade solvents, thereby fueling overall market expansion.
North America Pharmaceutical Solvent Market Analysis
- Pharmaceutical solvents, essential for drug formulation, synthesis, and purification, play a critical role in pharmaceutical manufacturing by ensuring product efficacy, stability, and regulatory compliance across various drug development stages
- The increasing demand for pharmaceutical solvents in North America is primarily driven by rising pharmaceutical production, growing investments in R&D, and the expanding prevalence of chronic diseases requiring complex drug therapies
- The U.S. dominated the North America pharmaceutical solvent market with a dominant revenue share of 40.6% in 2024, attributed to a robust pharmaceutical industry, significant investments in biopharmaceutical research, and a well-established regulatory framework supporting innovation and production scale-up
- Canada is projected to witness steady growth during the forecast period due to government initiatives promoting domestic pharmaceutical production and increasing demand for clean, high-purity solvents in advanced drug development processes
- The alcohols segment dominated the market in 2024, accounting for the largest revenue share of 36.5%, owing to its widespread use in both drug formulation and synthesis processes
Report Scope and North America Pharmaceutical Solvent Market Segmentation
|
Attributes |
Pharmaceutical Solvent Key Market Insights |
|
Segments Covered |
|
|
Countries Covered |
|
|
Key Market Players |
|
|
Market Opportunities |
|
|
Value Added Data Infosets |
In addition to the insights on market scenarios such as market value, growth rate, segmentation, geographical coverage, and major players, the market reports curated by the Data Bridge Market Research also include in-depth expert analysis, pricing analysis, brand share analysis, consumer survey, demography analysis, supply chain analysis, value chain analysis, raw material/consumables overview, vendor selection criteria, PESTLE Analysis, Porter Analysis, and regulatory framework. |
North America Pharmaceutical Solvent Market Trends
“Advancements in Green Chemistry and AI-Driven Process Optimization”
- A significant and accelerating trend in the North America Pharmaceutical Solvent Market is the integration of green chemistry principles and artificial intelligence (AI) to optimize solvent usage in drug manufacturing. This shift is being driven by growing environmental concerns, stricter regulatory frameworks, and the need for more efficient, sustainable production processes.
- For Instance, pharmaceutical companies are increasingly adopting bio-based and recyclable solvents such as ethanol and ethyl lactate, which offer reduced environmental impact without compromising performance. BASF and Merck KGaA have both introduced eco-friendly solvent options that align with global sustainability goals and meet stringent purity requirements for pharmaceutical use.
- AI and machine learning technologies are being used to model solvent interactions, predict optimal solvent blends, and enhance purification efficiency. Companies are leveraging these tools to reduce trial-and-error in formulation, minimize waste, and accelerate time-to-market. For instance, AI-driven platforms can analyze large datasets to identify ideal solvent systems that maximize yield while ensuring compliance with FDA and EMA guidelines.
- The use of AI in solvent management also supports predictive maintenance of solvent recovery systems, ensuring operational continuity and reducing costs. By monitoring solvent degradation and recycling performance, pharmaceutical firms can maintain high process standards and improve solvent lifecycle management.
- These innovations are facilitating the shift toward closed-loop solvent systems that reduce emissions and improve sustainability metrics. Leading companies like DuPont and Dow are investing in R&D to develop advanced solvent technologies that align with both environmental and performance objectives.
- The demand for AI-optimized and environmentally friendly pharmaceutical solvents is gaining momentum across the North American market, as companies strive to meet both regulatory requirements and consumer expectations for greener, safer drug production processes.
North America Pharmaceutical Solvent Market Dynamics
Driver
Growing Demand Driven by Expanding Pharmaceutical Production and R&D Activities
- The rising demand for pharmaceutical solvents in North America is largely driven by the growing scale of drug manufacturing and research & development (R&D) activities across the region. With increasing prevalence of chronic diseases, aging populations, and the continuous development of complex drug formulations, pharmaceutical companies are intensifying production efforts, which directly increases the consumption of high-purity solvents.
- For instance, major players such as Pfizer and Johnson & Johnson have significantly expanded their manufacturing capabilities in North America, while also investing heavily in R&D. These developments require large volumes of specialized solvents for applications such as synthesis, crystallization, extraction, and purification.
- Moreover, the increasing focus on biologics and advanced therapeutics—including mRNA-based drugs and cell/gene therapies—demands ultra-high purity solvents that meet stringent regulatory requirements. This is propelling growth in solvent innovation and customization.
- North America’s advanced pharmaceutical infrastructure, presence of leading CDMOs (Contract Development and Manufacturing Organizations), and favorable regulatory environment are also contributing to higher solvent consumption.
- In addition, the trend toward continuous manufacturing and automation in pharmaceutical production is encouraging the adoption of solvents compatible with high-throughput and real-time quality control systems, further boosting the market's momentum.
Restraint/Challenge
Environmental Concerns and Regulatory Pressure on Traditional Solvent Use
- Increasing environmental concerns regarding the toxicity, volatility, and disposal of conventional pharmaceutical solvents pose a significant challenge for the market. Regulatory agencies such as the U.S. Environmental Protection Agency (EPA) and the Food and Drug Administration (FDA) are tightening standards related to emissions, residual solvents, and waste disposal.
- For instance, solvents such as chloroform, dichloromethane, and toluene are facing usage restrictions due to their hazardous nature and environmental impact. Compliance with these regulations requires companies to invest in safer alternatives and solvent recovery systems, which can increase operational costs.
- Additionally, there is growing pressure on pharmaceutical manufacturers to transition toward greener and bio-based solvents. While these alternatives are more sustainable, they may not always provide the same performance levels or compatibility with existing production systems, limiting their adoption in some formulations.
- The need for high investment in solvent recycling infrastructure, process redesign, and R&D to identify suitable eco-friendly substitutes adds to the complexity and cost of compliance.
- Addressing these challenges will require strong industry collaboration, innovation in green chemistry, and supportive policy frameworks that incentivize the adoption of sustainable solvents without compromising product efficacy or safety.
North America Pharmaceutical Solvent Market Scope
The market is segmented on the basis of Solvent type, application, and end-user.
By Solvent Type
On the basis of solvent type, the pharmaceutical solvents market is segmented into alcohols, esters, ethers, ketones, aromatic hydrocarbons, and aliphatic hydrocarbons. The alcohols segment dominated the market in 2024, accounting for the largest revenue share of 36.5%, owing to its widespread use in both drug formulation and synthesis processes. Alcohols, such as ethanol and isopropanol, are commonly used as solvents due to their high solvency, low toxicity, and regulatory acceptance in pharmaceutical applications. Their compatibility with a wide range of active pharmaceutical ingredients (APIs) and excipients, along with easy availability and cost-effectiveness, contribute to their significant market share.
The esters segment is projected to witness the fastest CAGR from 2025 to 2032, driven by growing use in controlled drug release formulations and their ability to enhance drug solubility. Esters also find increasing demand in topical and transdermal drug delivery systems, expanding their footprint across formulation development processes.
• By Application
On the basis of application, the market is segmented into Active Pharmaceutical Ingredients (APIs) synthesis, excipients manufacturing, formulation development, and analytical testing. The APIs synthesis segment dominated the market with the highest revenue share of 42.8% in 2024, attributed to the critical role solvents play in reaction processes, purification, and crystallization steps of API manufacturing. As global demand for innovative and generic drugs rises, manufacturers increasingly invest in solvent systems that ensure high purity, yield, and regulatory compliance.
The formulation development segment is anticipated to exhibit the fastest growth rate from 2025 to 2032, propelled by advances in drug delivery technologies and personalized medicine. Solvents in this segment are essential for solubilizing APIs, optimizing bioavailability, and enabling novel dosage forms. The surge in complex formulations such as injectables, inhalables, and transdermal systems further accelerates solvent demand in this application area.
• By End-User
Based on end-user, the pharmaceutical solvents market is segmented into pharmaceutical companies, generic drug manufacturers, biotechnology companies, and CROs & CMOs. The pharmaceutical companies segment accounted for the largest market revenue share of 38.6% in 2024, driven by their extensive involvement in both R&D and large-scale production of new chemical entities (NCEs) and branded drugs. These organizations rely heavily on high-purity solvents for synthesis, quality control, and formulation, complying with stringent regulatory standards.
The CROs and CMOs segment is expected to record the fastest CAGR from 2025 to 2032, as outsourcing trends continue to grow across the pharmaceutical value chain. Contract service providers increasingly invest in flexible manufacturing facilities and specialized solvent systems to cater to diverse client needs, making them key contributors to solvent demand. Their ability to scale production and handle multiple drug portfolios drives rapid growth in this segment.
North America Pharmaceutical Solvent Market Regional Analysis
- The U.S. dominated the pharmaceutical solvent market with the largest revenue share 40.6%in 2024, driven by a well-established pharmaceutical sector, robust R&D investments, and the rising demand for high-purity solvents in drug development and manufacturing
- Companies in the region increasingly prioritize solvent quality, regulatory compliance, and process efficiency, fueling the adoption of specialized solvents across synthesis, formulation, and testing stages of pharmaceutical production
- This market growth is further supported by a strong presence of major pharmaceutical and biotechnology firms, government-backed healthcare initiatives, and a mature infrastructure for drug research, making North America a key hub for pharmaceutical solvent consumption
Canada Pharmaceutical Solvent Market Insight
The Canada pharmaceutical solvent market is expected to grow at a steady CAGR during the forecast period, supported by increasing government initiatives to strengthen the domestic pharmaceutical supply chain and enhance drug manufacturing capabilities. Rising R&D investments, especially in generics and biosimilars, are fueling the demand for reliable and efficient solvent systems. Canada’s focus on sustainability and green chemistry is also encouraging the adoption of eco-friendly solvents, while its growing network of CMOs and CROs further supports market expansion.
Mexico Pharmaceutical Solvent Market Insight
The Mexico pharmaceutical solvent market is projected to experience moderate growth, driven by expanding pharmaceutical production and rising exports to the U.S. and Latin America. The government's support for improving healthcare infrastructure and encouraging domestic drug manufacturing is fostering demand for pharmaceutical-grade solvents. Additionally, Mexico’s growing role as a nearshoring destination for global pharmaceutical companies is increasing the need for solvent-intensive manufacturing processes. As regulatory frameworks continue to align with international standards, the market is expected to attract more foreign investment and innovation.
North America Pharmaceutical Solvent Market Share
The Pharmaceutical Solvent industry is primarily led by well-established companies, including:
- DuPont (U.S.)
- Mitsui Chemicals (Japan)
- DOW (U.S.)
- Brenntag SE (Germany)
- Merck KGaA (Germany)
- Royal Dutch Shell Plc (Netherlands/U.K.)
- BASF SE (Germany)
- Exxon Mobil Corporation (U.S.)
- Clariant (Switzerland)
- Eastman Chemical Company (U.S.)
- LyondellBasell Industries Holdings B.V. (Netherlands)
- Olin Corporation (U.S.)
- SK geo centric Co., Ltd. (South Korea)
- Avantor, Inc. (U.S.)
What are the Recent Developments in North America Pharmaceutical Solvent Market?
- In April 2023, DuPont (USA), a global leader in specialty chemicals, launched an advanced line of eco-friendly pharmaceutical solvents aimed at reducing environmental impact while maintaining high purity standards required by drug manufacturers. This initiative highlights DuPont’s commitment to sustainability and innovation, addressing increasing regulatory pressure for greener solvent alternatives in North America. By leveraging cutting-edge technology and extensive industry expertise, DuPont is strengthening its position in the growing pharmaceutical solvent market across the region.
- In March 2023, Brenntag SE (Germany), a major chemical distributor operating in North America, expanded its pharmaceutical solvent portfolio by partnering with local manufacturers to improve supply chain efficiency and solvent availability for pharmaceutical companies. This strategic move enhances Brenntag’s ability to meet rising demand for high-quality solvents used in drug formulation and synthesis, demonstrating the company’s dedication to supporting the pharmaceutical industry’s evolving needs.
- In March 2023, Merck KGaA (Germany) successfully implemented a large-scale solvent recovery system at its manufacturing site in the U.S., aimed at improving resource efficiency and reducing solvent waste. This project exemplifies Merck’s commitment to sustainable pharmaceutical manufacturing practices, contributing to cost savings and environmental conservation while maintaining compliance with stringent regulatory standards.
- In February 2023, Eastman Chemical Company (USA) announced a collaboration with pharmaceutical companies to develop tailor-made solvent blends designed to optimize drug manufacturing processes. This initiative focuses on enhancing process efficiency, safety, and product quality, reflecting Eastman’s dedication to innovation and customer-centric solutions in the pharmaceutical solvent market.
- In January 2023, Exxon Mobil Corporation (USA) unveiled a new line of high-purity hydrocarbon solvents specifically engineered for the North American pharmaceutical industry. These solvents are designed to meet strict regulatory requirements and provide superior performance in active pharmaceutical ingredient (API) synthesis. ExxonMobil’s introduction of this product line underscores its commitment to meeting the specialized needs of pharmaceutical manufacturers while driving market growth.
SKU-

- Interactive Data Analysis Dashboard
- Company Analysis Dashboard for high growth potential opportunities
- Research Analyst Access for customization & queries
- Competitor Analysis with Interactive dashboard
- Latest News, Updates & Trend analysis
- Harness the Power of Benchmark Analysis for Comprehensive Competitor Tracking
North America Pharmaceutical Solvent Market, Supply Chain Analysis and Ecosystem Framework
To support market growth and help clients navigate the impact of geopolitical shifts, DBMR has integrated in-depth supply chain analysis into its North America Pharmaceutical Solvent Market research reports. This addition empowers clients to respond effectively to global changes affecting their industries. The supply chain analysis section includes detailed insights such as North America Pharmaceutical Solvent Market consumption and production by country, price trend analysis, the impact of tariffs and geopolitical developments, and import and export trends by country and HSN code. It also highlights major suppliers with data on production capacity and company profiles, as well as key importers and exporters. In addition to research, DBMR offers specialized supply chain consulting services backed by over a decade of experience, providing solutions like supplier discovery, supplier risk assessment, price trend analysis, impact evaluation of inflation and trade route changes, and comprehensive market trend analysis.
Data collection and base year analysis are done using data collection modules with large sample sizes. The stage includes obtaining market information or related data through various sources and strategies. It includes examining and planning all the data acquired from the past in advance. It likewise envelops the examination of information inconsistencies seen across different information sources. The market data is analysed and estimated using market statistical and coherent models. Also, market share analysis and key trend analysis are the major success factors in the market report. To know more, please request an analyst call or drop down your inquiry.
The key research methodology used by DBMR research team is data triangulation which involves data mining, analysis of the impact of data variables on the market and primary (industry expert) validation. Data models include Vendor Positioning Grid, Market Time Line Analysis, Market Overview and Guide, Company Positioning Grid, Patent Analysis, Pricing Analysis, Company Market Share Analysis, Standards of Measurement, Global versus Regional and Vendor Share Analysis. To know more about the research methodology, drop in an inquiry to speak to our industry experts.
Data Bridge Market Research is a leader in advanced formative research. We take pride in servicing our existing and new customers with data and analysis that match and suits their goal. The report can be customized to include price trend analysis of target brands understanding the market for additional countries (ask for the list of countries), clinical trial results data, literature review, refurbished market and product base analysis. Market analysis of target competitors can be analyzed from technology-based analysis to market portfolio strategies. We can add as many competitors that you require data about in the format and data style you are looking for. Our team of analysts can also provide you data in crude raw excel files pivot tables (Fact book) or can assist you in creating presentations from the data sets available in the report.


