
North America Phosphoric Acid Market
Market Size in USD Billion
 USD
8.72 Billion
USD
11.66 Billion
2025
2033
USD
8.72 Billion
USD
11.66 Billion
2025
2033
| 2026 - 2033 | |
| USD 8.72 Billion | |
| USD 11.66 Billion | |
| % | |
|
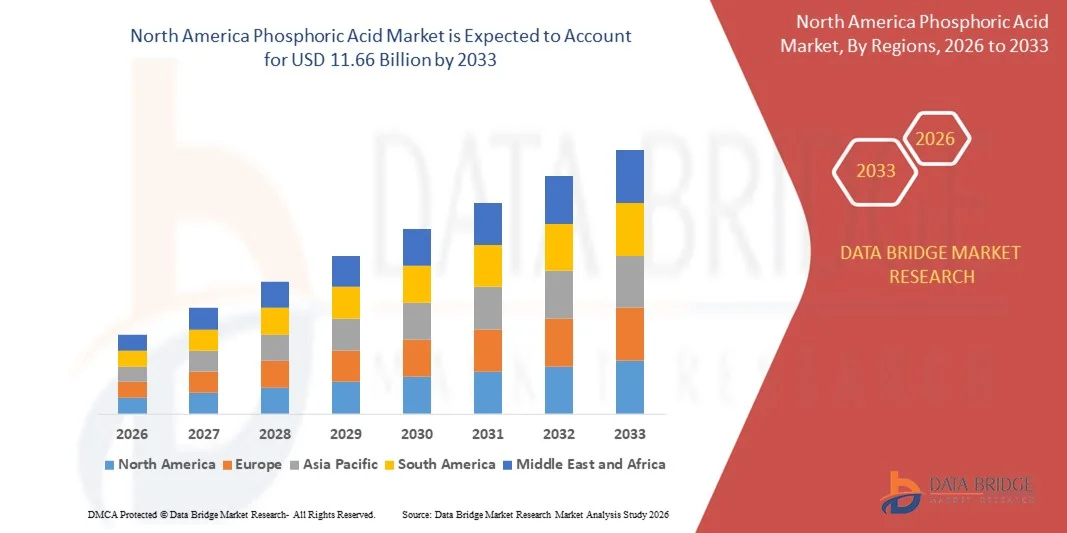
North America Phosphoric Acid Market Size
- The North America phosphoric acid market size was valued at USD 8.72 billion in 2025 and is expected to reach USD 11.66 billion by 2033, at a CAGR of 3.7% during the forecast period
- The market growth is largely fueled by the rising global demand for fertilizers and agrochemicals, which has increased the adoption of phosphoric acid as a key raw material for phosphate-based fertilizers. In addition, rapid industrialization and growth in chemical manufacturing sectors are driving the need for phosphoric acid in diverse applications, including food processing, water treatment, and specialty chemicals
- Furthermore, increasing focus on sustainable agricultural practices and higher crop yields is encouraging companies to invest in high-purity phosphoric acid production and supply. These converging factors are expanding the market for both industrial-grade and food-grade phosphoric acid, thereby significantly boosting overall industry growth
North America Phosphoric Acid Market Analysis
- Phosphoric acid, a critical intermediate in fertilizers, animal feed supplements, and chemical manufacturing, is becoming increasingly vital due to its role in supporting global food security and industrial operations. Its versatility and applicability across multiple sectors enhance its strategic importance in both domestic and international markets
- The escalating demand for phosphoric acid is primarily fueled by population growth, rising food consumption, and the expansion of commercial agriculture in emerging economies. Growing awareness among manufacturers about product quality and efficiency in fertilizer formulations is further contributing to increased adoption
- U.S. dominated the phosphoric acid market in 2025, due to its well-established fertilizer production industry, strong industrial chemical manufacturing base, and growing agricultural modernization initiatives
- Canada is expected to be the fastest growing country in the phosphoric acid market during the forecast period due to increasing fertilizer demand, agricultural modernization, and growth in industrial applications
- Wet process segment dominated the market with a market share of 72.5% in 2025, due to its cost-effectiveness and suitability for large-scale production. Wet process phosphoric acid is widely preferred in the fertilizer industry due to its high yield and ability to handle low-grade phosphate rock efficiently. The established infrastructure and technological familiarity of manufacturers further strengthen its dominance, making it the preferred choice across multiple downstream applications
Report Scope and Phosphoric Acid Market Segmentation
|
Attributes |
Phosphoric Acid Key Market Insights |
|
Segments Covered |
|
|
Countries Covered |
North America
|
|
Key Market Players |
|
|
Market Opportunities |
|
|
Value Added Data Infosets |
In addition to the insights on market scenarios such as market value, growth rate, segmentation, geographical coverage, and major players, the market reports curated by the Data Bridge Market Research also include import export analysis, production capacity overview, production consumption analysis, price trend analysis, climate change scenario, supply chain analysis, value chain analysis, raw material/consumables overview, vendor selection criteria, PESTLE Analysis, Porter Analysis, and regulatory framework. |
North America Phosphoric Acid Market Trends
Rising Demand for High-Purity Phosphoric Acid in Specialty Applications
- A notable trend in the phosphoric acid market is the increasing demand for high-purity phosphoric acid in specialty applications, driven by the need for precise chemical performance in food, pharmaceuticals, and industrial processes. This is elevating the importance of purified phosphoric acid as a key ingredient in applications where impurity levels must be strictly controlled
- For instance, companies such as Mosaic and OCP Group supply high-purity phosphoric acid for use in specialty fertilizers and food-grade applications, enabling manufacturers to meet stringent regulatory standards and maintain product consistency
- The growth of the electronics sector is further boosting demand for high-purity phosphoric acid in semiconductor etching and metal treatment processes, positioning the chemical as critical for advanced manufacturing and surface treatment applications
- The food and beverage industry is increasingly incorporating phosphoric acid in beverages and acidulants, supporting flavor stabilization, preservation, and controlled acidity in products. This trend highlights the versatile role of phosphoric acid across nutrition-focused applications
- Pharmaceutical and nutraceutical industries are adopting phosphoric acid in drug formulations and dietary supplements, emphasizing purity, consistency, and compliance with global health standards. This is driving innovation in production and refining methods
- The market is witnessing rising consumption in industrial processes such as water treatment, detergents, and corrosion inhibitors, where phosphoric acid serves as a multifunctional chemical additive. This broad adoption reinforces its central role across multiple sectors and applications
North America Phosphoric Acid Market Dynamics
Driver
Growing Global Demand for Phosphate-Based Fertilizers
- The rising need for phosphate-based fertilizers is a primary driver of phosphoric acid demand, as it serves as a key intermediate for producing monoammonium phosphate (MAP) and diammonium phosphate (DAP). Fertilizer demand is fueled by the need to improve crop yields and soil nutrient management across global agriculture
- For instance, Yara International produces phosphoric acid-based fertilizers for precision agriculture, enhancing nutrient efficiency and supporting large-scale food production. Such initiatives drive consistent demand for high-quality phosphoric acid from both developed and emerging markets
- Expanding agricultural activities are boosting fertilizer consumption, increasing phosphoric acid production requirements. The emphasis on food security and higher crop productivity is reinforcing market expansion
- Government programs supporting sustainable agriculture and soil health management are encouraging the adoption of phosphate fertilizers. These initiatives indirectly strengthen phosphoric acid demand as a critical raw material for fertilizer production
- The rising global population and dietary changes toward protein-rich diets are increasing fertilizer use to meet higher crop output. This sustained agricultural demand ensures a continuous growth trajectory for the phosphoric acid market
Restraint/Challenge
Volatility in Raw Material and Phosphate Rock Prices
- The phosphoric acid market faces challenges due to fluctuating prices of phosphate rock, sulfur, and other raw materials, which significantly impact production costs and profit margins. These price variations are often driven by geopolitical factors, mining constraints, and trade policies
- For instance, companies such as Nutrien and OCP Group experience cost pressure when phosphate rock prices surge, affecting the overall phosphoric acid supply chain. Such volatility makes pricing strategies complex and can limit market expansion in sensitive regions
- Dependency on limited phosphate rock reserves exposes manufacturers to supply disruptions, affecting production planning and inventory management. These risks create uncertainty for both suppliers and end-users in maintaining stable supply contracts
- Transportation costs and energy prices also contribute to production cost variability, particularly for high-purity phosphoric acid requiring energy-intensive processing. This adds complexity to balancing operational efficiency with market competitiveness
- The market continues to face constraints in aligning production capacity with demand fluctuations while maintaining profitability. These challenges collectively necessitate strategic sourcing and risk management to sustain growth in a volatile raw material environment
North America Phosphoric Acid Market Scope
The market is segmented on the basis of process type, form, grade, and applications.
- By Process Type
On the basis of process type, the phosphoric acid market is segmented into wet process and thermal process. The wet process segment dominated the market with the largest revenue share of 72.5% in 2025, driven by its cost-effectiveness and suitability for large-scale production. Wet process phosphoric acid is widely preferred in the fertilizer industry due to its high yield and ability to handle low-grade phosphate rock efficiently. The established infrastructure and technological familiarity of manufacturers further strengthen its dominance, making it the preferred choice across multiple downstream applications.
The thermal process segment is anticipated to witness the fastest growth rate from 2026 to 2033, fueled by increasing demand for high-purity phosphoric acid in the semiconductor and food industries. Thermal process phosphoric acid offers superior purity levels and minimal impurities, which are critical for applications requiring stringent quality standards. Its growing adoption in specialty chemical manufacturing and high-tech industries is contributing to its accelerated market expansion.
- By Form
On the basis of form, the phosphoric acid market is segmented into solid and liquid. The liquid segment dominated the market with the largest revenue share in 2025, owing to its ease of handling, transportation, and immediate applicability in industrial processes. Liquid phosphoric acid is widely used in fertilizers, food additives, and cleaning agents, providing manufacturers with a versatile solution for continuous operations. Its ability to be easily blended with other chemicals and consistent quality makes it the preferred form for large-scale industrial applications.
The solid segment is expected to witness the fastest CAGR from 2026 to 2033, driven by the increasing demand for safer handling and reduced transportation costs in developing regions. Solid phosphoric acid provides advantages such as longer shelf life, lower spill risks, and simplified storage, making it ideal for agricultural and specialty applications. The rising adoption in markets prioritizing safety and logistics efficiency supports its rapid growth trajectory.
- By Grade
On the basis of grade, the phosphoric acid market is segmented into technical grade, food grade, and feed grade. The technical grade segment dominated the market with the largest revenue share in 2025, attributed to its extensive use in fertilizers, chemical manufacturing, and industrial applications. Technical grade phosphoric acid meets general quality requirements at an economically viable cost, making it a preferred choice across high-volume sectors. Its compatibility with large-scale production processes and broad industrial applicability reinforce its leading market position.
The food grade segment is anticipated to witness the fastest growth rate from 2026 to 2033, fueled by rising demand in food and beverage processing industries. For instance, companies such as Archer Daniels Midland (ADM) utilize food-grade phosphoric acid in beverages and processed foods to regulate acidity and enhance preservation. The increasing focus on safe and high-quality food additives is driving accelerated adoption of food-grade phosphoric acid in markets.
- By Applications
On the basis of applications, the phosphoric acid market is segmented into food and beverages, animal feed, personal care, chemical manufacturing, leather and textile, cleaning agents, ceramics and refractories, agricultural fertilizers, metallurgy, water treatment, construction, mining, semiconductors, oral and dental care, pharmaceuticals, and others. The agricultural fertilizers segment dominated the market with the largest revenue share in 2025, owing to the extensive use of phosphoric acid as a key raw material in phosphate fertilizers. Fertilizer manufacturers prioritize this application due to its direct impact on crop yield and soil nutrient management, particularly in regions with intensive agricultural activity.
The semiconductors segment is expected to witness the fastest CAGR from 2026 to 2033, driven by the increasing need for high-purity phosphoric acid in microchip and electronic component manufacturing. For instance, companies such as Intel and TSMC rely on ultra-pure phosphoric acid in etching processes and wafer fabrication to ensure precision and quality. The growth of advanced electronics and semiconductor production globally is propelling rapid adoption of phosphoric acid in this high-value application.
North America Phosphoric Acid Market Regional Analysis
- U.S. dominated the phosphoric acid market with the largest revenue share in 2025, driven by its well-established fertilizer production industry, strong industrial chemical manufacturing base, and growing agricultural modernization initiatives
- The country’s role as a regional hub for phosphate-based fertilizer production, supported by large-scale crop cultivation, expanding food and beverage industries, and rising industrial chemical demand, continues to sustain strong phosphoric acid consumption
- High focus on advanced manufacturing technologies, adoption of high-purity phosphoric acid for industrial and specialty applications, and presence of major domestic chemical producers reinforce the U.S.’s leading position. Investments in modern chemical processing plants and expansion of phosphate processing capacity further strengthen its dominance across the regional market
Canada Phosphoric Acid Market Insight
Canada is projected to register the fastest CAGR in the North America phosphoric acid market from 2026 to 2033, supported by increasing fertilizer demand, agricultural modernization, and growth in industrial applications. Rising adoption of efficient and environmentally sustainable phosphate-based fertilizers and expanding agricultural output are accelerating market growth. Investments in advanced chemical production and processing infrastructure, coupled with growing regulatory focus on food safety and environmental compliance, position Canada as the fastest-growing market in the region.
Mexico Phosphoric Acid Market Insight
Mexico is witnessing steady growth in the phosphoric acid market, driven by increasing demand from fertilizer manufacturers, food processing, and industrial chemical sectors. Growth in agricultural activities, adoption of high-purity phosphoric acid for industrial and food-grade applications, and gradual expansion of chemical production capabilities are supporting market development. Rising focus on sustainable agriculture, energy-efficient chemical processing, and increasing regulatory compliance are enhancing Mexico’s contribution to the regional market growth.
North America Phosphoric Acid Market Share
The phosphoric acid industry is primarily led by well-established companies, including:
- Nutrien Ltd (Canada)
- OCP (Morocco)
- J.R. Simplot Company (U.S.)
- Brenntag North America, Inc. (U.S.)
- Arkema (France)
- ICL (Israel)
- Innophos (U.S.)
- Spectrum Chemical (U.S.)
- Solvay (Belgium)
- Prayon (Belgium)
- CLARIANT (Switzerland)
- Jordan Phosphate Mines Company (PLC) (Jordan)
- Quadra Chemicals Ltd. (Canada)
- Chemische Fabrik Budenheim KG (Germany)
- Grupa Azoty (Poland)
- EuroChem Group (Switzerland)
Latest Developments in North America Phosphoric Acid Market
- In December 2025, PhosAgro announced its strategic expansion plan to increase overall agrochemical production capacity by 1.4 million tons by 2026, which includes bolstering the company’s phosphoric and sulphuric acid production facilities. This move is expected to enhance PhosAgro’s market share and support supply-side robustness, positioning the company to better meet rising global fertilizer demand and improve operational efficiencies across its integrated production chain
- In May 2025, Caitlyn India Private Ltd announced an investment of ₹400 crore to establish a new 50,000 tonnes-per-annum integrated phosphoric acid plant in India. This investment underscores increasing corporate confidence in domestic phosphoric acid manufacturing, expands local capacity, and is expected to contribute to improved supply resilience and import substitution in a market heavily reliant on imported acid
- In February 2024, Coromandel International Ltd (CIL) revealed plans to increase phosphoric acid and sulphuric acid production capacities at its southeastern Andhra Pradesh plant. The capacity expansion is anticipated to strengthen Coromandel’s manufacturing footprint and support backward integration, which will improve domestic output stability and address growing fertilizer-grade acid demand in India’s agriculture sector
- In July 2022, Ineos Group Ltd signed three major agreements with SINOPEC totaling USD 7 billion to expand its chemical production footprint, which indirectly influences the phosphoric acid market by strengthening integrated chemical manufacturing capabilities. The partnership enhances supply-chain efficiency and reflects growing strategic alignment between Western and Asian chemical sectors
- In January 2022, SABIC completed its transformation by launching a standalone agri-nutrients company focused on sustainable agricultural development. This restructuring is expected to increase SABIC’s involvement in phosphoric acid production, enabling it to better serve advanced fertilizer markets and reinforce its competitive positioning across regional and global supply chains
SKU-

- Interactive Data Analysis Dashboard
- Company Analysis Dashboard for high growth potential opportunities
- Research Analyst Access for customization & queries
- Competitor Analysis with Interactive dashboard
- Latest News, Updates & Trend analysis
- Harness the Power of Benchmark Analysis for Comprehensive Competitor Tracking
North America Phosphoric Acid Market, Supply Chain Analysis and Ecosystem Framework
To support market growth and help clients navigate the impact of geopolitical shifts, DBMR has integrated in-depth supply chain analysis into its North America Phosphoric Acid Market research reports. This addition empowers clients to respond effectively to global changes affecting their industries. The supply chain analysis section includes detailed insights such as North America Phosphoric Acid Market consumption and production by country, price trend analysis, the impact of tariffs and geopolitical developments, and import and export trends by country and HSN code. It also highlights major suppliers with data on production capacity and company profiles, as well as key importers and exporters. In addition to research, DBMR offers specialized supply chain consulting services backed by over a decade of experience, providing solutions like supplier discovery, supplier risk assessment, price trend analysis, impact evaluation of inflation and trade route changes, and comprehensive market trend analysis.
Data collection and base year analysis are done using data collection modules with large sample sizes. The stage includes obtaining market information or related data through various sources and strategies. It includes examining and planning all the data acquired from the past in advance. It likewise envelops the examination of information inconsistencies seen across different information sources. The market data is analysed and estimated using market statistical and coherent models. Also, market share analysis and key trend analysis are the major success factors in the market report. To know more, please request an analyst call or drop down your inquiry.
The key research methodology used by DBMR research team is data triangulation which involves data mining, analysis of the impact of data variables on the market and primary (industry expert) validation. Data models include Vendor Positioning Grid, Market Time Line Analysis, Market Overview and Guide, Company Positioning Grid, Patent Analysis, Pricing Analysis, Company Market Share Analysis, Standards of Measurement, Global versus Regional and Vendor Share Analysis. To know more about the research methodology, drop in an inquiry to speak to our industry experts.
Data Bridge Market Research is a leader in advanced formative research. We take pride in servicing our existing and new customers with data and analysis that match and suits their goal. The report can be customized to include price trend analysis of target brands understanding the market for additional countries (ask for the list of countries), clinical trial results data, literature review, refurbished market and product base analysis. Market analysis of target competitors can be analyzed from technology-based analysis to market portfolio strategies. We can add as many competitors that you require data about in the format and data style you are looking for. Our team of analysts can also provide you data in crude raw excel files pivot tables (Fact book) or can assist you in creating presentations from the data sets available in the report.


