
North America Pipe Market
Market Size in USD Billion
 USD
27.51 Billion
USD
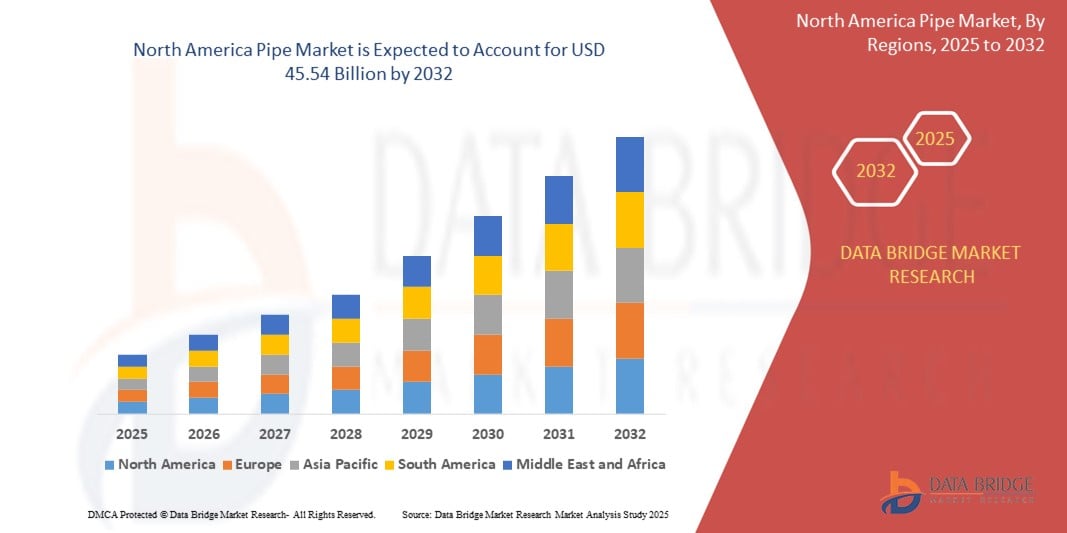
45.54 Billion
2024
2032
USD
27.51 Billion
USD
45.54 Billion
2024
2032
| 2025 - 2032 | |
| USD 27.51 Billion | |
| USD 45.54 Billion | |
| % | |
|
Pipe Market Size
- The North America pipe market size was valued at USD 27.51 billion in 2024 and is expected to reach USD 45.54 billion by 2032, at a CAGR of 6.5% during the forecast period
- The market growth is largely fueled by rising infrastructure development across residential, commercial, and industrial sectors, coupled with increasing investments in water supply, oil and gas transportation, and urban utility networks
- Furthermore, the growing need for durable, corrosion-resistant, and cost-effective piping solutions is driving demand for both metallic and non-metallic pipes. These converging factors are significantly accelerating the deployment of advanced piping systems, thereby boosting overall market expansion
Pipe Market Analysis
- Pipes are essential components used for the transportation of water, gas, oil, and industrial fluids across various infrastructure systems. They are manufactured in a range of materials including steel, copper, PVC, and HDPE, catering to diverse pressure, temperature, and environmental requirements
- The demand for pipes is driven by increasing urbanization, aging infrastructure replacement, and government initiatives aimed at expanding water and energy distribution networks. Advancements in pipe manufacturing technologies and growing emphasis on sustainability are further enhancing market growth across region
- U.S. dominated the pipe market with a share of 75.2% in 2024, due to ongoing investments in water infrastructure, oil and gas pipeline upgrades, and industrial facility expansions
- Canada is expected to be the fastest growing region in the pipe market during the forecast period due to rising investments in energy transport, clean water systems, and green infrastructure
- Pressure pipe segment dominated the market with a market share of 71.7% in 2024, due to strong demand from water supply systems, oil and gas pipelines, and industrial fluid transport. Pressure pipes are engineered to handle high internal pressure, making them essential for secure fluid conveyance in mission-critical applications
Report Scope and Pipe Market Segmentation
|
Attributes |
Pipe Key Market Insights |
|
Segments Covered |
|
|
Countries Covered |
North America
|
|
Key Market Players |
|
|
Market Opportunities |
|
|
Value Added Data Infosets |
In addition to the insights on market scenarios such as market value, growth rate, segmentation, geographical coverage, and major players, the market reports curated by the Data Bridge Market Research also include import export analysis, production capacity overview, production consumption analysis, price trend analysis, climate change scenario, supply chain analysis, value chain analysis, raw material/consumables overview, vendor selection criteria, PESTLE Analysis, Porter Analysis, and regulatory framework. |
Pipe Market Trends
“Rising Demand in Construction”
- The pipe market is expanding, driven by increasing construction activity—both residential and commercial—as urbanization accelerates and developing economies invest in real estate, public infrastructure, and utilities
- For instance, industry leaders such as Tenaris and Vallourec have launched advanced corrosion-resistant steel pipes specifically catering to construction and infrastructure projects, demonstrating growing demand for high-durability solutions in water supply, sewage, HVAC, and gas lines
- Rising mega infrastructure projects—such as smart cities, transportation networks, and renewable energy facilities—across Asia Pacific, the US, and Europe require extensive piping networks for water, energy, and communication conduits
- Advancements in pipeline materials, from high-strength steels to lightweight, corrosion-resistant plastics and composites, are supporting the adoption of innovative piped solutions that meet modern building codes and sustainability requirements
- Stringent regulations on water management and energy efficiency are encouraging the replacement of outdated or leaking pipe systems with improved, long-lasting alternatives, boosting renovation demand in mature markets
- Digital transformation in the construction industry—such as the integration of smart pipe systems for leak detection and condition monitoring—is shaping new opportunities for value-added pipe products in infrastructure and building projects
Pipe Market Dynamics
Driver
“Growing Investments in Infrastructures”
- Increasing investments in infrastructure—spanning water distribution, sewage, energy transport, and industrial facilities—act as a major market driver by boosting large-scale pipeline deployments in both developed and developing economies
- For instance, India’s Smart Cities Mission and China’s rapid urbanization programs have led to multi-billion-dollar investments in new urban infrastructure, driving significant growth in demand for all types of pipes including plastic, steel, and composite varieties
- The expansion of oil and gas pipelines, as well as renewable energy projects such as offshore wind farms requiring subsea piping, provides consistent, long-term growth prospects for specialty and high-performance pipe manufacturers
- Government initiatives focusing on clean water access, sanitation, and environmental infrastructure—as seen in the EU Green Deal—mandate upgrading of outdated water and wastewater systems, further boosting demand for advanced pipe solutions
- Ongoing modernization of industrial facilities, driven by automation and stricter environmental controls, propels investment in durable and efficient piping as a backbone of reliable operations in manufacturing and process industries
Restraint/Challenge
“Increasing Environmental Concerns on Disposable Pipes”
- Growing environmental concerns over the use and disposal of non-recyclable or short-lifespan pipes—particularly single-use plastics and lower-grade composites—are prompting regulatory pressures and shifts in buyer preferences across key sectors
- For instance, the European Union has introduced directives encouraging the phase-out of non-sustainable pipes and replacement with recyclable, lower-impact alternatives, creating both compliance challenges and cost pressures for manufacturers still reliant on traditional plastics
- Stringent requirements for waste management and circular economy practices increase the complexity of pipe production, installation, and end-of-life handling—especially for construction, agriculture, and water utility applications
- Consumer and industry pushback against products with poor lifecycle sustainability, as well as the risk of microplastic pollution from aging or fragmented pipes, shapes procurement policies in public and private infrastructure projects
- Innovation and investment are needed to improve recycling technologies, extend pipe service life, and develop eco-friendly materials—factors that can increase upfront costs and slow market penetration for less sustainable pipe products
Pipe Market Scope
The market is segmented on the basis of material, manufacturing processes, category, size, and industry.
- By Material
On the basis of material, the market is segmented into non-metallic pipe and metallic pipe. The metallic pipe segment dominated the largest market revenue share in 2024, driven by its durability, strength, and ability to withstand high pressure and temperature conditions. These characteristics make metallic pipes highly suitable for heavy-duty infrastructure and industrial applications. Their widespread use across oil and gas, water supply, and building systems reinforces their market dominance due to their performance reliability and long service life.
The non-metallic pipe segment is anticipated to witness the fastest growth rate from 2025 to 2032, fueled by increasing demand in residential and lightweight infrastructure projects. Non-metallic pipes offer corrosion resistance, easy installation, and lower cost, which makes them attractive for applications in water distribution and drainage systems. Their compatibility with eco-friendly construction practices further accelerates their adoption in sustainable infrastructure development.
- By Manufacturing Processes
On the basis of manufacturing processes, the market is segmented into seamless pipe manufacturing, electric resistance welding (ERW) pipe manufacturing, submerged arc welding (SAW) pipe manufacturing, double submerged arc welding (DSAW) pipe manufacturing, and seamless and welded pipe manufacturing process. The seamless pipe manufacturing segment held the largest market revenue share in 2024 driven by its ability to produce high-strength, uniform pipes ideal for critical pressure applications. Seamless pipes are preferred in sectors such as oil and gas and power generation due to their superior integrity and reduced risk of leakage.
The ERW pipe manufacturing segment is expected to witness the fastest CAGR from 2025 to 2032, driven by its cost-effectiveness, production efficiency, and suitability for medium- to low-pressure applications. ERW pipes are widely adopted in construction, water pipelines, and transportation due to their consistent quality and adaptability to various pipe sizes.
- By Category
On the basis of category, the market is segmented into pressure pipe and non-pressure pipe. The pressure pipe segment dominated the largest market revenue share of 71.7% in 2024, supported by strong demand from water supply systems, oil and gas pipelines, and industrial fluid transport. Pressure pipes are engineered to handle high internal pressure, making them essential for secure fluid conveyance in mission-critical applications.
The non-pressure pipe segment is anticipated to witness the fastest growth rate from 2025 to 2032, fueled by growing use in drainage, sewage, and ventilation systems. These pipes are cost-efficient and simpler to install, meeting the needs of expanding urban infrastructure and municipal projects.
- By Size
On the basis of size, the market is segmented into up to 1/2'', 1/2–1'', 1–2'', 2–5'', 5–10'', 10–20'', and above 20''. The 2–5'' segment accounted for the largest market revenue share in 2024, driven by its widespread application in residential plumbing, commercial piping, and municipal distribution systems. This size range offers an optimal balance between flow capacity and installation flexibility, making it a standard choice across infrastructure projects.
The above 20'' segment is projected to witness the fastest growth rate from 2025 to 2032, driven by rising investments in large-scale oil and gas transmission lines and industrial process systems. These large-diameter pipes support high-volume throughput, essential for long-distance and high-capacity infrastructure.
- By Industry
On the basis of industry, the market is segmented into water infrastructure, oil and gas infrastructure, building infrastructure, and industrial infrastructure. The oil and gas infrastructure segment held the largest market revenue share in 2024, driven by ongoing exploration and pipeline expansion projects globally. This segment relies heavily on high-performance piping systems for transportation and processing of hydrocarbons under extreme conditions.
The building infrastructure segment is expected to witness the fastest CAGR from 2025 to 2032, fueled by urbanization, real estate development, and modern plumbing and HVAC installations. Demand for high-efficiency piping in residential and commercial buildings supports this segment’s accelerated growth.
Pipe Market Regional Analysis
- U.S. dominated the pipe market with the largest revenue share of 75.2% in 2024, driven by ongoing investments in water infrastructure, oil and gas pipeline upgrades, and industrial facility expansions
- The country benefits from a well-established manufacturing base, stringent regulatory standards, and the presence of leading industry players offering advanced piping solutions for high-pressure and corrosive environments. Growth in shale gas exploration and urban infrastructure modernization further strengthens demand across sectors
- Increasing federal funding for infrastructure projects, combined with the adoption of sustainable pipe materials and smart monitoring technologies, continues to reinforce market expansion across municipal, energy, and industrial applications
Canada Pipe Market Insight
Canada is projected to register the fastest CAGR in the North America pipe market from 2025 to 2032, supported by rising investments in energy transport, clean water systems, and green infrastructure. The country’s commitment to upgrading aging water pipelines and expanding oil sands transportation networks is boosting demand for high-performance metallic and composite piping. Provinces such as Alberta and British Columbia are leading in pipeline development, supported by regulatory support and public-private partnerships aimed at enhancing pipeline safety, durability, and environmental compliance.
Mexico Pipe Market Insight
Mexico is expected to witness steady growth in the pipe market between 2025 and 2032, fueled by rapid urbanization, industrial development, and energy infrastructure expansion. The government’s focus on modernizing water supply and wastewater systems, along with increased investments in gas distribution and manufacturing plants, is driving demand for both metallic and non-metallic piping solutions. Collaborations with U.S. and European firms are facilitating the adoption of advanced manufacturing technologies and corrosion-resistant materials, contributing to improved pipe performance and sustained market growth.
Pipe Market Share
The pipe industry is primarily led by well-established companies, including:
- JM Eagle, Inc. (U.S.)
- Advanced Drainage Systems (U.S.)
- Chevron Phillips Chemical Company LLC (U.S.)
- Charlotte Pipe And Foundry (U.S.)
- Aliaxis Holdings SA (Belgium)
- Atkore (U.S.)
- Contech Engineered Solutions LLC (U.S.)
- Furukawa Electric Co., Ltd. (U.S.)
- Lane Enterprises, INC. (U.S.)
- Nucor Tubular Products (U.S.)
- Orbia (Mexico)
- Pestan North America (U.S.)
- Prinsco, Inc. (U.S.)
- Uponor North America (U.S.)
- Westlake Pipe & Fittings (U.S.)
- WL Plastics (U.S.)
Latest Developments in North America Pipe Market
- In August 2024, Advanced Drainage Systems (ADS) partnered with Geoplast to distribute the Aquabox stormwater retention system in the U.S. This collaboration expands ADS's stormwater management portfolio, offering innovative, high-capacity solutions for urban flood control and sustainable water management, enhancing its market leadership
- In July 2024, Chevron Phillips Chemica Company LLC. has received 11 safet awards from the Texas Chemica Council (TCC) for excellence in safet and operational performance Facilities in Borger, Pasadena, Por Arthur, Cedar Bayou, and Sween were honored with Caring for Texa Awards for their achievements I community awareness, emergenc response, security, and pollution prevention. The Conroe and Orang facilities were recognized with the Zero Incident Award and the Dr. Sa Mannan Award for achieving no OSH recordable injuries or Tier 1/ incidents The safety awards enhance Chevro Phillips Chemical’s reputation demonstrate compliance, boos morale, attract talent, and reduce incident-related costs
- In October 2023, Charlotte Pipe and Foundry unveiled its New USD 460 million Advanced Foundry I Oakboro, North Carolina. This reflects the company’s commitment to growth, local investment, and environmental responsibility
- In May 2023, Charlotte Pipe and Foundry invested US 80 million to build a new 134,000-square-foot manufacturing facility in Maize, Kansas. The plan will create 50 new jobs and enhance PVC pipe production, supported by local and state officials and key business partners
- In December 2022, Prince Pipes and Fittings Limited (PPFL), a Fortune 500 piping solutions provider and multi-polymer manufacturer, announced the launch of two advanced plumbing and drainage solutions—Skolan Safe Premium PP Silent Drainage Systems and Prince Hauraton. This strategic expansion of its product portfolio is expected to strengthen PPFL’s position in the high-performance drainage segment, addressing growing demand for noise-reducing and durable systems in modern infrastructure. The introduction is likely to drive market competitiveness and accelerate the adoption of advanced drainage technologies across residential and commercial projects in India
SKU-

- Interactive Data Analysis Dashboard
- Company Analysis Dashboard for high growth potential opportunities
- Research Analyst Access for customization & queries
- Competitor Analysis with Interactive dashboard
- Latest News, Updates & Trend analysis
- Harness the Power of Benchmark Analysis for Comprehensive Competitor Tracking
North America Pipe Market, Supply Chain Analysis and Ecosystem Framework
To support market growth and help clients navigate the impact of geopolitical shifts, DBMR has integrated in-depth supply chain analysis into its North America Pipe Market research reports. This addition empowers clients to respond effectively to global changes affecting their industries. The supply chain analysis section includes detailed insights such as North America Pipe Market consumption and production by country, price trend analysis, the impact of tariffs and geopolitical developments, and import and export trends by country and HSN code. It also highlights major suppliers with data on production capacity and company profiles, as well as key importers and exporters. In addition to research, DBMR offers specialized supply chain consulting services backed by over a decade of experience, providing solutions like supplier discovery, supplier risk assessment, price trend analysis, impact evaluation of inflation and trade route changes, and comprehensive market trend analysis.
Data collection and base year analysis are done using data collection modules with large sample sizes. The stage includes obtaining market information or related data through various sources and strategies. It includes examining and planning all the data acquired from the past in advance. It likewise envelops the examination of information inconsistencies seen across different information sources. The market data is analysed and estimated using market statistical and coherent models. Also, market share analysis and key trend analysis are the major success factors in the market report. To know more, please request an analyst call or drop down your inquiry.
The key research methodology used by DBMR research team is data triangulation which involves data mining, analysis of the impact of data variables on the market and primary (industry expert) validation. Data models include Vendor Positioning Grid, Market Time Line Analysis, Market Overview and Guide, Company Positioning Grid, Patent Analysis, Pricing Analysis, Company Market Share Analysis, Standards of Measurement, Global versus Regional and Vendor Share Analysis. To know more about the research methodology, drop in an inquiry to speak to our industry experts.
Data Bridge Market Research is a leader in advanced formative research. We take pride in servicing our existing and new customers with data and analysis that match and suits their goal. The report can be customized to include price trend analysis of target brands understanding the market for additional countries (ask for the list of countries), clinical trial results data, literature review, refurbished market and product base analysis. Market analysis of target competitors can be analyzed from technology-based analysis to market portfolio strategies. We can add as many competitors that you require data about in the format and data style you are looking for. Our team of analysts can also provide you data in crude raw excel files pivot tables (Fact book) or can assist you in creating presentations from the data sets available in the report.


