
North America Plant Based Colorants Market
Market Size in USD Million
 USD
799.71 Million
USD
1,499.45 Million
2025
2033
USD
799.71 Million
USD
1,499.45 Million
2025
2033
| 2026 - 2033 | |
| USD 799.71 Million | |
| USD 1,499.45 Million | |
| % | |
|
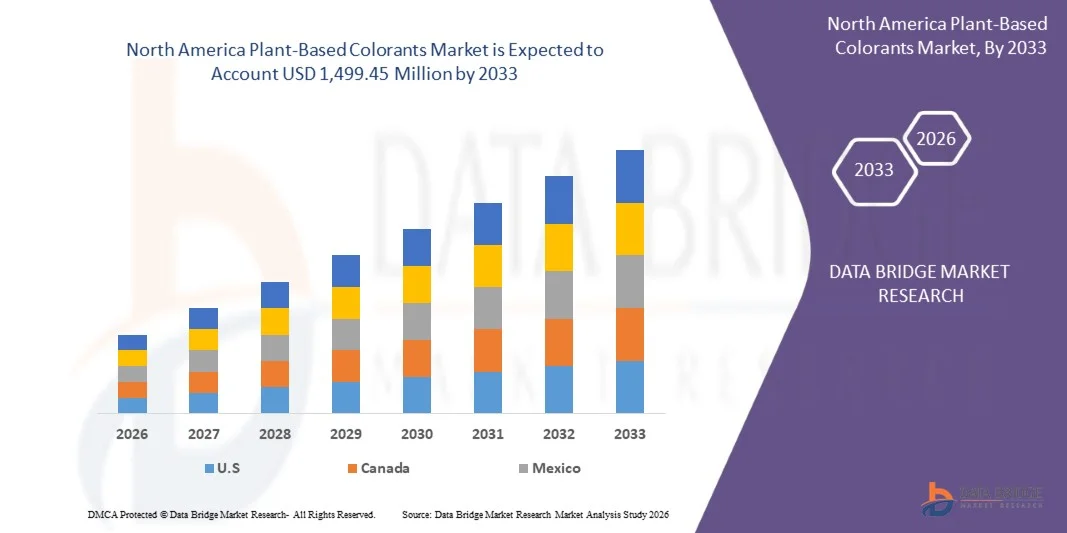
North America Plant-Based Colorants Market Size
- The North America Plant-Based Colorants Market is expected to reach USD 1,499.45 million by 2033 from USD 799.71 million in 2025, growing with a substantial CAGR of 8.2% in the forecast period of 2026 to 2033
- Rising consumer demand for clean-label, natural, and recognizable food ingredients is a primary driver of the North America Plant-Based Colorants Market. Across developed and emerging economies, consumers are increasingly scrutinizing ingredient lists and actively avoiding artificial additives, particularly synthetic food colors perceived as chemically derived or health-concerning. Plant-Based colorants align closely with consumer expectations around transparency, simplicity, and natural sourcing.
- Market expansion is further supported by the increasing regulatory scrutiny on synthetic food colorants, with authorities tightening approvals, labeling requirements, and usage limits across U.S., and parts of North America, prompting proactive reformulation.
North America Plant-Based Colorants Market Analysis
- Rising consumer demand for clean-label, natural, and recognizable food ingredients is a primary driver of the North America Plant-Based Colorants Market. Across developed and emerging economies, consumers are increasingly scrutinizing ingredient lists and actively avoiding artificial additives, particularly synthetic food colors perceived as chemically derived or health-concerning. Plant-Based colorants align closely with consumer expectations around transparency, simplicity, and natural sourcing.
- Corporate sustainability and portfolio transformation initiatives among global food and beverage companies are increasingly supporting the adoption of plant-Based colorants. Leading manufacturers are embedding naturally derived color solutions within broader ESG, wellness, and clean-label strategies, positioning natural colors not merely as regulatory substitutes but as value-adding, brand-enhancing ingredients. As consumers associate natural ingredients with transparency and trust, companies are leveraging plant-Based colorants to strengthen brand equity and align product portfolios with long-term sustainability commitments.
- U.S. is the dominant country in the North America Plant-Based Colorants Market, accounting for over 77.62% market share in 2025, driven by strong consumer demand for clean-label and natural ingredients, strict regulations limiting synthetic dyes, a well-established food & beverage processing industry, and the growing adoption of plant-derived colors across bakery, beverages, dairy alternatives, and confectionery products, along with continuous innovation by leading natural color manufacturers.
- U.S. is also the fastest-growing country in the North America Plant-Based Colorants Market, with a CAGR of around 8.4%, supported by rising consumer awareness of natural and clean-label food ingredients, rapid expansion of the processed food and beverage industry, increasing health consciousness, and growing demand for plant-derived additives across dairy alternatives, snacks, beverages, and confectionery, along with expanding manufacturing capacities and regulatory support for natural color solutions.
- Carotenoids are dominating the North America Plant-Based Colorants Market with a significant market share of 36.12% in 2025 driven by strong demand for natural yellow, orange, and red hues derived from sources such as carrots, paprika, annatto, and algae. Carotenoids are widely preferred due to their dual functionality as both colorants and antioxidants, along with clean-label appeal and health benefits such as provitamin A activity. Extensive usage across beverages, dairy, confectionery, sauces, and processed foods, combined with growing regulatory restrictions on synthetic dyes, further strengthens the segment’s leadership position.
Report Scope and North America Plant-Based Colorants Market Segmentation
|
Attributes |
Plant-Based Colorants Key Market Insights |
|
Segments Covered |
|
|
Countries Covered |
North America
|
|
Key Market Players |
|
|
Market Opportunities |
|
|
Value Added Data Infosets |
In addition to the insights on market scenarios such as market value, growth rate, segmentation, geographical coverage, and major players, the market reports curated by the Data Bridge Market Research also include in-depth expert analysis, pricing analysis, brand share analysis, consumer survey, demography analysis, supply chain analysis, value chain analysis, raw material/consumables overview, vendor selection criteria, PESTLE Analysis, Porter Analysis, and regulatory framework. |
North America Plant-Based Colorants Market Trends
“Rising Demand for Plant-Based Colorants in Animal Feed”
- The use of plant-Based colorants in animal feed-particularly in poultry and aquaculture-is emerging as a significant growth opportunity. Natural pigments such as marigold extract (lutein), paprika, and spirulina are increasingly incorporated into feed formulations to enhance yolk color, skin pigmentation, and flesh coloration, while also supporting clean-label and natural feed positioning.
- Rising consumer awareness of food quality, health, and sustainability is encouraging feed manufacturers to replace synthetic colorants with plant-derived alternatives, creating a broader market for natural pigments in animal nutrition.
- At the operational level, feed producers are reformulating diets to ensure consistent pigment deposition, stability during feed processing, and visual appeal of end products. Poultry eggs, chicken skin, and aquaculture flesh increasingly feature standardized color profiles achieved through natural carotenoids, which can also convey perceived higher quality to end consumers.
- The integration of plant-Based pigments allows manufacturers to differentiate their feed products, respond to regulatory scrutiny on synthetic additives, and align with consumer demand for naturally derived ingredients in animal-derived foods.
- In addition to visual benefits, plant-Based colorants are increasingly leveraged for nutritional or functional value. For instance, lutein from marigold extract provides antioxidant properties, while spirulina contributes protein and micronutrients alongside pigmentation, allowing feed companies to offer multi-benefit solutions. This dual functionality enhances value propositions for both farmers and consumers, reinforcing the adoption of natural pigments in animal feed systems.
North America Plant-Based Colorants Market Dynamics
Driver
“Rising Consumer Demand for Clean-Label and Natural Ingredients ”
- Rising consumer demand for clean-label, natural, and recognizable food ingredients is a primary driver of the North America Plant-Based Colorants Market. Across developed and emerging economies, consumers are increasingly scrutinizing ingredient lists and actively avoiding artificial additives, particularly synthetic food colors perceived as chemically derived or health-concerning.
- Plant-Based colorants align closely with consumer expectations around transparency, simplicity, and natural sourcing.
- Food and beverage brands are responding by reformulating products to replace artificial dyes with colors derived from beetroot, turmeric, spirulina, paprika, annatto, and fruit concentrates. This shift is particularly visible in categories such as beverages, confectionery, dairy alternatives, and children’s food products, where visual appeal and perceived safety strongly influence purchase decisions.
- In conclusion, rising consumer demand for clean-label and natural ingredients is fundamentally reshaping food and beverage formulation strategies worldwide. Brands are under increasing pressure to replace synthetic additives with recognizable, naturally sourced components that align with transparency, health, and sustainability expectations.
- Plant-Based colorants are becoming a critical solution in this transition, enabling manufacturers to maintain visual appeal while meeting clean-label claims. As regulatory scrutiny increases and global food companies commit to reformulation and ingredient simplification, the adoption of plant-derived colors is moving from a short-term trend to a structural requirement. This shift is anchoring long-term, stable demand for plant-Based colorants across global food systems.
Restraint/Challenge
“Limited Consumer and Manufacturer Understanding of Application-Specific Performance Requirements ”
- A major challenge for plant-Based colorant adoption remains limited formulation knowledge and technical expertise among food manufacturers-especially small and mid-scale producers-regarding correct color selection, optimal dosing, and processing compatibility.
- Unlike synthetic dyes, many natural pigments vary in hue, strength, and behavior under different heat, pH, and light conditions, making it difficult to deliver consistent results without specialized food science understanding and testing. Insufficient awareness of how plant-Based colors interact with complex food matrices often results in reformulation delays, off-shade outcomes, or the need for extensive trial and error before products reach shelf-ready quality.
- Moreover, plant-Based color supply chains are inherently complex and vulnerable to climatic, logistical, and geopolitical disruptions due to their dependence on agricultural sourcing. Natural colorants are harvested from crops such as beetroot, turmeric, annatto, and spirulina, all of which can experience yield fluctuations due to weather extremes, pest pressures, and seasonal variances.
- In addition to crop volatility, inconsistencies in harvest timing and pigment quality create challenges in maintaining stable inventories and consistent batch performance for food manufacturers.
- These dynamics are further complicated by international supply chain issues. For instance, tariffs, trade fragmentation, and fluctuating freight conditions can increase lead times and costs for importing plant pigment sources, while differing regulatory standards across regions (such as varying approval statuses for specific natural colorants) require manufacturers to navigate additional compliance steps to serve multiple markets effectively.
North America Plant-Based Colorants Market Scope
The North America Plant-Based Colorants Market is segmented into seven notable segments based on the product type, type, color, form, solubility, end use, and distribution channel.
- By Product Type
On the basis of product type, the North America Plant-Based Colorants Market is segmented into carotenoids, anthocyanins, chlorophylls, betalains, curcumin, paprika extract, spirulina extract, gardenia yellow, saffron extract, annatto, and others. In 2026, the carotenoids segment is expected to dominate the market with an 36.06% share due to its widespread application across food, beverages, cosmetics, and pharmaceuticals. Carotenoids offer strong color stability, antioxidant properties, and natural health benefits, making them highly preferred. Additionally, their diverse color range from yellow to red and superior extraction efficiency compared to other plant-Based pigments support their market leadership.
The Anthocyanins segment is projected to grow the fastest from 2026 to 2033, at a CAGR of 8.9%, driven by rising consumer preference for clean-label, naturally derived red, purple, and blue colorants sourced from fruits and vegetables such as berries, grapes, purple sweet potatoes, and red cabbage. Growing demand for antioxidant-rich and functional food ingredients, increasing adoption in beverages, dairy alternatives, confectionery, and plant-Based products, and strong interest in minimally processed and premium formulations are accelerating segment growth. Additionally, regulatory pressure to replace synthetic dyes and expanding applications in health-focused and organic product lines further support its rapid expansion globally.
- By Type
On the basis of type, the North America Plant-Based Colorants Market is segmented into pigments, dyes, masterbatches, color concentrates, and others. In 2026, the pigments segment is expected to dominate the market with an 44.38% share because pigments provide higher color intensity, better stability, and broader application versatility. They are preferred across food, cosmetics, textiles, and industrial coatings due to their consistent performance and long shelf life. Increasing demand for natural colorants with enhanced visual appeal, combined with technological advancements in pigment extraction and stabilization, further strengthens their dominant position in the global market.
The Dyes segment holds a substantial share in the North America Plant-Based Colorants Market and is projected to grow steadily from 2026 to 2033, at a CAGR of 8.7%, driven by strong demand for water-soluble, high-stability color solutions that provide uniform dispersion and vibrant shades across beverages, confectionery, bakery, dairy, and processed foods. Plant-derived dyes are increasingly preferred due to their clean-label positioning, ease of formulation, and compatibility with liquid and low-fat applications. Rising regulatory restrictions on synthetic additives, along with growing consumer awareness of natural ingredients and sustainable sourcing, further supports consistent adoption across both foodservice and packaged food manufacturers.
- By Color
On the basis of color, the North America Plant-Based Colorants Market is segmented into red, yellow, orange, green, blue, brown, black, purple, pink, white/off-white, gray/silver, gold, beige, and others. In 2026, the red segment is expected to dominate the market with a market share of 23.22% due to its extensive use in food and beverages, cosmetics, and pharmaceuticals. Red colorants, primarily derived from beetroot, anthocyanins, and paprika, are highly popular for enhancing visual appeal and signaling freshness and quality. High consumer preference for red shades and wide industrial applicability support this segment’s growth.
The Yellow is the fastest growing segment from 2026 to 2033, at a CAGR of 8.7%, driven by strong demand for bright, natural yellow shades derived from sources such as turmeric, annatto, saffron, and marigold. Yellow colorants are widely used across beverages, dairy products, snacks, bakery, sauces, and ready-to-eat foods due to their visual appeal, stability, and compatibility with clean-label formulations. Increasing consumer preference for natural ingredients, along with the replacement of synthetic dyes like tartrazine, further supports consistent growth and widespread adoption of this segment globally.
- By Form
On the basis of form, the North America Plant-Based Colorants Market is segmented into powder, liquid/paste, and granules/pellets. Liquid/Paste is further sub segmented into water-Based and oil-based. In 2026, the powder segment is expected to dominate the market with a market share of 54.85%, owing to its long shelf life, ease of handling, storage, and incorporation across multiple applications. Powdered colorants offer high stability, precise dosing, and cost efficiency compared to liquid forms. Industries such as food processing, cosmetics, pharmaceuticals, and textiles prefer powdered formulations for consistent performance, superior blending, and minimal risk of microbial contamination, ensuring their widespread adoption globally.
The Liquid/Paste segment is expected to witness fastest growth in the North America Plant-Based Colorants Market, expanding at a projected CAGR of 8.7% from 2026 to 2033, driven by its ease of blending, uniform dispersion, and ready-to-use convenience in large-scale food and beverage processing. These formats are highly preferred by manufacturers for applications in beverages, sauces, dairy, bakery batters, and confectionery due to their consistent color intensity, faster incorporation, and reduced processing time. Additionally, improved stability, extended shelf life, and compatibility with clean-label and natural formulations further support increasing adoption across both industrial and foodservice sectors.
- By Solubility
On the basis of solubility, the North America Plant-Based Colorants Market is segmented into water-soluble, oil-soluble, and solvent-soluble. In 2026, the water-soluble segment is expected to dominate the market with 59.95% market share, due to its high compatibility with beverages, dairy products, confectionery, and pharmaceutical formulations. Water-soluble colorants are easier to process, blend, and stabilize in aqueous solutions compared to oil- or solvent-soluble variants. Their cost-effectiveness, broader application range, and growing demand in clean-label food and beverage products drive the prominence of water-soluble plant-Based colorants globally.
The Oil-Soluble segment is anticipated as the fastest growing in the North America Plant-Based Colorants Market, advancing at a projected CAGR of 8.6% from 2026 to 2033, driven by rising demand for fat-dispersible natural colors that deliver superior stability and vibrancy in lipid-rich formulations. These colorants are widely used in applications such as chocolates, confectionery coatings, butter and margarine, snacks, spreads, and bakery fillings, where water-Based colors are less effective. Their ability to provide uniform coloration without phase separation, along with growing preference for clean-label and naturally sourced ingredients, continues to strengthen adoption across processed and premium food products globally.
- By End use
On the basis of end use, the North America Plant-Based Colorants Market is segmented into food & beverage, cosmetics & personal care, textile industry, paints & coatings, packaging, pharmaceutical, plastics & rubber, printing, and others. Among these, food & beverage is further sub-segmented by application into beverages, confectionery, dairy products, bakery products, meat & poultry, sauces & condiments, and others. In 2026, the Food & Beverage segment is expected to dominate the global market with a significant market share of around 38.93%, driven by rising consumer preference for clean-label ingredients, natural food additives, and synthetic dye replacements. Strong demand from processed foods, beverages, confectionery, dairy products, and bakery applications—particularly across North America and Europe, where regulatory restrictions on artificial colors and health-conscious consumption trends are prominent—continues to accelerate adoption of plant-derived color solutions.
The Cosmetics & Personal Care segment is emerging as a high-growth application area in the North America Plant-Based Colorants Market, projected to expand at a CAGR of 8.7% from 2026 to 2033, driven by increasing consumer preference for natural, non-toxic, and skin-friendly ingredients in beauty and personal care products. Plant-Based pigments derived from sources such as beetroot, turmeric, spirulina, and annatto are widely used in lipsticks, foundations, creams, soaps, and hair care formulations due to their safety profile, biodegradability, and clean-label appeal. Rising demand for organic, vegan, and sustainable cosmetics, along with stricter regulations on synthetic dyes, further accelerates adoption across both mass-market and premium product lines.
- By Distribution Channel
On the basis of distribution channel, the North America Plant-Based Colorants Market is segmented into direct and indirect. In 2026, the direct segment is expected to dominate the market with market share of 62.89% % due to stronger manufacturer-to-end-user relationships, better quality control, and reliable supply chains. Direct distribution allows suppliers to offer customized solutions, bulk supply, and technical support to food, cosmetic, pharmaceutical, and industrial clients. The growing preference for strategic partnerships, streamlined procurement, and reduced intermediaries strengthens the dominance of direct sales channels in the North America Plant-Based Colorants Market.
The Indirect segment is projected to grow at the fastest rate in the North America Plant-Based Colorants Market, registering a CAGR of 8.7% from 2026 to 2033, driven by expanding use of plant-derived colorants in indirect applications such as food packaging, coatings, printing inks, pharmaceuticals, and nutraceutical capsules. Increasing regulatory emphasis on non-toxic, biodegradable, and sustainable materials is encouraging manufacturers to replace synthetic pigments with natural alternatives. Additionally, growing demand for eco-friendly packaging solutions and clean-label compliance across supply chains further accelerates adoption, positioning the indirect segment as a key growth avenue for plant-Based colorants globally.
North America Plant-Based Colorants Market Regional Analysis
- The U.S. dominates the North American market due to large-scale food processing, strong clean-label trends, and significant R&D investments in botanical extracts and natural pigments. Major brands are reformulating products with plant-Based colors to replace artificial dyes and comply with evolving regulatory and consumer standards.
- Canada is the fastest-growing market in North America, supported by rising demand for organic and plant-Based foods, expanding health-conscious consumer bases, and favorable regulations promoting natural additives. Growth in functional beverages, bakery, and dairy alternatives further drives adoption of plant-derived color solutions.
U.S. North America Plant-Based Colorants Market Insight
The U.S. North America Plant-Based Colorants Market dominates North America, supported by a large processed food and beverage industry, strong clean-label trends, and high consumer awareness regarding natural ingredients. Food manufacturers are actively reformulating products to replace artificial dyes with plant-derived alternatives to comply with evolving FDA guidelines and meet consumer expectations.
Growth is further strengthened by extensive R&D investments, innovation in natural pigment sources such as beetroot, turmeric, spirulina, and paprika, and increasing application across confectionery, beverages, snacks, and plant-Based foods. The strong presence of leading ingredient suppliers, coupled with demand from cosmetics and personal care brands for botanical colorants, continues to solidify the U.S. as the primary revenue contributor in the region.
Canada North America Plant-Based Colorants Market Insight
The Canada North America Plant-Based Colorants Market is one of the fastest-growing country in North America, driven by rising adoption of organic, non-GMO, and plant-Based food products and increasing consumer preference for healthier, naturally formulated alternatives. Growing demand for functional foods, natural beverages, and clean-label packaged products is encouraging manufacturers to incorporate plant-derived colors into their formulations.
The market also benefits from supportive regulatory policies, expanding health-conscious demographics, and rapid growth of specialty and natural retail chains. Innovation in sustainable sourcing, eco-friendly packaging, and locally produced botanical extracts further accelerates adoption. As consumers increasingly prioritize transparency and environmental responsibility, Canada is emerging as a key high-growth market for plant-Based colorants.
North America Plant-Based Colorants Market
The Plant-Based Colorants industry is primarily led by well-established companies, including:
- Allied Biotech Corporation (Taiwan)
- Archer Daniels Midland Company (U.S.)
- LYCORED LTD (Israel)
- SAN-EI GEN F.F.I., INC. (Japan)
- BASF SE (Germany)
- SYMRISE AG (Germany)
- DIC CORPORATION (Japan)
- VINAYAK INGREDIENTS (INDIA) PVT. LTD (India)
- Dohler GmbH (Germany)
- Kalsec Inc (U.S.)
- Oterra A/S (Denmark)
- Givaudan (Switzerland)
- Sensient Technologies Corporation (U.S.)
- ROHA DYECHEM PVT LTD. (India)
- DSM-Firmenich AG (Switzerland)
- EXBERRY (GNT GROUP) (Netherlands)
- PLANT LIPIDS (India)
- SYNTHITE INDUSTRIES PVT LTD. (India)
- Chenguang Biotech Group Co., Ltd (China)
- BIOCON COLORS (Netherlands)
- SECNA NATURAL INGREDIENTS GROUP (Spain)
- IMBAREX (Peru)
Latest Developments in North America Plant-Based Colorants Market
- In December 2023, Oterra partnered with Ecoflora Cares after FDA approval of Jagua blue—a stable, plant-Based natural blue pigment from Colombian jagua fruit (Genipa americana)—enabling vibrant blues, greens, and purples for beverages, confectionery, cereals, and snacks with pH/light/heat stability.
- In May 2025, Givaudan Sense Colour launched Everzure™ Galdieria, a new natural blue pigment derived from the microalgae Galdieria sulphuraria that received US FDA approval as an acid-stable, phycocyanin-rich alternative to synthetic Blue 1, enabling vibrant blues, greens, and purples in beverages, confections, and other pH-sensitive applications with complete traceability, scalable fermentation-Based production, and improved acid/light/heat stability for clean-label formulations.
- In February 2024, Sensient highlighted accelerating plant-Based food innovation, noting that shifting consumer preferences are pushing food manufacturers to reformulate products using plant-derived ingredients, reinforcing demand for clean-label solutions across flavours, textures, and supporting components such as natural colours.
- In January 2026, ADM announced a USD 26 Million investment in its Erlanger, Kentucky facility, highlighting accelerating reformulation trends as shifting consumer preferences—over 80% favoring cleaner labels—push food manufacturers to replace synthetic dyes with plant-derived colorants from natural sources like fruits and vegetables.
SKU-

- Interactive Data Analysis Dashboard
- Company Analysis Dashboard for high growth potential opportunities
- Research Analyst Access for customization & queries
- Competitor Analysis with Interactive dashboard
- Latest News, Updates & Trend analysis
- Harness the Power of Benchmark Analysis for Comprehensive Competitor Tracking
Table of Content
1 INTRODUCTION
1.1 OBJECTIVES OF THE STUDY
1.2 MARKET DEFINITION
1.3 OVERVIEW OF NORTH AMERICA PLANT-BASED COLORANTS MARKET
1.4 CURRENCY AND PRICING
1.5 LIMITATIONS
1.6 MARKETS COVERED
2 MARKET SEGMENTATION
2.1 MARKETS COVERED
2.2 GEOGRAPHICAL SCOPE
2.3 YEARS CONSIDERED FOR THE STUDY
2.4 DBMR TRIPOD DATA VALIDATION MODEL
2.5 PRIMARY INTERVIEWS WITH KEY OPINION LEADERS
2.6 DBMR MARKET POSITION GRID
2.7 VENDOR SHARE ANALYSIS
2.8 MULTIVARIATE MODELING
2.9 PRODUCT TYPE TIMELINE CURVE
2.1 MARKET END-USER COVERAGE GRID
2.11 SECONDARY SOURCES
2.12 ASSUMPTIONS
3 EXECUTIVE SUMMARY
4 PREMIUM INSIGHTS
4.1 PORTER’S FIVE FORCES ANALYSIS – NORTH AMERICA PLANT BASED COLORANTS MARKET
4.1.1 THREAT OF NEW ENTRANTS – MODERATE
4.1.1.1 CAPITAL REQUIREMENT
4.1.1.2 PRODUCT KNOWLEDGE
4.1.1.3 TECHNICAL KNOWLEDGE
4.1.1.4 CUSTOMER RELATION
4.1.1.5 ACCESS TO APPLICATION AND TECHNOLOGY
4.1.2 THREAT OF SUBSTITUTES – MODERATE TO HIGH
4.1.2.1 COST
4.1.2.2 PERFORMANCE
4.1.2.3 AVAILABILITY
4.1.2.4 TECHNICAL KNOWLEDGE
4.1.2.5 DURABILITY
4.1.3 BARGAINING POWER OF BUYERS – MODERATE TO HIGH
4.1.3.1 NUMBER OF BUYERS RELATIVE TO SUPPLIERS
4.1.3.2 PRODUCT DIFFERENTIATION
4.1.3.3 THREAT OF FORWARD INTEGRATION
4.1.3.4 BUYER VOLUME
4.1.4 BARGAINING POWER OF SUPPLIERS – MODERATE
4.1.4.1 SUPPLIER CONCENTRATION
4.1.4.2 BUYER SWITCHING COST TO OTHER SUPPLIERS
4.1.4.3 THREAT OF BACKWARD INTEGRATION
4.1.5 INTENSITY OF COMPETITIVE RIVALRY – HIGH
4.1.5.1 INDUSTRY CONCENTRATION
4.1.5.2 INDUSTRY GROWTH RATE
4.1.5.3 PRODUCT DIFFERENTIATION
4.1.6 CONCLUSION:-
4.2 PRICING ANALYSIS
4.3 SUPPLY CHAIN ANALYSIS
4.3.1 OVERVIEW
4.3.2 LOGISTICS COST SCENARIO
4.3.3 IMPORTANCE OF LOGISTICS SERVICE PROVIDERS
4.4 VALUE CHAIN ANALYSIS - NORTH AMERICA PLANT-BASED COLORANTS MARKET
4.4.1 RAW MATERIAL SUPPLIERS: PROVIDING BOTANICAL PIGMENTS AND EXTRACTS
4.4.2 TECHNOLOGY PROVIDERS: ENABLING PERSONALIZATION THROUGH DATA AND ANALYTICS
4.4.3 MANUFACTURERS AND FORMULATORS: PRODUCING APPLICATION-READY COLORANTS
4.4.4 EQUIPMENT AND PACKAGING PROVIDERS: ENSURING SAFE PROCESSING & SHELF STABILITY
4.4.5 DISTRIBUTION AND LOGISTICS PARTNERS: SUPPORTING NORTH AMERICA DELIVERY
4.4.6 END-USE CONSUMERS & SERVICE PROVIDERS: DRIVING DEMAND
4.4.7 REGULATORY BODIES AND STANDARDS ORGANIZATIONS
4.4.8 SUSTAINABILITY AND INNOVATION DRIVERS
4.5 BRAND OUTLOOK
4.6 CONSUMERS BUYING BEHAVIOUR
4.6.1 SHIFT FROM PRICE-BASED TO VALUE- AND COMPLIANCE-DRIVEN PURCHASING
4.6.2 STRONG DEMAND FOR APPLICATION-SPECIFIC PLANT-BASED COLOR SOLUTION
4.6.3 GROWING IMPORTANCE OF CONSISTENCY, QUALITY, AND SUPPLY RELIABILITY
4.6.4 INCREASING INFLUENCE OF REGULATORY TRUST AND LABELING CONFIDENCE
4.6.5 RISING DEMAND FOR INNOVATION IN PLANT-BASED COLOR PERFORMANCE
4.6.6 SUSTAINABILITY AND MATERIAL ORIGIN AWARENESS AS EMERGING FACTORS
4.6.7 PREFERENCE FOR WIDE AVAILABILITY AND LOGISTICS CONTINUITY
4.6.8 COMMERCIAL BUYER’S FOCUS ON CONSISTENCY, PRICING STABILITY, AND SUPPLY RELIABILITY
4.6.9 INFLUENCE OF GEOPOLITICAL AND REGULATORY CONDITIONS ON BUYING PATTERNS
4.6.10 CONCLUSION
4.7 VENDOR SELECTION CRITERIA
4.7.1 QUALITY AND BOTANICAL CERTIFICATION STANDARDS
4.7.2 MANUFACTURING CAPABILITY AND TECHNICAL COMPLIANCE
4.7.3 REGULATORY, ENVIRONMENTAL, AND FOOD SAFETY COMPLIANCE
4.7.4 SUPPLY CHAIN RELIABILITY AND AGRICULTURAL RISK MANAGEMENT
4.7.5 FINANCIAL STABILITY AND LONG-TERM VIABILITY
4.7.6 SUSTAINABILITY, INNOVATION, AND RISK MANAGEMENT
4.8 INNOVATION TRACKER AND STRATEGIC ANALYSIS
4.8.1 MAJOR DEALS AND STRATEGIC ALLIANCES ANALYSIS
4.8.1.1 JOINT VENTURES
4.8.1.2 MERGERS AND ACQUISITIONS
4.8.1.3 LICENSING AND PARTNERSHIP
4.8.1.4 TECHNOLOGY COLLABORATIONS
4.8.1.5 STRATEGIC DIVESTMENTS
4.8.2 NUMBER OF PRODUCTS IN DEVELOPMENT
4.8.3 STAGE OF DEVELOPMENT
4.8.4 TIMELINES AND MILESTONES
4.8.5 INNOVATION STRATEGIES AND METHODOLOGIES
4.8.6 RISK ASSESSMENT AND MITIGATION
4.8.7 FUTURE OUTLOOK
4.9 RAW MATERIAL COVERAGE – PLANT-BASED COLORANTS MARKET
4.9.1 PLANT AND BIOLOGICAL PIGMENT SOURCES (CAROTENOIDS, ANTHOCYANINS, CHLOROPHYLLS, BETALAIN S, ALGAE)
4.9.2 EXTRACTION, FERMENTATION, AND PROCESSING INPUTS
4.9.3 PACKAGING-RELATED INPUTS AND SUSTAINABILITY CONSIDERATIONS
4.9.4 REAL-WORLD SUPPLY SHOCKS IMPACTING RAW MATERIALS
4.9.5 REGIONAL RAW MATERIAL SUPPLY DYNAMICS
4.9.6 STRATEGIC DIVERSIFICATION OF RAW MATERIAL SUPPLY
4.9.7 QUALITY, COMPLIANCE, AND TRACEABILITY
4.1 TECHNOLOGICAL ADVANCEMENTS
4.10.1 PRODUCT INNOVATION AND FUNCTIONAL PLANT-BASED COLORANT TECHNOLOGIES
4.10.2 ADVANCEMENTS IN EXTRACTION, STABILIZATION, AND COLOR CHEMISTRY
4.10.3 FERMENTATION-DERIVED AND BIOTECHNOLOGY-ENABLED COLOR PRODUCTION
4.10.4 DIGITALIZATION, AUTOMATION, AND PROCESS OPTIMIZATION
4.10.5 SUSTAINABILITY-DRIVEN TECHNOLOGICAL INTEGRATION
4.10.6 CONSUMER ACCEPTANCE AND MARKET ENABLEMENT
5 TARIFFS & IMPACT ON THE MARKET
5.1 CURRENT TARIFF RATE(S) IN TOP-5 COUNTRY MARKETS
5.2 OUTLOOK: LOCAL PRODUCTION VERSUS IMPORT RELIANCE
5.3 VENDOR SELECTION CRITERIA DYNAMICS
5.4 IMPACT ON SUPPLY CHAIN
5.4.1 RAW MATERIAL PROCUREMENT
5.4.2 MANUFACTURING AND PRODUCTION
5.4.3 LOGISTICS AND DISTRIBUTION
5.4.4 PRICE PITCHING AND MARKET POSITION
5.5 INDUSTRY PARTICIPANTS: PROACTIVE MOVES
5.5.1 SUPPLY CHAIN OPTIMIZATION
5.6 IMPACT ON PRICES
5.7 REGULATORY INCLINATION
5.8 FOOD SAFETY AND ADDITIVE REGULATION FRAMEWORKS
5.9 GEOPOLITICAL SITUATION
5.9.1 FREE TRADE AGREEMENTS
5.9.2 ALLIANCES ESTABLISHMENTS
5.1 STATUS ACCREDITATION (INCLUDING MFN)
5.11 DOMESTIC COURSE OF CORRECTION
5.11.1 INCENTIVE SCHEMES TO BOOST PRODUCTION OUTPUTS
5.11.2 ESTABLISHMENT OF SPECIAL ECONOMIC ZONES / INDUSTRIAL PARKS
6 REGULATION COVERAGE
6.1 PRODUCT CODES
6.2 CERTIFIED STANDARDS
6.3 SAFETY STANDARDS
6.3.1 MATERIAL HANDLING & STORAGE
6.3.2 TRANSPORT & PRECAUTIONS
6.3.3 HAZARD IDENTIFICATION
7 MARKET OVERVIEW
7.1 DRIVERS
7.1.1 RISING CONSUMER DEMAND FOR CLEAN-LABEL AND NATURAL INGREDIENTS
7.1.2 INCREASING REGULATORY SCRUTINY ON SYNTHETIC FOOD COLORANTS
7.1.3 INITIATIVES BY NORTH AMERICA FOOD AND BEVERAGE COMPANIES TO SHIFT PORTFOLIOS TOWARD NATURALLY DERIVED COLOR SOLUTIONS
7.2 RESTRAINTS
7.2.1 HIGHER COST OF PLANT-BASED COLORANTS COMPARED TO SYNTHETIC ALTERNATIVES
7.2.2 SEASONAL VARIABILITY AND SUPPLY INCONSISTENCY OF BOTANICAL RAW MATERIALS
7.3 OPPORTUNITIES
7.3.1 RISING DEMAND FOR PLANT-BASED COLORANTS IN ANIMAL FEED
7.3.2 TECHNOLOGICAL ADVANCEMENTS IMPROVING STABILITY, SHADE INTENSITY, AND APPLICATION VERSATILITY OF NATURAL COLORS
7.4 CHALLENGES
7.4.1 LIMITED CONSUMER AND MANUFACTURER UNDERSTANDING OF APPLICATION-SPECIFIC PERFORMANCE REQUIREMENTS
7.4.2 SUPPLY CHAIN COMPLEXITY DUE TO AGRICULTURAL DEPENDENCE AND CLIMATE SENSITIVITY OF RAW MATERIALS
8 NORTH AMERICA PLANT-BASED COLORANTS MARKET, BY PRODUCT TYPE
8.1 OVERVIEW
8.2 NORTH AMERICA PLANT-BASED COLORANTS MARKET, BY PRODUCT TYPE, 2018-2033 (USD THOUSAND)
8.2.1 CAROTENOIDS
8.2.2 ANTHOCYANINS
8.2.3 CHLOROPHYLLS
8.2.4 BETALAINS
8.2.5 CURCUMIN
8.2.6 PAPRIKA EXTRACT
8.2.7 SPIRULINA EXTRACT
8.2.8 GARDENIA YELLOW
8.2.9 SAFFRON EXTRACT
8.2.10 ANNATTO
8.2.11 OTHERS
8.3 NORTH AMERICA PLANT-BASED COLORANTS MARKET, BY PRODUCT TYPE, 2018-2033 (TONS)
8.3.1 CAROTENOIDS
8.3.2 ANTHOCYANINS
8.3.3 CHLOROPHYLLS
8.3.4 BETALAINS
8.3.5 CURCUMIN
8.3.6 PAPRIKA EXTRACT
8.3.7 SPIRULINA EXTRACT
8.3.8 GARDENIA YELLOW
8.3.9 SAFFRON EXTRACT
8.3.10 ANNATTO
8.3.11 OTHERS
8.4 NORTH AMERICA CAROTENOIDS IN PLANT-BASED COLORANTS MARKET, BY SOURCE, 2018-2033 (USD THOUSAND)
8.4.1 CARROTS
8.4.2 PUMPKIN
8.4.3 TOMATO
8.4.4 PEPPER
8.4.5 OTHERS
8.5 NORTH AMERICA CAROTENOIDS IN PLANT-BASED COLORANTS MARKET, BY EXTRACTION TECHNOLOGY, 2018-2033 (USD THOUSAND)
8.5.1 SOLVENT EXTRACTION
8.5.2 ENZYMATIC EXTRACTION
8.5.3 SUPERCRITICAL FLUID
8.6 NORTH AMERICA CAROTENOIDS IN PLANT-BASED COLORANTS MARKET, BY REGION, 2018-2033 (USD THOUSAND)
8.6.1 NORTH AMERICA
8.6.2 EUROPE
8.6.3 ASIA-PACIFIC
8.6.4 SOUTH AMERICA
8.6.5 MIDDLE EAST AND AFRICA
8.7 NORTH AMERICA ANTHOCYANINS IN PLANT-BASED COLORANTS MARKET, BY SOURCE, 2018-2033 (USD THOUSAND)
8.7.1 GRAPE SKINS
8.7.2 BLUEBERRIES
8.7.3 BLACK CURRANTS
8.7.4 PURPLE SWEET POTATO
8.7.5 ELDERBERRY
8.8 NORTH AMERICA ANTHOCYANINS IN PLANT-BASED COLORANTS MARKET, BY EXTRACTION TECHNOLOGY, 2018-2033 (USD THOUSAND)
8.8.1 SOLVENT EXTRACTION
8.8.2 ENCAPSULATION
8.8.3 ULTRASONIC EXTRACTION
8.9 NORTH AMERICA ANTHOCYANINS IN PLANT-BASED COLORANTS MARKET, BY REGION, 2018-2033 (USD THOUSAND)
8.9.1 NORTH AMERICA
8.9.2 EUROPE
8.9.3 ASIA-PACIFIC
8.9.4 SOUTH AMERICA
8.9.5 MIDDLE EAST AND AFRICA
8.1 NORTH AMERICA CHLOROPHYLLS IN PLANT-BASED COLORANTS MARKET, BY SOURCE, 2018-2033 (USD THOUSAND)
8.10.1 SPINACH
8.10.2 WHEATGRASS
8.10.3 PARSLEY
8.10.4 ALFALFA
8.11 NORTH AMERICA CHLOROPHYLLS IN PLANT-BASED COLORANTS MARKET, BY EXTRACTION TECHNOLOGY, 2018-2033 (USD THOUSAND)
8.11.1 MACERATION
8.11.2 FILTRATION
8.12 NORTH AMERICA CHLOROPHYLLS IN PLANT-BASED COLORANTS MARKET, BY REGION, 2018-2033 (USD THOUSAND)
8.12.1 NORTH AMERICA
8.12.2 EUROPE
8.12.3 ASIA-PACIFIC
8.12.4 SOUTH AMERICA
8.12.5 MIDDLE EAST AND AFRICA
8.13 NORTH AMERICA BETALAINS IN PLANT-BASED COLORANTS MARKET, BY SOURCE, 2018-2033 (USD THOUSAND)
8.13.1 BEETROOT
8.13.2 SWISS CHARD
8.13.3 AMARANTH
8.14 NORTH AMERICA BETALAINS IN PLANT-BASED COLORANTS MARKET, BY EXTRACTION TECHNOLOGY, 2018-2033 (USD THOUSAND)
8.14.1 COLD PRESS
8.14.2 SPRAY DRYING
8.14.3 FILTRATION
8.15 NORTH AMERICA BETALAINS IN PLANT-BASED COLORANTS MARKET, BY REGION, 2018-2033 (USD THOUSAND)
8.15.1 NORTH AMERICA
8.15.2 EUROPE
8.15.3 ASIA-PACIFIC
8.15.4 SOUTH AMERICA
8.15.5 MIDDLE EAST AND AFRICA
8.16 NORTH AMERICA CURCUMIN IN PLANT-BASED COLORANTS MARKET, BY EXTRACTION TECHNOLOGY, 2018-2033 (USD THOUSAND)
8.16.1 SOLVENT EXTRACTION
8.16.2 SUPERCRITICAL CO2
8.17 NORTH AMERICA CURCUMIN IN PLANT-BASED COLORANTS MARKET, BY REGION, 2018-2033 (USD THOUSAND)
8.17.1 NORTH AMERICA
8.17.2 EUROPE
8.17.3 ASIA-PACIFIC
8.17.4 SOUTH AMERICA
8.17.5 MIDDLE EAST AND AFRICA
8.18 NORTH AMERICA PAPRIKA EXTRACT IN PLANT-BASED COLORANTS MARKET, BY REGION, 2018-2033 (USD THOUSAND)
8.18.1 NORTH AMERICA
8.18.2 EUROPE
8.18.3 ASIA-PACIFIC
8.18.4 SOUTH AMERICA
8.18.5 MIDDLE EAST AND AFRICA
8.19 NORTH AMERICA SPIRULINA EXTRACT IN PLANT-BASED COLORANTS MARKET, BY REGION, 2018-2033 (USD THOUSAND)
8.19.1 NORTH AMERICA
8.19.2 EUROPE
8.19.3 ASIA-PACIFIC
8.19.4 SOUTH AMERICA
8.19.5 MIDDLE EAST AND AFRICA
8.2 NORTH AMERICA GARDENIA YELLOW IN PLANT-BASED COLORANTS MARKET, BY REGION, 2018-2033 (USD THOUSAND)
8.20.1 NORTH AMERICA
8.20.2 EUROPE
8.20.3 ASIA-PACIFIC
8.20.4 SOUTH AMERICA
8.20.5 MIDDLE EAST AND AFRICA
8.21 NORTH AMERICA SAFFRON EXTRACT IN PLANT-BASED COLORANTS MARKET, BY REGION, 2018-2033 (USD THOUSAND)
8.21.1 NORTH AMERICA
8.21.2 EUROPE
8.21.3 ASIA-PACIFIC
8.21.4 SOUTH AMERICA
8.21.5 MIDDLE EAST AND AFRICA
8.22 NORTH AMERICA ANNATTO IN PLANT-BASED COLORANTS MARKET, BY REGION, 2018-2033 (USD THOUSAND)
8.22.1 NORTH AMERICA
8.22.2 EUROPE
8.22.3 ASIA-PACIFIC
8.22.4 SOUTH AMERICA
8.22.5 MIDDLE EAST AND AFRICA
8.23 NORTH AMERICA OTHERS IN PLANT-BASED COLORANTS MARKET, BY REGION, 2018-2033 (USD THOUSAND)
8.23.1 NORTH AMERICA
8.23.2 EUROPE
8.23.3 ASIA-PACIFIC
8.23.4 SOUTH AMERICA
8.23.5 MIDDLE EAST AND AFRICA
9 NORTH AMERICA PLANT-BASED COLORANTS MARKET, BY TYPE
9.1 OVERVIEW
9.2 NORTH AMERICA PLANT-BASED COLORANTS MARKET, BY TYPE, 2018-2033 (USD THOUSAND)
9.2.1 PIGMENTS
9.2.2 DYES
9.2.3 MASTERBATCHES
9.2.4 COLOR CONCENTRATES
9.2.5 OTHERS
9.3 NORTH AMERICA PIGMENTS IN PLANT-BASED COLORANTS MARKET, BY REGION, 2018-2033 (USD THOUSAND)
9.3.1 NORTH AMERICA
9.3.2 EUROPE
9.3.3 ASIA-PACIFIC
9.3.4 SOUTH AMERICA
9.3.5 MIDDLE EAST AND AFRICA
9.4 NORTH AMERICA DYES IN PLANT-BASED COLORANTS MARKET, BY REGION, 2018-2033 (USD THOUSAND)
9.4.1 NORTH AMERICA
9.4.2 EUROPE
9.4.3 ASIA-PACIFIC
9.4.4 SOUTH AMERICA
9.4.5 MIDDLE EAST AND AFRICA
9.5 NORTH AMERICA MASTERBATCHES IN PLANT-BASED COLORANTS MARKET, BY REGION, 2018-2033 (USD THOUSAND)
9.5.1 NORTH AMERICA
9.5.2 EUROPE
9.5.3 ASIA-PACIFIC
9.5.4 SOUTH AMERICA
9.5.5 MIDDLE EAST AND AFRICA
9.6 NORTH AMERICA COLOR CONCENTRATES IN PLANT-BASED COLORANTS MARKET, BY REGION, 2018-2033 (USD THOUSAND)
9.6.1 NORTH AMERICA
9.6.2 EUROPE
9.6.3 ASIA-PACIFIC
9.6.4 SOUTH AMERICA
9.6.5 MIDDLE EAST AND AFRICA
9.7 NORTH AMERICA OTHERS IN PLANT-BASED COLORANTS MARKET, BY REGION, 2018-2033 (USD THOUSAND)
9.7.1 NORTH AMERICA
9.7.2 EUROPE
9.7.3 ASIA-PACIFIC
9.7.4 SOUTH AMERICA
9.7.5 MIDDLE EAST AND AFRICA
10 NORTH AMERICA PLANT-BASED COLORANTS MARKET, BY COLOR
10.1 OVERVIEW
10.2 NORTH AMERICA PLANT-BASED COLORANTS MARKET, BY COLOR, 2018-2033 (USD THOUSAND)
10.2.1 RED
10.2.2 YELLOW
10.2.3 ORANGE
10.2.4 GREEN
10.2.5 BLUE
10.2.6 BROWN
10.2.7 BLACK
10.2.8 PURPLE
10.2.9 PINK
10.2.10 WHITE/OFF-WHITE
10.2.11 GRAY/SILVER
10.2.12 GOLD
10.2.13 BEIGE
10.2.14 OTHERS
10.3 NORTH AMERICA RED IN PLANT-BASED COLORANTS MARKET, BY REGION, 2018-2033 (USD THOUSAND)
10.3.1 NORTH AMERICA
10.3.2 EUROPE
10.3.3 ASIA-PACIFIC
10.3.4 SOUTH AMERICA
10.3.5 MIDDLE EAST AND AFRICA
10.4 NORTH AMERICA YELLOW IN PLANT-BASED COLORANTS MARKET, BY REGION, 2018-2033 (USD THOUSAND)
10.4.1 NORTH AMERICA
10.4.2 EUROPE
10.4.3 ASIA-PACIFIC
10.4.4 SOUTH AMERICA
10.4.5 MIDDLE EAST AND AFRICA
10.5 NORTH AMERICA ORANGE IN PLANT-BASED COLORANTS MARKET, BY REGION, 2018-2033 (USD THOUSAND)
10.5.1 NORTH AMERICA
10.5.2 EUROPE
10.5.3 ASIA-PACIFIC
10.5.4 SOUTH AMERICA
10.5.5 MIDDLE EAST AND AFRICA
10.6 NORTH AMERICA GREEN IN PLANT-BASED COLORANTS MARKET, BY REGION, 2018-2033 (USD THOUSAND)
10.6.1 NORTH AMERICA
10.6.2 EUROPE
10.6.3 ASIA-PACIFIC
10.6.4 SOUTH AMERICA
10.6.5 MIDDLE EAST AND AFRICA
10.7 NORTH AMERICA BLUE IN PLANT-BASED COLORANTS MARKET, BY REGION, 2018-2033 (USD THOUSAND)
10.7.1 NORTH AMERICA
10.7.2 EUROPE
10.7.3 ASIA-PACIFIC
10.7.4 SOUTH AMERICA
10.7.5 MIDDLE EAST AND AFRICA
10.8 NORTH AMERICA BROWN IN PLANT-BASED COLORANTS MARKET, BY REGION, 2018-2033 (USD THOUSAND)
10.8.1 NORTH AMERICA
10.8.2 EUROPE
10.8.3 ASIA-PACIFIC
10.8.4 SOUTH AMERICA
10.8.5 MIDDLE EAST AND AFRICA
10.9 NORTH AMERICA BLACK IN PLANT-BASED COLORANTS MARKET, BY REGION, 2018-2033 (USD THOUSAND)
10.9.1 NORTH AMERICA
10.9.2 EUROPE
10.9.3 ASIA-PACIFIC
10.9.4 SOUTH AMERICA
10.9.5 MIDDLE EAST AND AFRICA
10.1 NORTH AMERICA PURPLE IN PLANT-BASED COLORANTS MARKET, BY REGION, 2018-2033 (USD THOUSAND)
10.10.1 NORTH AMERICA
10.10.2 EUROPE
10.10.3 ASIA-PACIFIC
10.10.4 SOUTH AMERICA
10.10.5 MIDDLE EAST AND AFRICA
10.11 NORTH AMERICA PINK IN PLANT-BASED COLORANTS MARKET, BY REGION, 2018-2033 (USD THOUSAND)
10.11.1 NORTH AMERICA
10.11.2 EUROPE
10.11.3 ASIA-PACIFIC
10.11.4 SOUTH AMERICA
10.11.5 MIDDLE EAST AND AFRICA
10.12 NORTH AMERICA WHITE/OFF-WHITE IN PLANT-BASED COLORANTS MARKET, BY REGION, 2018-2033 (USD THOUSAND)
10.12.1 NORTH AMERICA
10.12.2 EUROPE
10.12.3 ASIA-PACIFIC
10.12.4 SOUTH AMERICA
10.12.5 MIDDLE EAST AND AFRICA
10.13 NORTH AMERICA GRAY/SILVER IN PLANT-BASED COLORANTS MARKET, BY REGION, 2018-2033 (USD THOUSAND)
10.13.1 NORTH AMERICA
10.13.2 EUROPE
10.13.3 ASIA-PACIFIC
10.13.4 SOUTH AMERICA
10.13.5 MIDDLE EAST AND AFRICA
10.14 NORTH AMERICA GOLD IN PLANT-BASED COLORANTS MARKET, BY REGION, 2018-2033 (USD THOUSAND)
10.14.1 NORTH AMERICA
10.14.2 EUROPE
10.14.3 ASIA-PACIFIC
10.14.4 SOUTH AMERICA
10.14.5 MIDDLE EAST AND AFRICA
10.15 NORTH AMERICA BEIGE IN PLANT-BASED COLORANTS MARKET, BY REGION, 2018-2033 (USD THOUSAND)
10.15.1 NORTH AMERICA
10.15.2 EUROPE
10.15.3 ASIA-PACIFIC
10.15.4 SOUTH AMERICA
10.15.5 MIDDLE EAST AND AFRICA
10.16 NORTH AMERICA OTHERS IN PLANT-BASED COLORANTS MARKET, BY REGION, 2018-2033 (USD THOUSAND)
10.16.1 NORTH AMERICA
10.16.2 EUROPE
10.16.3 ASIA-PACIFIC
10.16.4 SOUTH AMERICA
10.16.5 MIDDLE EAST AND AFRICA
11 NORTH AMERICA PLANT-BASED COLORANTS MARKET, BY FORM
11.1 OVERVIEW
11.2 NORTH AMERICA PLANT-BASED COLORANTS MARKET, BY FORM, 2018-2033 (USD THOUSAND)
11.2.1 POWDER
11.2.2 LIQUID/PASTE
11.2.3 GRANULES/PELLETS
11.3 NORTH AMERICA POWDER IN PLANT-BASED COLORANTS MARKET, BY REGION, 2018-2033 (USD THOUSAND)
11.3.1 NORTH AMERICA
11.3.2 EUROPE
11.3.3 ASIA-PACIFIC
11.3.4 SOUTH AMERICA
11.3.5 MIDDLE EAST AND AFRICA
11.4 NORTH AMERICA LIQUID/PASTE IN PLANT-BASED COLORANTS MARKET, BY MANUFACTURING PROCESS, 2018-2033 (USD THOUSAND)
11.4.1 WATER-BASED
11.4.2 OIL-BASED
11.5 NORTH AMERICA LIQUID/PASTE IN PLANT-BASED COLORANTS MARKET, BY REGION, 2018-2033 (USD THOUSAND)
11.5.1 NORTH AMERICA
11.5.2 EUROPE
11.5.3 ASIA-PACIFIC
11.5.4 SOUTH AMERICA
11.5.5 MIDDLE EAST AND AFRICA
11.6 NORTH AMERICA GRANULES/PELLETS IN PLANT-BASED COLORANTS MARKET, BY REGION, 2018-2033 (USD THOUSAND)
11.6.1 NORTH AMERICA
11.6.2 EUROPE
11.6.3 ASIA-PACIFIC
11.6.4 SOUTH AMERICA
11.6.5 MIDDLE EAST AND AFRICA
12 NORTH AMERICA PLANT-BASED COLORANTS MARKET, BY SOLUBILITY
12.1 OVERVIEW
12.2 NORTH AMERICA PLANT-BASED COLORANTS MARKET, BY SOLUBILITY, 2018-2033 (USD THOUSAND)
12.2.1 WATER-SOLUBLE
12.2.2 OIL-SOLUBLE
12.2.3 SOLVENT-SOLUBLE
12.3 NORTH AMERICA WATER-SOLUBLE IN PLANT-BASED COLORANTS MARKET, BY REGION, 2018-2033 (USD THOUSAND)
12.3.1 NORTH AMERICA
12.3.2 EUROPE
12.3.3 ASIA-PACIFIC
12.3.4 SOUTH AMERICA
12.3.5 MIDDLE EAST AND AFRICA
12.4 NORTH AMERICA OIL-SOLUBLE IN PLANT-BASED COLORANTS MARKET, BY REGION, 2018-2033 (USD THOUSAND)
12.4.1 NORTH AMERICA
12.4.2 EUROPE
12.4.3 ASIA-PACIFIC
12.4.4 SOUTH AMERICA
12.4.5 MIDDLE EAST AND AFRICA
12.5 NORTH AMERICA SOLVENT-SOLUBLE IN PLANT-BASED COLORANTS MARKET, BY REGION, 2018-2033 (USD THOUSAND)
12.5.1 NORTH AMERICA
12.5.2 EUROPE
12.5.3 ASIA-PACIFIC
12.5.4 SOUTH AMERICA
12.5.5 MIDDLE EAST AND AFRICA
13 NORTH AMERICA PLANT-BASED COLORANTS MARKET, BY END USE
13.1 OVERVIEW
13.2 NORTH AMERICA PLANT-BASED COLORANTS MARKET, BY END USE, 2018-2033 (USD THOUSAND)
13.2.1 FOOD & BEVERAGE
13.2.2 COSMETICS & PERSONAL CARE
13.2.3 TEXTILE INDUSTRY
13.2.4 PAINTS & COATINGS
13.2.5 PACKAGING
13.2.6 PHARMACEUTICAL
13.2.7 PLASTICS & RUBBER
13.2.8 PRINTING
13.2.9 OTHERS
13.3 NORTH AMERICA FOOD & BEVERAGE IN PLANT-BASED COLORANTS MARKET, BY APPLICATION, 2018-2033 (USD THOUSAND)
13.3.1 BEVERAGES
13.3.2 CONFECTIONERY
13.3.3 DAIRY PRODUCTS
13.3.4 BAKERY PRODUCTS
13.3.5 MEAT & POULTRY
13.3.6 SAUCES & CONDIMENTS
13.3.7 OTHERS
13.4 NORTH AMERICA BEVERAGES IN PLANT-BASED COLORANTS MARKET, BY TYPE, 2018-2033 (USD THOUSAND)
13.4.1 JUICES & SMOOTHIES
13.4.2 CARBONATED DRINKS
13.4.3 ENERGY DRINKS
13.4.4 FUNCTIONAL BEVERAGES
13.4.5 ALCOHOLIC BEVERAGES
13.4.6 SPORTS DRINKS
13.4.7 OTHERS
13.5 NORTH AMERICA CONFECTIONERY IN PLANT-BASED COLORANTS MARKET, BY TYPE, 2018-2033 (USD THOUSAND)
13.5.1 CANDIES & GUMMIES
13.5.2 CHOCOLATES
13.5.3 CHEWING GUMS
13.5.4 JELLIES
13.5.5 COATINGS & FILLINGS
13.5.6 OTHERS
13.6 NORTH AMERICA DAIRY PRODUCTS IN PLANT-BASED COLORANTS MARKET, BY TYPE, 2018-2033 (USD THOUSAND)
13.6.1 YOGURTS
13.6.2 ICE CREAMS
13.6.3 CHEESE
13.6.4 FLAVORED MILK
13.6.5 CREAMS & DESSERTS
13.6.6 OTHERS
13.7 NORTH AMERICA BAKERY PRODUCTS IN PLANT-BASED COLORANTS MARKET, BY TYPE, 2018-2033 (USD THOUSAND)
13.7.1 BREADS
13.7.2 CAKES & MUFFINS
13.7.3 BISCUITS & COOKIES
13.7.4 PASTRIES
13.7.5 DOUGHNUTS
13.7.6 OTHERS
13.8 NORTH AMERICA MEAT & POULTRY IN PLANT-BASED COLORANTS MARKET, BY TYPE, 2018-2033 (USD THOUSAND)
13.8.1 PROCESSED MEATS
13.8.2 SAUSAGES
13.8.3 CURED MEATS
13.8.4 POULTRY MARINADES & GLAZES
13.8.5 PLANT-BASED MEAT ALTERNATIVES
13.8.6 OTHERS
13.9 NORTH AMERICA SAUCES & CONDIMENTS IN PLANT-BASED COLORANTS MARKET, BY TYPE, 2018-2033 (USD THOUSAND)
13.9.1 KETCHUP & TOMATO SAUCES
13.9.2 MAYONNAISE & DRESSINGS
13.9.3 SPREADS
13.9.4 SEASONING MIXES
13.9.5 GRAVIES & DIPS
13.9.6 OTHERS
13.1 NORTH AMERICA FOOD & BEVERAGE IN PLANT-BASED COLORANTS MARKET, BY PRODUCT TYPE, 2018-2033 (USD THOUSAND)
13.10.1 CAROTENOIDS
13.10.2 ANTHOCYANINS
13.10.3 CHLOROPHYLLS
13.10.4 BETALAINS
13.10.5 CURCUMIN
13.10.6 PAPRIKA EXTRACT
13.10.7 SPIRULINA EXTRACT
13.10.8 GARDENIA YELLOW
13.10.9 SAFFRON EXTRACT
13.10.10 ANNATTO
13.10.11 OTHERS
13.11 NORTH AMERICA FOOD & BEVERAGE IN PLANT-BASED COLORANTS MARKET, BY REGION, 2018-2033 (USD THOUSAND)
13.11.1 NORTH AMERICA
13.11.2 EUROPE
13.11.3 ASIA-PACIFIC
13.11.4 SOUTH AMERICA
13.11.5 MIDDLE EAST AND AFRICA
13.12 NORTH AMERICA COSMETICS & PERSONAL CARE IN PLANT-BASED COLORANTS MARKET, BY APPLICATION, 2018-2033 (USD THOUSAND)
13.12.1 SKINCARE
13.12.2 HAIRCARE
13.12.3 MAKEUP PRODUCTS
13.12.4 FRAGRANCES
13.12.5 OTHERS
13.13 NORTH AMERICA SKINCARE IN PLANT-BASED COLORANTS MARKET, BY TYPE, 2018-2033 (USD THOUSAND)
13.13.1 FACE CREAMS & MOISTURIZERS
13.13.2 SERUMS
13.13.3 SUNSCREENS
13.13.4 CLEANSERS
13.13.5 MASKS & PEELS
13.13.6 BODY LOTIONS
13.13.7 ANTI-AGING PRODUCTS
13.13.8 OTHERS
13.14 NORTH AMERICA HAIRCARE IN PLANT-BASED COLORANTS MARKET, BY TYPE, 2018-2033 (USD THOUSAND)
13.14.1 HAIR COLORANTS
13.14.2 SHAMPOOS
13.14.3 CONDITIONERS
13.14.4 HAIR OILS & SERUMS
13.14.5 OTHERS
13.15 NORTH AMERICA FRAGRANCES IN PLANT-BASED COLORANTS MARKET, BY TYPE, 2018-2033 (USD THOUSAND)
13.15.1 PERFUMES & EAU DE PARFUM
13.15.2 EAU DE TOILETTE
13.15.3 BODY MISTS & SPRAYS
13.15.4 DEODORANTS
13.15.5 OTHERS
13.16 NORTH AMERICA COSMETICS & PERSONAL CARE IN PLANT-BASED COLORANTS MARKET, BY PRODUCT TYPE, 2018-2033 (USD THOUSAND)
13.16.1 CAROTENOIDS
13.16.2 ANTHOCYANINS
13.16.3 CHLOROPHYLLS
13.16.4 BETALAINS
13.16.5 CURCUMIN
13.16.6 PAPRIKA EXTRACT
13.16.7 SPIRULINA EXTRACT
13.16.8 GARDENIA YELLOW
13.16.9 SAFFRON EXTRACT
13.16.10 ANNATTO
13.16.11 OTHERS
13.17 NORTH AMERICA COSMETICS & PERSONAL CARE IN PLANT-BASED COLORANTS MARKET, BY REGION, 2018-2033 (USD THOUSAND)
13.17.1 NORTH AMERICA
13.17.2 EUROPE
13.17.3 ASIA-PACIFIC
13.17.4 SOUTH AMERICA
13.17.5 MIDDLE EAST AND AFRICA
13.18 NORTH AMERICA TEXTILE INDUSTRY IN PLANT-BASED COLORANTS MARKET, BY APPLICATION, 2018-2033 (USD THOUSAND)
13.18.1 APPAREL
13.18.2 HOME TEXTILES
13.18.3 TECHNICAL TEXTILES
13.18.4 LEATHER & FUR
13.18.5 FIBERS
13.18.6 OTHERS
13.19 NORTH AMERICA HOME TEXTILES IN PLANT-BASED COLORANTS MARKET, BY TYPE, 2018-2033 (USD THOUSAND)
13.19.1 UPHOLSTERY
13.19.2 CURTAINS & DRAPES
13.19.3 CARPETS & RUGS
13.19.4 BED LINEN
13.19.5 OTHERS
13.2 NORTH AMERICA TECHNICAL TEXTILES IN PLANT-BASED COLORANTS MARKET, BY TYPE, 2018-2033 (USD THOUSAND)
13.20.1 AUTOMOTIVE TEXTILES
13.20.2 MEDICAL TEXTILES
13.20.3 GEOTEXTILES
13.20.4 INDUSTRIAL TEXTILES
13.20.5 OTHERS
13.21 NORTH AMERICA LEATHER & FUR IN PLANT-BASED COLORANTS MARKET, BY TYPE, 2018-2033 (USD THOUSAND)
13.21.1 FOOTWEAR
13.21.2 BAGS & ACCESSORIES
13.21.3 UPHOLSTERY LEATHER
13.21.4 OTHERS
13.22 NORTH AMERICA FIBERS IN PLANT-BASED COLORANTS MARKET, BY TYPE, 2018-2033 (USD THOUSAND)
13.22.1 POLYESTER
13.22.2 COTTON
13.22.3 NYLON
13.22.4 ACRYLIC
13.22.5 WOOL
13.22.6 OTHERS
13.23 NORTH AMERICA TEXTILE INDUSTRY IN PLANT-BASED COLORANTS MARKET, BY PRODUCT TYPE, 2018-2033 (USD THOUSAND)
13.23.1 CAROTENOIDS
13.23.2 ANTHOCYANINS
13.23.3 CHLOROPHYLLS
13.23.4 BETALAINS
13.23.5 CURCUMIN
13.23.6 PAPRIKA EXTRACT
13.23.7 SPIRULINA EXTRACT
13.23.8 GARDENIA YELLOW
13.23.9 SAFFRON EXTRACT
13.23.10 ANNATTO
13.23.11 OTHERS
13.24 NORTH AMERICA TEXTILE INDUSTRY IN PLANT-BASED COLORANTS MARKET, BY REGION, 2018-2033 (USD THOUSAND)
13.24.1 NORTH AMERICA
13.24.2 EUROPE
13.24.3 ASIA-PACIFIC
13.24.4 SOUTH AMERICA
13.24.5 MIDDLE EAST AND AFRICA
13.25 NORTH AMERICA PAINTS & COATINGS IN PLANT-BASED COLORANTS MARKET, BY TYPE, 2018-2033 (USD THOUSAND)
13.25.1 ARCHITECTURAL COATINGS
13.25.2 INDUSTRIAL COATINGS
13.25.3 AUTOMOTIVE COATINGS
13.25.4 OTHERS
13.26 NORTH AMERICA ARCHITECTURAL COATINGS IN PLANT-BASED COLORANTS MARKET, BY TYPE, 2018-2033 (USD THOUSAND)
13.26.1 INTERIOR WALL PAINTS
13.26.2 EXTERIOR WALL PAINTS
13.26.3 DECORATIVE PAINTS
13.26.4 PRIMERS & SEALERS
13.26.5 WOOD COATINGS
13.26.6 ROOF COATINGS
13.26.7 OTHERS
13.27 NORTH AMERICA INDUSTRIAL COATINGS IN PLANT-BASED COLORANTS MARKET, BY TYPE, 2018-2033 (USD THOUSAND)
13.27.1 PROTECTIVE COATINGS
13.27.2 POWDER COATINGS
13.27.3 COIL COATINGS
13.27.4 CAN COATINGS
13.27.5 MARINE COATINGS
13.27.6 PIPELINE COATINGS
13.27.7 OTHERS
13.28 NORTH AMERICA AUTOMOTIVE COATINGS IN PLANT-BASED COLORANTS MARKET, BY TYPE, 2018-2033 (USD THOUSAND)
13.28.1 OEM COATINGS
13.28.2 REFINISH COATINGS
13.28.3 PLASTIC COMPONENT COATINGS
13.28.4 UNDERBODY COATINGS
13.28.5 CLEARCOATS
13.28.6 OTHERS
13.29 NORTH AMERICA PAINTS & COATINGS IN PLANT-BASED COLORANTS MARKET, BY PRODUCT TYPE, 2018-2033 (USD THOUSAND)
13.29.1 CAROTENOIDS
13.29.2 ANTHOCYANINS
13.29.3 CHLOROPHYLLS
13.29.4 BETALAINS
13.29.5 CURCUMIN
13.29.6 PAPRIKA EXTRACT
13.29.7 SPIRULINA EXTRACT
13.29.8 GARDENIA YELLOW
13.29.9 SAFFRON EXTRACT
13.29.10 ANNATTO
13.29.11 OTHERS
13.3 NORTH AMERICA PAINTS & COATINGS IN PLANT-BASED COLORANTS MARKET, BY REGION, 2018-2033 (USD THOUSAND)
13.30.1 NORTH AMERICA
13.30.2 EUROPE
13.30.3 ASIA-PACIFIC
13.30.4 SOUTH AMERICA
13.30.5 MIDDLE EAST AND AFRICA
13.31 NORTH AMERICA PACKAGING IN PLANT-BASED COLORANTS MARKET, BY APPLICATION, 2018-2033 (USD THOUSAND)
13.31.1 FLEXIBLE PACKAGING
13.31.2 RIGID PACKAGING
13.31.3 LABELS & TAGS
13.31.4 OTHERS
13.32 NORTH AMERICA PACKAGING IN PLANT-BASED COLORANTS MARKET, BY PRODUCT TYPE, 2018-2033 (USD THOUSAND)
13.32.1 CAROTENOIDS
13.32.2 ANTHOCYANINS
13.32.3 CHLOROPHYLLS
13.32.4 BETALAINS
13.32.5 CURCUMIN
13.32.6 PAPRIKA EXTRACT
13.32.7 SPIRULINA EXTRACT
13.32.8 GARDENIA YELLOW
13.32.9 SAFFRON EXTRACT
13.32.10 ANNATTO
13.32.11 OTHERS
13.33 NORTH AMERICA PACKAGING IN PLANT-BASED COLORANTS MARKET, BY REGION, 2018-2033 (USD THOUSAND)
13.33.1 NORTH AMERICA
13.33.2 EUROPE
13.33.3 ASIA-PACIFIC
13.33.4 SOUTH AMERICA
13.33.5 MIDDLE EAST AND AFRICA
13.34 NORTH AMERICA PHARMCEUTICAL IN PLANT-BASED COLORANTS MARKET, BY APPLICATION, 2018-2033 (USD THOUSAND)
13.34.1 TABLETS & CAPSULES
13.34.2 TOPICAL PREPARATIONS
13.34.3 INJECTABLES
13.34.4 OTHERS
13.35 NORTH AMERICA PHARMACEUTICAL IN PLANT-BASED COLORANTS MARKET, BY PRODUCT TYPE, 2018-2033 (USD THOUSAND)
13.35.1 CAROTENOIDS
13.35.2 ANTHOCYANINS
13.35.3 CHLOROPHYLLS
13.35.4 BETALAINS
13.35.5 CURCUMIN
13.35.6 PAPRIKA EXTRACT
13.35.7 SPIRULINA EXTRACT
13.35.8 GARDENIA YELLOW
13.35.9 SAFFRON EXTRACT
13.35.10 ANNATTO
13.35.11 OTHERS
13.36 NORTH AMERICA PHARMCEUTICAL IN PLANT-BASED COLORANTS MARKET, BY REGION, 2018-2033 (USD THOUSAND)
13.36.1 NORTH AMERICA
13.36.2 EUROPE
13.36.3 ASIA-PACIFIC
13.36.4 SOUTH AMERICA
13.36.5 MIDDLE EAST AND AFRICA
13.37 NORTH AMERICA PLASTICS & RUBBER IN PLANT-BASED COLORANTS MARKET, BY APPLICATION, 2018-2033 (USD THOUSAND)
13.37.1 POLYMER COLORING
13.37.2 RUBBER COLORING
13.37.3 ADHESIVES
13.37.4 GREASES & LUBRICANTS
13.37.5 OTHERS
13.38 NORTH AMERICA POLYMER COLORING IN PLANT-BASED COLORANTS MARKET, BY TYPE, 2018-2033 (USD THOUSAND)
13.38.1 POLYETHYLENE (PE)
13.38.2 POLYPROPYLENE (PP)
13.38.3 POLYVINYL CHLORIDE (PVC)
13.38.4 POLYSTYRENE (PS)
13.38.5 ABS
13.38.6 POLYCARBONATE (PC)
13.38.7 OTHERS
13.39 NORTH AMERICA RUBBER COLORING IN PLANT-BASED COLORANTS MARKET, BY TYPE, 2018-2033 (USD THOUSAND)
13.39.1 TIRE MANUFACTURING
13.39.2 NATURAL RUBBER
13.39.3 SYNTHETIC RUBBER
13.39.4 FOOTWEAR RUBBER
13.39.5 INDUSTRIAL GOODS
13.4 NORTH AMERICA ADHESIVES IN PLANT-BASED COLORANTS MARKET, BY TYPE, 2018-2033 (USD THOUSAND)
13.40.1 INDUSTRIAL ADHESIVES
13.40.2 CONSTRUCTION ADHESIVES
13.40.3 PACKAGING ADHESIVES
13.40.4 AUTOMOTIVE ADHESIVES
13.40.5 OTHERS
13.41 NORTH AMERICA GREASES & LUBRICANTS IN PLANT-BASED COLORANTS MARKET, BY TYPE, 2018-2033 (USD THOUSAND)
13.41.1 AUTOMOTIVE LUBRICANTS
13.41.2 INDUSTRIAL LUBRICANTS
13.41.3 METALWORKING FLUIDS
13.41.4 HYDRAULIC OILS
13.42 NORTH AMERICA PLASTICS & RUBBER IN PLANT-BASED COLORANTS MARKET, BY PRODUCT TYPE, 2018-2033 (USD THOUSAND)
13.42.1 CAROTENOIDS
13.42.2 ANTHOCYANINS
13.42.3 CHLOROPHYLLS
13.42.4 BETALAINS
13.42.5 CURCUMIN
13.42.6 PAPRIKA EXTRACT
13.42.7 SPIRULINA EXTRACT
13.42.8 GARDENIA YELLOW
13.42.9 SAFFRON EXTRACT
13.42.10 ANNATTO
13.42.11 OTHERS
13.43 NORTH AMERICA PLASTICS & RUBBER IN PLANT-BASED COLORANTS MARKET, BY REGION, 2018-2033 (USD THOUSAND)
13.43.1 NORTH AMERICA
13.43.2 EUROPE
13.43.3 ASIA-PACIFIC
13.43.4 SOUTH AMERICA
13.43.5 MIDDLE EAST AND AFRICA
13.44 NORTH AMERICA PRINTING IN PLANT-BASED COLORANTS MARKET, BY APPLICATION, 2018-2033 (USD THOUSAND)
13.44.1 OFFSET INKS
13.44.2 FLEXOGRAPHIC INKS
13.44.3 GRAVURE INKS
13.44.4 DIGITAL INKS
13.44.5 OTHERS
13.45 NORTH AMERICA PRINTING IN PLANT-BASED COLORANTS MARKET, BY PRODUCT TYPE, 2018-2033 (USD THOUSAND)
13.45.1 CAROTENOIDS
13.45.2 ANTHOCYANINS
13.45.3 CHLOROPHYLLS
13.45.4 BETALAINS
13.45.5 CURCUMIN
13.45.6 PAPRIKA EXTRACT
13.45.7 SPIRULINA EXTRACT
13.45.8 GARDENIA YELLOW
13.45.9 SAFFRON EXTRACT
13.45.10 ANNATTO
13.45.11 OTHERS
13.46 NORTH AMERICA PRINTING IN PLANT-BASED COLORANTS MARKET, BY REGION, 2018-2033 (USD THOUSAND)
13.46.1 NORTH AMERICA
13.46.2 EUROPE
13.46.3 ASIA-PACIFIC
13.46.4 SOUTH AMERICA
13.46.5 MIDDLE EAST AND AFRICA
13.47 NORTH AMERICA OTHERS IN PLANT-BASED COLORANTS MARKET, BY REGION, 2018-2033 (USD THOUSAND)
13.47.1 NORTH AMERICA
13.47.2 EUROPE
13.47.3 ASIA-PACIFIC
13.47.4 SOUTH AMERICA
13.47.5 MIDDLE EAST AND AFRICA
14 NORTH AMERICA PLANT-BASED COLORANTS MARKET, BY DISTRIBUTION CHANNEL
14.1 OVERVIEW
14.2 NORTH AMERICA PLANT-BASED COLORANTS MARKET, BY DISTRIBUTION CHANNEL, 2018-2033 (USD THOUSAND)
14.2.1 DIRECT
14.2.2 INDIRECT
14.3 NORTH AMERICA DIRECT IN PLANT-BASED COLORANTS MARKET, BY REGION, 2018-2033 (USD THOUSAND)
14.3.1 NORTH AMERICA
14.3.2 EUROPE
14.3.3 ASIA-PACIFIC
14.3.4 SOUTH AMERICA
14.3.5 MIDDLE EAST AND AFRICA
14.4 NORTH AMERICA INDIRECT IN PLANT-BASED COLORANTS MARKET, BY TYPE, 2018-2033 (USD THOUSAND)
14.4.1 RETAIL STORES
14.4.2 WHOLESALERS
14.4.3 DISTRIBUTORS
14.4.4 DEALERS
14.4.5 E-COMMERCE PLATFORMS
14.4.6 THIRD-PARTY MARKETPLACES
14.4.7 OTHERS
14.5 NORTH AMERICA INDIRECT IN PLANT-BASED COLORANTS MARKET, BY REGION, 2018-2033 (USD THOUSAND)
14.5.1 NORTH AMERICA
14.5.2 EUROPE
14.5.3 ASIA-PACIFIC
14.5.4 SOUTH AMERICA
14.5.5 MIDDLE EAST AND AFRICA
15 NORTH AMERICA PLANT-BASED COLORANTS MARKET, BY REGION
15.1 NORTH AMERICA
15.1.1 U.S.
15.1.2 CANADA
15.1.3 MEXICO
16 NORTH AMERICA PLANT-BASED COLORANTS MARKET: COMPANY LANDSCAPE
16.1 MANUFACTURER COMPANY SHARE ANALYSIS: GLOBAL
17 SWOT ANALYSIS
18 COMPANY PROFILE MANUFACTURER
18.1 OTERRA A/S
18.1.1 COMPANY SNAPSHOT
18.1.2 COMPANY SHARE ANALYSIS
18.1.3 PRODUCT PORTFOLIO
18.1.4 RECENT DEVEOPMENT
18.2 GIVAUDAN
18.2.1 COMPANY SNAPSHOT
18.2.2 REVENUE ANALYSIS
18.2.3 COMPANY SHARE ANALYSIS
18.2.4 PRODUCT PORTFOLIO
18.2.5 RECENT DEVEOPMENT
18.3 SENSIENT TECHNOLOGIES CORPORATION
18.3.1 COMPANY SNAPSHOT
18.3.2 REVENUE ANALYSIS
18.3.3 COMPANY SHARE ANALYSIS
18.3.4 PRODUCT PORTFOLIO
18.3.5 RECENT DEVEOPMENT
18.4 ARCHER DANIELS MIDLAND COMPANY
18.4.1 COMPANY SNAPSHOT
18.4.2 REVENUE ANALYSIS
18.4.3 COMPANY SHARE ANALYSIS
18.4.4 PRODUCT PORTFOLIO
18.4.5 RECENT DEVEOPMENT
18.5 EXBERRY (GNT GROUP)
18.5.1 COMPANY SNAPSHOT
18.5.2 COMPANY SHARE ANALYSIS
18.5.3 PRODUCT/SERVICE PORTFOLIO
18.5.4 RECENT DEVELOPMENT
18.6 ALLIED BIOTECH CORPORATION
18.6.1 COMPANY SNAPSHOT
18.6.2 REVENUE ANALYSIS
18.6.3 PRODUCT PORTFOLIO
18.6.4 RECENT DEVELOPMENT
18.7 BASF SE
18.7.1 COMPANY SNAPSHOT
18.7.2 REVENUE ANALYSIS
18.7.3 PRODUCT PORTFOLIO
18.7.4 RECENT DEVELOPMENT
18.8 BIOCON COLORS
18.8.1 COMPANY SNAPSHOT
18.8.2 PRODUCT/SERVICE PORTFOLIO
18.8.3 RECENT DEVELOPMENT
18.9 CHENGUANG BIOTECH GROUP CO., LTD
18.9.1 COMPANY SNAPSHOT
18.9.2 PRODUCT/SERVICE PORTFOLIO
18.9.3 RECENT DEVELOPMENT
18.1 DIC CORPORATION
18.10.1 COMPANY SNAPSHOT
18.10.2 REVENUE ANALYSIS
18.10.3 PRODUCT PORTFOLIO
18.10.4 RECENT DEVELOPMENT
18.11 DOHLER GMBH
18.11.1 COMPANY SNAPSHOT
18.11.2 PRODUCT PORTFOLIO
18.11.3 RECENT DEVEOPMENT
18.12 DSM-FIRMENICH AG
18.12.1 COMPANY SNAPSHOT
18.12.2 REVENUE ANALYSIS
18.12.3 PRODUCT/SERVICE PORTFOLIO
18.12.4 RECENT DEVELOPMENT
18.13 IMBAREX
18.13.1 COMPANY SNAPSHOT
18.13.2 PRODUCT PORTFOLIO
18.13.3 RECENT DEVEOPMENT
18.14 KALSEC INC
18.14.1 COMPANY SNAPSHOT
18.14.2 PRODUCT PORTFOLIO
18.14.3 RECENT DEVEOPMENT
18.15 LYCORED LTD
18.15.1 COMPANY SNAPSHOT
18.15.2 PRODUCT PORTFOLIO
18.15.3 RECENT DEVELOPMENT
18.16 PLANT LIPIDS
18.16.1 COMPANY SNAPSHOT
18.16.2 PRODUCT/SERVICE PORTFOLIO
18.16.3 RECENT DEVELOPMENT
18.17 ROHA DYECHEM PVT LTD.
18.17.1 COMPANY SNAPSHOT
18.17.2 PRODUCT/SERVICE PORTFOLIO
18.17.3 RECENT DEVELOPMENT
18.18 SAN-EI GEN F.F.I., INC.
18.18.1 COMPANY SNAPSHOT
18.18.2 PRODUCT PORTFOLIO
18.18.3 RECENT DEVELOPMENT
18.19 SECNA NATURAL INGREDIENTS GROUP
18.19.1 COMPANY SNAPSHOT
18.19.2 PRODUCT/SERVICE PORTFOLIO
18.19.3 RECENT DEVELOPMENT
18.2 SYMRISE AG
18.20.1 COMPANY SNAPSHOT
18.20.2 REVENUE ANALYSIS
18.20.3 PRODUCT PORTFOLIO
18.20.4 RECENT DEVELOPMENT
18.21 SYNTHITE INDUSTRIES PVT LTD.
18.21.1 COMPANY SNAPSHOT
18.21.2 PRODUCT/SERVICE PORTFOLIO
18.21.3 RECENT DEVELOPMENT
18.22 VINAYAK INGREDIENTS (INDIA) PVT. LTD
18.22.1 COMPANY SNAPSHOT
18.22.2 PRODUCT PORTFOLIO
18.22.3 RECENT DEVELOPMENT
19 COMPANY PROFILE DISTRIBUTOR
19.1 AZELIS S.A.
19.1.1 COMPANY SNAPSHOT
19.1.2 REVENUE ANALYSIS
19.1.3 PRODUCT PORTFOLIO
19.1.4 RECENT DEVELOPMENT
19.2 PLANT-EX INGREDIENTS LTD
19.2.1 COMPANY SNAPSHOT
19.2.2 PRODUCT PORTFOLIO
19.2.3 RECENT DEVELOPMENT
19.3 IMCD N.V.
19.3.1 COMPANY SNAPSHOT
19.3.2 REVENUE ANALYSIS
19.3.3 PRODUCT PORTFOLIO
19.3.4 RECENT DEVELOPMENT
19.4 NEXIRA
19.4.1 COMPANY SNAPSHOT
19.4.2 PRODUCT PORTFOLIO
19.4.3 RECENT DEVELOPMENT
19.5 BRENNTAG AG
19.5.1 COMPANY SNAPSHOT
19.5.2 REVENUE ANALYSIS
19.5.3 PRODUCT PORTFOLIO
19.5.4 RECENT DEVELOPMENT
20 QUESTIONNAIRE
21 RELATED REPORTS
List of Table
TABLE 1 BRAND COMPARATIVE ANALYSIS
TABLE 2 COMPANY VS BRAND OVERVIEW
TABLE 3 CONSUMER BUYING BEHAVIOUR
TABLE 4 NORTH AMERICA PLANT-BASED COLORANTS MARKET, BY PRODUCT TYPE, 2018-2033 (USD THOUSAND)
TABLE 5 NORTH AMERICA PLANT-BASED COLORANTS MARKET, BY PRODUCT TYPE, 2018-2033 (TONS)
TABLE 6 NORTH AMERICA CAROTENOIDS IN PLANT-BASED COLORANTS MARKET, BY SOURCE, 2018-2033 (USD THOUSAND)
TABLE 7 NORTH AMERICA CAROTENOIDS IN PLANT-BASED COLORANTS MARKET, BY EXTRACTION TECHNOLOGY, 2018-2033 (USD THOUSAND)
TABLE 8 NORTH AMERICA CAROTENOIDS IN PLANT-BASED COLORANTS MARKET, BY REGION, 2018-2033 (USD THOUSAND)
TABLE 9 NORTH AMERICA ANTHOCYANINS IN PLANT-BASED COLORANTS MARKET, BY SOURCE, 2018-2033 (USD THOUSAND)
TABLE 10 NORTH AMERICA ANTHOCYANINS IN PLANT-BASED COLORANTS MARKET, BY EXTRACTION TECHNOLOGY, 2018-2033 (USD THOUSAND)
TABLE 11 NORTH AMERICA ANTHOCYANINS IN PLANT-BASED COLORANTS MARKET, BY REGION, 2018-2033 (USD THOUSAND)
TABLE 12 NORTH AMERICA CHLOROPHYLLS IN PLANT-BASED COLORANTS MARKET, BY SOURCE, 2018-2033 (USD THOUSAND)
TABLE 13 NORTH AMERICA CHLOROPHYLLS IN PLANT-BASED COLORANTS MARKET, BY EXTRACTION TECHNOLOGY, 2018-2033 (USD THOUSAND)
TABLE 14 NORTH AMERICA CHLOROPHYLLS IN PLANT-BASED COLORANTS MARKET, BY REGION, 2018-2033 (USD THOUSAND)
TABLE 15 NORTH AMERICA BETALAINS IN PLANT-BASED COLORANTS MARKET, BY SOURCE, 2018-2033 (USD THOUSAND)
TABLE 16 NORTH AMERICA BETALAINS IN PLANT-BASED COLORANTS MARKET, BY EXTRACTION TECHNOLOGY, 2018-2033 (USD THOUSAND)
TABLE 17 NORTH AMERICA BETALAINS IN PLANT-BASED COLORANTS MARKET, BY REGION, 2018-2033 (USD THOUSAND)
TABLE 18 NORTH AMERICA CURCUMIN IN PLANT-BASED COLORANTS MARKET, BY EXTRACTION TECHNOLOGY, 2018-2033 (USD THOUSAND)
TABLE 19 NORTH AMERICA CURCUMIN IN PLANT-BASED COLORANTS MARKET, BY REGION, 2018-2033 (USD THOUSAND)
TABLE 20 NORTH AMERICA PAPRIKA EXTRACT IN PLANT-BASED COLORANTS MARKET, BY REGION, 2018-2033 (USD THOUSAND)
TABLE 21 NORTH AMERICA SPIRULINA EXTRACT IN PLANT-BASED COLORANTS MARKET, BY REGION, 2018-2033 (USD THOUSAND)
TABLE 22 NORTH AMERICA GARDENIA YELLOW IN PLANT-BASED COLORANTS MARKET, BY REGION, 2018-2033 (USD THOUSAND)
TABLE 23 NORTH AMERICA SAFFRON EXTRACT IN PLANT-BASED COLORANTS MARKET, BY REGION, 2018-2033 (USD THOUSAND)
TABLE 24 NORTH AMERICA ANNATTO IN PLANT-BASED COLORANTS MARKET, BY REGION, 2018-2033 (USD THOUSAND)
TABLE 25 NORTH AMERICA OTHERS IN PLANT-BASED COLORANTS MARKET, BY REGION, 2018-2033 (USD THOUSAND)
TABLE 26 NORTH AMERICA PLANT-BASED COLORANTS MARKET, BY TYPE, 2018-2033 (USD THOUSAND)
TABLE 27 NORTH AMERICA PIGMENTS IN PLANT-BASED COLORANTS MARKET, BY REGION, 2018-2033 (USD THOUSAND)
TABLE 28 NORTH AMERICA DYES IN PLANT-BASED COLORANTS MARKET, BY REGION, 2018-2033 (USD THOUSAND)
TABLE 29 NORTH AMERICA MASTERBATCHES IN PLANT-BASED COLORANTS MARKET, BY REGION, 2018-2033 (USD THOUSAND)
TABLE 30 NORTH AMERICA COLOR CONCENTRATES IN PLANT-BASED COLORANTS MARKET, BY REGION, 2018-2033 (USD THOUSAND)
TABLE 31 NORTH AMERICA OTHERS IN PLANT-BASED COLORANTS MARKET, BY REGION, 2018-2033 (USD THOUSAND)
TABLE 32 NORTH AMERICA PLANT-BASED COLORANTS MARKET, BY COLOR, 2018-2033 (USD THOUSAND)
TABLE 33 NORTH AMERICA RED IN PLANT-BASED COLORANTS MARKET, BY REGION, 2018-2033 (USD THOUSAND)
TABLE 34 NORTH AMERICA YELLOW IN PLANT-BASED COLORANTS MARKET, BY REGION, 2018-2033 (USD THOUSAND)
TABLE 35 NORTH AMERICA ORANGE IN PLANT-BASED COLORANTS MARKET, BY REGION, 2018-2033 (USD THOUSAND)
TABLE 36 NORTH AMERICA GREEN IN PLANT-BASED COLORANTS MARKET, BY REGION, 2018-2033 (USD THOUSAND)
TABLE 37 NORTH AMERICA BLUE IN PLANT-BASED COLORANTS MARKET, BY REGION, 2018-2033 (USD THOUSAND)
TABLE 38 NORTH AMERICA BROWN IN PLANT-BASED COLORANTS MARKET, BY REGION, 2018-2033 (USD THOUSAND)
TABLE 39 NORTH AMERICA BLACK IN PLANT-BASED COLORANTS MARKET, BY REGION, 2018-2033 (USD THOUSAND)
TABLE 40 NORTH AMERICA PURPLE IN PLANT-BASED COLORANTS MARKET, BY REGION, 2018-2033 (USD THOUSAND)
TABLE 41 NORTH AMERICA PINK IN PLANT-BASED COLORANTS MARKET, BY REGION, 2018-2033 (USD THOUSAND)
TABLE 42 NORTH AMERICA WHITE/OFF-WHITE IN PLANT-BASED COLORANTS MARKET, BY REGION, 2018-2033 (USD THOUSAND)
TABLE 43 NORTH AMERICA GRAY/SILVER IN PLANT-BASED COLORANTS MARKET, BY REGION, 2018-2033 (USD THOUSAND)
TABLE 44 NORTH AMERICA GOLD IN PLANT-BASED COLORANTS MARKET, BY REGION, 2018-2033 (USD THOUSAND)
TABLE 45 NORTH AMERICA BEIGE IN PLANT-BASED COLORANTS MARKET, BY REGION, 2018-2033 (USD THOUSAND)
TABLE 46 NORTH AMERICA OTHERS IN PLANT-BASED COLORANTS MARKET, BY REGION, 2018-2033 (USD THOUSAND)
TABLE 47 NORTH AMERICA PLANT-BASED COLORANTS MARKET, BY FORM, 2018-2033 (USD THOUSAND)
TABLE 48 NORTH AMERICA POWDER IN PLANT-BASED COLORANTS MARKET, BY REGION, 2018-2033 (USD THOUSAND)
TABLE 49 NORTH AMERICA LIQUID/PASTE IN PLANT-BASED COLORANTS MARKET, BY MANUFACTURING PROCESS, 2018-2033 (USD THOUSAND)
TABLE 50 NORTH AMERICA LIQUID/PASTE IN PLANT-BASED COLORANTS MARKET, BY REGION, 2018-2033 (USD THOUSAND)
TABLE 51 NORTH AMERICA GRANULES/PELLETS IN PLANT-BASED COLORANTS MARKET, BY REGION, 2018-2033 (USD THOUSAND)
TABLE 52 NORTH AMERICA PLANT-BASED COLORANTS MARKET, BY SOLUBILITY, 2018-2033 (USD THOUSAND)
TABLE 53 NORTH AMERICA WATER-SOLUBLE IN PLANT-BASED COLORANTS MARKET, BY REGION, 2018-2033 (USD THOUSAND)
TABLE 54 NORTH AMERICA OIL-SOLUBLE IN PLANT-BASED COLORANTS MARKET, BY REGION, 2018-2033 (USD THOUSAND)
TABLE 55 NORTH AMERICA SOLVENT-SOLUBLE IN PLANT-BASED COLORANTS MARKET, BY REGION, 2018-2033 (USD THOUSAND)
TABLE 56 NORTH AMERICA PLANT-BASED COLORANTS MARKET, BY END USE, 2018-2033 (USD THOUSAND)
TABLE 57 NORTH AMERICA FOOD & BEVERAGE IN PLANT-BASED COLORANTS MARKET, BY APPLICATION, 2018-2033 (USD THOUSAND)
TABLE 58 NORTH AMERICA BEVERAGES IN PLANT-BASED COLORANTS MARKET, BY TYPE, 2018-2033 (USD THOUSAND)
TABLE 59 NORTH AMERICA CONFECTIONERY IN PLANT-BASED COLORANTS MARKET, BY TYPE, 2018-2033 (USD THOUSAND)
TABLE 60 NORTH AMERICA DAIRY PRODUCTS IN PLANT-BASED COLORANTS MARKET, BY TYPE, 2018-2033 (USD THOUSAND)
TABLE 61 NORTH AMERICA BAKERY PRODUCTS IN PLANT-BASED COLORANTS MARKET, BY TYPE, 2018-2033 (USD THOUSAND)
TABLE 62 NORTH AMERICA MEAT & POULTRY IN PLANT-BASED COLORANTS MARKET, BY TYPE, 2018-2033 (USD THOUSAND)
TABLE 63 NORTH AMERICA SAUCES & CONDIMENTS IN PLANT-BASED COLORANTS MARKET, BY TYPE, 2018-2033 (USD THOUSAND)
TABLE 64 NORTH AMERICA FOOD & BEVERAGE IN PLANT-BASED COLORANTS MARKET, BY PRODUCT TYPE, 2018-2033 (USD THOUSAND)
TABLE 65 NORTH AMERICA FOOD & BEVERAGE IN PLANT-BASED COLORANTS MARKET, BY REGION, 2018-2033 (USD THOUSAND)
TABLE 66 NORTH AMERICA COSMETICS & PERSONAL CARE IN PLANT-BASED COLORANTS MARKET, BY APPLICATION, 2018-2033 (USD THOUSAND)
TABLE 67 NORTH AMERICA SKINCARE IN PLANT-BASED COLORANTS MARKET, BY TYPE, 2018-2033 (USD THOUSAND)
TABLE 68 NORTH AMERICA HAIRCARE IN PLANT-BASED COLORANTS MARKET, BY TYPE, 2018-2033 (USD THOUSAND)
TABLE 69 NORTH AMERICA FRAGRANCES IN PLANT-BASED COLORANTS MARKET, BY TYPE, 2018-2033 (USD THOUSAND)
TABLE 70 NORTH AMERICA COSMETICS & PERSONAL CARE IN PLANT-BASED COLORANTS MARKET, BY PRODUCT TYPE, 2018-2033 (USD THOUSAND)
TABLE 71 NORTH AMERICA COSMETICS & PERSONAL CARE IN PLANT-BASED COLORANTS MARKET, BY REGION, 2018-2033 (USD THOUSAND)
TABLE 72 NORTH AMERICA TEXTILE INDUSTRY IN PLANT-BASED COLORANTS MARKET, BY APPLICATION, 2018-2033 (USD THOUSAND)
TABLE 73 NORTH AMERICA HOME TEXTILES IN PLANT-BASED COLORANTS MARKET, BY TYPE, 2018-2033 (USD THOUSAND)
TABLE 74 NORTH AMERICA TECHNICAL TEXTILES IN PLANT-BASED COLORANTS MARKET, BY TYPE, 2018-2033 (USD THOUSAND)
TABLE 75 NORTH AMERICA LEATHER & FUR IN PLANT-BASED COLORANTS MARKET, BY TYPE, 2018-2033 (USD THOUSAND)
TABLE 76 NORTH AMERICA FIBERS IN PLANT-BASED COLORANTS MARKET, BY TYPE, 2018-2033 (USD THOUSAND)
TABLE 77 NORTH AMERICA TEXTILE INDUSTRY IN PLANT-BASED COLORANTS MARKET, BY PRODUCT TYPE, 2018-2033 (USD THOUSAND)
TABLE 78 NORTH AMERICA TEXTILE INDUSTRY IN PLANT-BASED COLORANTS MARKET, BY REGION, 2018-2033 (USD THOUSAND)
TABLE 79 NORTH AMERICA PAINTS & COATINGS IN PLANT-BASED COLORANTS MARKET, BY TYPE, 2018-2033 (USD THOUSAND)
TABLE 80 NORTH AMERICA ARCHITECTURAL COATINGS IN PLANT-BASED COLORANTS MARKET, BY TYPE, 2018-2033 (USD THOUSAND)
TABLE 81 NORTH AMERICA INDUSTRIAL COATINGS IN PLANT-BASED COLORANTS MARKET, BY TYPE, 2018-2033 (USD THOUSAND)
TABLE 82 NORTH AMERICA AUTOMOTIVE COATINGS IN PLANT-BASED COLORANTS MARKET, BY TYPE, 2018-2033 (USD THOUSAND)
TABLE 83 NORTH AMERICA PAINTS & COATINGS IN PLANT-BASED COLORANTS MARKET, BY PRODUCT TYPE, 2018-2033 (USD THOUSAND)
TABLE 84 NORTH AMERICA PAINTS & COATINGS IN PLANT-BASED COLORANTS MARKET, BY REGION, 2018-2033 (USD THOUSAND)
TABLE 85 NORTH AMERICA PACKAGING IN PLANT-BASED COLORANTS MARKET, BY APPLICATION, 2018-2033 (USD THOUSAND)
TABLE 86 NORTH AMERICA PACKAGING IN PLANT-BASED COLORANTS MARKET, BY PRODUCT TYPE, 2018-2033 (USD THOUSAND)
TABLE 87 NORTH AMERICA PACKAGING IN PLANT-BASED COLORANTS MARKET, BY REGION, 2018-2033 (USD THOUSAND)
TABLE 88 NORTH AMERICA PHARMCEUTICAL IN PLANT-BASED COLORANTS MARKET, BY APPLICATION, 2018-2033 (USD THOUSAND)
TABLE 89 NORTH AMERICA PHARMACEUTICAL IN PLANT-BASED COLORANTS MARKET, BY PRODUCT TYPE, 2018-2033 (USD THOUSAND)
TABLE 90 NORTH AMERICA PHARMCEUTICAL IN PLANT-BASED COLORANTS MARKET, BY REGION, 2018-2033 (USD THOUSAND)
TABLE 91 NORTH AMERICA PLASTICS & RUBBER IN PLANT-BASED COLORANTS MARKET, BY APPLICATION, 2018-2033 (USD THOUSAND)
TABLE 92 NORTH AMERICA POLYMER COLORING IN PLANT-BASED COLORANTS MARKET, BY TYPE, 2018-2033 (USD THOUSAND)
TABLE 93 NORTH AMERICA RUBBER COLORING IN PLANT-BASED COLORANTS MARKET, BY TYPE, 2018-2033 (USD THOUSAND)
TABLE 94 NORTH AMERICA ADHESIVES IN PLANT-BASED COLORANTS MARKET, BY TYPE, 2018-2033 (USD THOUSAND)
TABLE 95 NORTH AMERICA GREASES & LUBRICANTS IN PLANT-BASED COLORANTS MARKET, BY TYPE, 2018-2033 (USD THOUSAND)
TABLE 96 NORTH AMERICA PLASTICS & RUBBER IN PLANT-BASED COLORANTS MARKET, BY PRODUCT TYPE, 2018-2033 (USD THOUSAND)
TABLE 97 NORTH AMERICA PLASTICS & RUBBER IN PLANT-BASED COLORANTS MARKET, BY REGION, 2018-2033 (USD THOUSAND)
TABLE 98 NORTH AMERICA PRINTING IN PLANT-BASED COLORANTS MARKET, BY APPLICATION, 2018-2033 (USD THOUSAND)
TABLE 99 NORTH AMERICA PRINTING IN PLANT-BASED COLORANTS MARKET, BY PRODUCT TYPE, 2018-2033 (USD THOUSAND)
TABLE 100 NORTH AMERICA PRINTING IN PLANT-BASED COLORANTS MARKET, BY REGION, 2018-2033 (USD THOUSAND)
TABLE 101 NORTH AMERICA OTHERS IN PLANT-BASED COLORANTS MARKET, BY REGION, 2018-2033 (USD THOUSAND)
TABLE 102 NORTH AMERICA PLANT-BASED COLORANTS MARKET, BY DISTRIBUTION CHANNEL, 2018-2033 (USD THOUSAND)
TABLE 103 NORTH AMERICA DIRECT IN PLANT-BASED COLORANTS MARKET, BY REGION, 2018-2033 (USD THOUSAND)
TABLE 104 NORTH AMERICA INDIRECT IN PLANT-BASED COLORANTS MARKET, BY TYPE, 2018-2033 (USD THOUSAND)
TABLE 105 NORTH AMERICA INDIRECT IN PLANT-BASED COLORANTS MARKET, BY REGION, 2018-2033 (USD THOUSAND)
TABLE 106 NORTH AMERICA PLANT-BASED COLORANTS MARKET, BY COUNTRY, 2018-2033 (USD THOUSAND)
TABLE 107 NORTH AMERICA PLANT-BASED COLORANTS MARKET, BY COUNTRY, 2018-2033 (TONS)
TABLE 108 USD THOUSAND
TABLE 109 NORTH AMERICA PLANT-BASED COLORANTS MARKET, BY PRODUCT TYPE, 2018-2033 (USD THOUSAND)
TABLE 110 NORTH AMERICA PLANT-BASED COLORANTS MARKET, BY PRODUCT TYPE, 2018-2033 (TONS)
TABLE 111 NORTH AMERICA CAROTENOIDS IN PLANT-BASED COLORANTS MARKET, BY SOURCE, 2018-2033 (USD THOUSAND)
TABLE 112 NORTH AMERICA CAROTENOIDS IN PLANT-BASED COLORANTS MARKET, BY EXTRACTION TECHNOLOGY, 2018-2033 (USD THOUSAND)
TABLE 113 NORTH AMERICA ANTHOCYANINS IN PLANT-BASED COLORANTS MARKET, BY SOURCE, 2018-2033 (USD THOUSAND)
TABLE 114 NORTH AMERICA ANTHOCYANINS IN PLANT-BASED COLORANTS MARKET, BY EXTRACTION TECHNOLOGY, 2018-2033 (USD THOUSAND)
TABLE 115 NORTH AMERICA CHLOROPHYLLS IN PLANT-BASED COLORANTS MARKET, BY SOURCE, 2018-2033 (USD THOUSAND)
TABLE 116 NORTH AMERICA CHLOROPHYLLSIN PLANT-BASED COLORANTS MARKET, BY EXTRACTION TECHNOLOGY, 2018-2033 (USD THOUSAND)
TABLE 117 NORTH AMERICA BETALAINS IN PLANT-BASED COLORANTS MARKET, BY SOURCE, 2018-2033 (USD THOUSAND)
TABLE 118 NORTH AMERICA BETALAINS IN PLANT-BASED COLORANTS MARKET, BY EXTRACTION TECHNOLOGY, 2018-2033 (USD THOUSAND)
TABLE 119 NORTH AMERICA CURCUMIN IN PLANT-BASED COLORANTS MARKET, BY EXTRACTION TECHNOLOGY, 2018-2033 (USD THOUSAND)
TABLE 120 NORTH AMERICA PLANT-BASED COLORANTS MARKET, BY TYPE, 2018-2033 (USD THOUSAND)
TABLE 121 NORTH AMERICA PLANT-BASED COLORANTS MARKET, BY COLOR, 2018-2033 (USD THOUSAND)
TABLE 122 NORTH AMERICA PLANT-BASED COLORANTS MARKET, BY FORM, 2018-2033 (USD THOUSAND)
TABLE 123 NORTH AMERICA LIQUID/PASTE IN PLANT-BASED COLORANTS MARKET, BY MANUFACTURING PROCESS, 2018-2033 (USD THOUSAND)
TABLE 124 NORTH AMERICA PLANT-BASED COLORANTS MARKET, BY SOLUBILITY, 2018-2033 (USD THOUSAND)
TABLE 125 NORTH AMERICA PLANT-BASED COLORANTS MARKET, BY END USE, 2018-2033 (USD THOUSAND)
TABLE 126 NORTH AMERICA FOOD & BEVERAGE IN PLANT-BASED COLORANTS MARKET, BY APPLICATION, 2018-2033 (USD THOUSAND)
TABLE 127 NORTH AMERICA BEVERAGES IN PLANT-BASED COLORANTS MARKET, BY TYPE, 2018-2033 (USD THOUSAND)
TABLE 128 NORTH AMERICA CONFECTIONERY IN PLANT-BASED COLORANTS MARKET, BY TYPE, 2018-2033 (USD THOUSAND)
TABLE 129 NORTH AMERICA DAIRY PRODUCTS IN PLANT-BASED COLORANTS MARKET, BY TYPE, 2018-2033 (USD THOUSAND)
TABLE 130 NORTH AMERICA BAKERY PRODUCTS IN PLANT-BASED COLORANTS MARKET, BY TYPE, 2018-2033 (USD THOUSAND)
TABLE 131 NORTH AMERICA MEAT & POULTRY IN PLANT-BASED COLORANTS MARKET, BY TYPE, 2018-2033 (USD THOUSAND)
TABLE 132 NORTH AMERICA SAUCES & CONDIMENTS IN PLANT-BASED COLORANTS MARKET, BY TYPE, 2018-2033 (USD THOUSAND)
TABLE 133 NORTH AMERICA FOOD & BEVERAGE IN PLANT-BASED COLORANTS MARKET, BY PRODUCT TYPE, 2018-2033 (USD THOUSAND)
TABLE 134 NORTH AMERICA COSMETICS & PERSONAL CARE IN PLANT-BASED COLORANTS MARKET, BY APPLICATION, 2018-2033 (USD THOUSAND)
TABLE 135 NORTH AMERICA SKINCARE IN PLANT-BASED COLORANTS MARKET, BY TYPE, 2018-2033 (USD THOUSAND)
TABLE 136 NORTH AMERICA HAIRCARE IN PLANT-BASED COLORANTS MARKET, BY TYPE, 2018-2033 (USD THOUSAND)
TABLE 137 NORTH AMERICA FRAGRANCES IN PLANT-BASED COLORANTS MARKET, BY TYPE, 2018-2033 (USD THOUSAND)
TABLE 138 NORTH AMERICA COSMETICS & PERSONAL CARE IN PLANT-BASED COLORANTS MARKET, BY PRODUCT TYPE, 2018-2033 (USD THOUSAND)
TABLE 139 NORTH AMERICA TEXTILE INDUSTRY IN PLANT-BASED COLORANTS MARKET, BY APPLICATION, 2018-2033 (USD THOUSAND)
TABLE 140 NORTH AMERICA HOME TEXTILES IN PLANT-BASED COLORANTS MARKET, BY TYPE, 2018-2033 (USD THOUSAND)
TABLE 141 NORTH AMERICA TECHNICAL TEXTILES IN PLANT-BASED COLORANTS MARKET, BY TYPE, 2018-2033 (USD THOUSAND)
TABLE 142 NORTH AMERICA LEATHER & FUR IN PLANT-BASED COLORANTS MARKET, BY TYPE, 2018-2033 (USD THOUSAND)
TABLE 143 NORTH AMERICA FIBERS IN PLANT-BASED COLORANTS MARKET, BY TYPE, 2018-2033 (USD THOUSAND)
TABLE 144 NORTH AMERICA TEXTILE INDUSTRY IN PLANT-BASED COLORANTS MARKET, BY PRODUCT TYPE, 2018-2033 (USD THOUSAND)
TABLE 145 NORTH AMERICA PAINTS & COATINGS IN PLANT-BASED COLORANTS MARKET, BY TYPE, 2018-2033 (USD THOUSAND)
TABLE 146 NORTH AMERICA ARCHITECTURAL COATINGS IN PLANT-BASED COLORANTS MARKET, BY TYPE, 2018-2033 (USD THOUSAND)
TABLE 147 NORTH AMERICA INDUSTRIAL COATINGS IN PLANT-BASED COLORANTS MARKET, BY TYPE, 2018-2033 (USD THOUSAND)
TABLE 148 NORTH AMERICA AUTOMOTIVE COATINGS IN PLANT-BASED COLORANTS MARKET, BY TYPE, 2018-2033 (USD THOUSAND)
TABLE 149 NORTH AMERICA PAINTS & COATINGS IN PLANT-BASED COLORANTS MARKET, BY PRODUCT TYPE, 2018-2033 (USD THOUSAND)
TABLE 150 NORTH AMERICA PACKAGING IN PLANT-BASED COLORANTS MARKET, BY APPLICATION, 2018-2033 (USD THOUSAND)
TABLE 151 NORTH AMERICA PACKAGING IN PLANT-BASED COLORANTS MARKET, BY PRODUCT TYPE, 2018-2033 (USD THOUSAND)
TABLE 152 NORTH AMERICA PHARMCEUTICAL IN PLANT-BASED COLORANTS MARKET, BY APPLICATION, 2018-2033 (USD THOUSAND)
TABLE 153 NORTH AMERICA PHARMACEUTICAL IN PLANT-BASED COLORANTS MARKET, BY PRODUCT TYPE, 2018-2033 (USD THOUSAND)
TABLE 154 NORTH AMERICA PLASTICS & RUBBER IN PLANT-BASED COLORANTS MARKET, BY APPLICATION, 2018-2033 (USD THOUSAND)
TABLE 155 NORTH AMERICA POLYMER COLORING IN PLANT-BASED COLORANTS MARKET, BY TYPE, 2018-2033 (USD THOUSAND)
TABLE 156 NORTH AMERICA RUBBER COLORING IN PLANT-BASED COLORANTS MARKET, BY TYPE, 2018-2033 (USD THOUSAND)
TABLE 157 NORTH AMERICA ADHESIVES IN PLANT-BASED COLORANTS MARKET, BY TYPE, 2018-2033 (USD THOUSAND)
TABLE 158 NORTH AMERICA GREASES & LUBRICANTS IN PLANT-BASED COLORANTS MARKET, BY TYPE, 2018-2033 (USD THOUSAND)
TABLE 159 NORTH AMERICA PLASTICS & RUBBER IN PLANT-BASED COLORANTS MARKET, BY PRODUCT TYPE, 2018-2033 (USD THOUSAND)
TABLE 160 NORTH AMERICA PRINTING IN PLANT-BASED COLORANTS MARKET, BY APPLICATION, 2018-2033 (USD THOUSAND)
TABLE 161 NORTH AMERICA PRINTING IN PLANT-BASED COLORANTS MARKET, BY PRODUCT TYPE, 2018-2033 (USD THOUSAND)
TABLE 162 NORTH AMERICA PLANT-BASED COLORANTS MARKET, BY DISTRIBUTION CHANNEL, 2018-2033 (USD THOUSAND)
TABLE 163 NORTH AMERICA INDIRECT IN PLANT-BASED COLORANTS MARKET, BY TYPE, 2018-2033 (USD THOUSAND)
TABLE 164 U.S. PLANT-BASED COLORANTS MARKET, BY PRODUCT TYPE, 2018-2033 (USD THOUSAND)
TABLE 165 U.S. PLANT-BASED COLORANTS MARKET, BY PRODUCT TYPE, 2018-2033 (TONS)
TABLE 166 U.S. CAROTENOIDS IN PLANT-BASED COLORANTS MARKET, BY SOURCE, 2018-2033 (USD THOUSAND)
TABLE 167 U.S. CAROTENOIDS IN PLANT-BASED COLORANTS MARKET, BY EXTRACTION TECHNOLOGY, 2018-2033 (USD THOUSAND)
TABLE 168 U.S. ANTHOCYANINS IN PLANT-BASED COLORANTS MARKET, BY SOURCE, 2018-2033 (USD THOUSAND)
TABLE 169 U.S. ANTHOCYANINS IN PLANT-BASED COLORANTS MARKET, BY EXTRACTION TECHNOLOGY, 2018-2033 (USD THOUSAND)
TABLE 170 U.S. CHLOROPHYLLS IN PLANT-BASED COLORANTS MARKET, BY SOURCE, 2018-2033 (USD THOUSAND)
TABLE 171 U.S. CHLOROPHYLLSIN PLANT-BASED COLORANTS MARKET, BY EXTRACTION TECHNOLOGY, 2018-2033 (USD THOUSAND)
TABLE 172 U.S. BETALAINS IN PLANT-BASED COLORANTS MARKET, BY SOURCE, 2018-2033 (USD THOUSAND)
TABLE 173 U.S. BETALAINS IN PLANT-BASED COLORANTS MARKET, BY EXTRACTION TECHNOLOGY, 2018-2033 (USD THOUSAND)
TABLE 174 U.S. CURCUMIN IN PLANT-BASED COLORANTS MARKET, BY EXTRACTION TECHNOLOGY, 2018-2033 (USD THOUSAND)
TABLE 175 U.S. PLANT-BASED COLORANTS MARKET, BY TYPE, 2018-2033 (USD THOUSAND)
TABLE 176 U.S. PLANT-BASED COLORANTS MARKET, BY COLOR, 2018-2033 (USD THOUSAND)
TABLE 177 U.S. PLANT-BASED COLORANTS MARKET, BY FORM, 2018-2033 (USD THOUSAND)
TABLE 178 U.S. LIQUID/PASTE IN PLANT-BASED COLORANTS MARKET, BY MANUFACTURING PROCESS, 2018-2033 (USD THOUSAND)
TABLE 179 U.S. PLANT-BASED COLORANTS MARKET, BY SOLUBILITY, 2018-2033 (USD THOUSAND)
TABLE 180 U.S. PLANT-BASED COLORANTS MARKET, BY END USE, 2018-2033 (USD THOUSAND)
TABLE 181 U.S. FOOD & BEVERAGE IN PLANT-BASED COLORANTS MARKET, BY APPLICATION, 2018-2033 (USD THOUSAND)
TABLE 182 U.S. BEVERAGES IN PLANT-BASED COLORANTS MARKET, BY TYPE, 2018-2033 (USD THOUSAND)
TABLE 183 U.S. CONFECTIONERY IN PLANT-BASED COLORANTS MARKET, BY TYPE, 2018-2033 (USD THOUSAND)
TABLE 184 U.S. DAIRY PRODUCTS IN PLANT-BASED COLORANTS MARKET, BY TYPE, 2018-2033 (USD THOUSAND)
TABLE 185 U.S. BAKERY PRODUCTS IN PLANT-BASED COLORANTS MARKET, BY TYPE, 2018-2033 (USD THOUSAND)
TABLE 186 U.S. MEAT & POULTRY IN PLANT-BASED COLORANTS MARKET, BY TYPE, 2018-2033 (USD THOUSAND)
TABLE 187 U.S. SAUCES & CONDIMENTS IN PLANT-BASED COLORANTS MARKET, BY TYPE, 2018-2033 (USD THOUSAND)
TABLE 188 U.S. FOOD & BEVERAGE IN PLANT-BASED COLORANTS MARKET, BY PRODUCT TYPE, 2018-2033 (USD THOUSAND)
TABLE 189 U.S. COSMETICS & PERSONAL CARE IN PLANT-BASED COLORANTS MARKET, BY APPLICATION, 2018-2033 (USD THOUSAND)
TABLE 190 U.S. SKINCARE IN PLANT-BASED COLORANTS MARKET, BY TYPE, 2018-2033 (USD THOUSAND)
TABLE 191 U.S. HAIRCARE IN PLANT-BASED COLORANTS MARKET, BY TYPE, 2018-2033 (USD THOUSAND)
TABLE 192 U.S. FRAGRANCES IN PLANT-BASED COLORANTS MARKET, BY TYPE, 2018-2033 (USD THOUSAND)
TABLE 193 U.S. COSMETICS & PERSONAL CARE IN PLANT-BASED COLORANTS MARKET, BY PRODUCT TYPE, 2018-2033 (USD THOUSAND)
TABLE 194 U.S. TEXTILE INDUSTRY IN PLANT-BASED COLORANTS MARKET, BY APPLICATION, 2018-2033 (USD THOUSAND)
TABLE 195 U.S. HOME TEXTILES IN PLANT-BASED COLORANTS MARKET, BY TYPE, 2018-2033 (USD THOUSAND)
TABLE 196 U.S. TECHNICAL TEXTILES IN PLANT-BASED COLORANTS MARKET, BY TYPE, 2018-2033 (USD THOUSAND)
TABLE 197 U.S. LEATHER & FUR IN PLANT-BASED COLORANTS MARKET, BY TYPE, 2018-2033 (USD THOUSAND)
TABLE 198 U.S. FIBERS IN PLANT-BASED COLORANTS MARKET, BY TYPE, 2018-2033 (USD THOUSAND)
TABLE 199 U.S. TEXTILE INDUSTRY IN PLANT-BASED COLORANTS MARKET, BY PRODUCT TYPE, 2018-2033 (USD THOUSAND)
TABLE 200 U.S. PAINTS & COATINGS IN PLANT-BASED COLORANTS MARKET, BY TYPE, 2018-2033 (USD THOUSAND)
TABLE 201 U.S. ARCHITECTURAL COATINGS IN PLANT-BASED COLORANTS MARKET, BY TYPE, 2018-2033 (USD THOUSAND)
TABLE 202 U.S. INDUSTRIAL COATINGS IN PLANT-BASED COLORANTS MARKET, BY TYPE, 2018-2033 (USD THOUSAND)
TABLE 203 U.S. AUTOMOTIVE COATINGS IN PLANT-BASED COLORANTS MARKET, BY TYPE, 2018-2033 (USD THOUSAND)
TABLE 204 U.S. PAINTS & COATINGS IN PLANT-BASED COLORANTS MARKET, BY PRODUCT TYPE, 2018-2033 (USD THOUSAND)
TABLE 205 U.S. PACKAGING IN PLANT-BASED COLORANTS MARKET, BY APPLICATION, 2018-2033 (USD THOUSAND)
TABLE 206 U.S. PACKAGING IN PLANT-BASED COLORANTS MARKET, BY PRODUCT TYPE, 2018-2033 (USD THOUSAND)
TABLE 207 U.S. PHARMCEUTICAL IN PLANT-BASED COLORANTS MARKET, BY APPLICATION, 2018-2033 (USD THOUSAND)
TABLE 208 U.S. PHARMACEUTICAL IN PLANT-BASED COLORANTS MARKET, BY PRODUCT TYPE, 2018-2033 (USD THOUSAND)
TABLE 209 U.S. PLASTICS & RUBBER IN PLANT-BASED COLORANTS MARKET, BY APPLICATION, 2018-2033 (USD THOUSAND)
TABLE 210 U.S. POLYMER COLORING IN PLANT-BASED COLORANTS MARKET, BY TYPE, 2018-2033 (USD THOUSAND)
TABLE 211 U.S. RUBBER COLORING IN PLANT-BASED COLORANTS MARKET, BY TYPE, 2018-2033 (USD THOUSAND)
TABLE 212 U.S. ADHESIVES IN PLANT-BASED COLORANTS MARKET, BY TYPE, 2018-2033 (USD THOUSAND)
TABLE 213 U.S. GREASES & LUBRICANTS IN PLANT-BASED COLORANTS MARKET, BY TYPE, 2018-2033 (USD THOUSAND)
TABLE 214 U.S. PLASTICS & RUBBER IN PLANT-BASED COLORANTS MARKET, BY PRODUCT TYPE, 2018-2033 (USD THOUSAND)
TABLE 215 U.S. PRINTING IN PLANT-BASED COLORANTS MARKET, BY APPLICATION, 2018-2033 (USD THOUSAND)
TABLE 216 U.S. PRINTING IN PLANT-BASED COLORANTS MARKET, BY PRODUCT TYPE, 2018-2033 (USD THOUSAND)
TABLE 217 U.S. PLANT-BASED COLORANTS MARKET, BY DISTRIBUTION CHANNEL, 2018-2033 (USD THOUSAND)
TABLE 218 U.S. INDIRECT IN PLANT-BASED COLORANTS MARKET, BY TYPE, 2018-2033 (USD THOUSAND)
TABLE 219 CANADA PLANT-BASED COLORANTS MARKET, BY PRODUCT TYPE, 2018-2033 (USD THOUSAND)
TABLE 220 CANADA PLANT-BASED COLORANTS MARKET, BY PRODUCT TYPE, 2018-2033 (TONS)
TABLE 221 CANADA CAROTENOIDS IN PLANT-BASED COLORANTS MARKET, BY SOURCE, 2018-2033 (USD THOUSAND)
TABLE 222 CANADA CAROTENOIDS IN PLANT-BASED COLORANTS MARKET, BY EXTRACTION TECHNOLOGY, 2018-2033 (USD THOUSAND)
TABLE 223 CANADA ANTHOCYANINS IN PLANT-BASED COLORANTS MARKET, BY SOURCE, 2018-2033 (USD THOUSAND)
TABLE 224 CANADA ANTHOCYANINS IN PLANT-BASED COLORANTS MARKET, BY EXTRACTION TECHNOLOGY, 2018-2033 (USD THOUSAND)
TABLE 225 CANADA CHLOROPHYLLS IN PLANT-BASED COLORANTS MARKET, BY SOURCE, 2018-2033 (USD THOUSAND)
TABLE 226 CANADA CHLOROPHYLLSIN PLANT-BASED COLORANTS MARKET, BY EXTRACTION TECHNOLOGY, 2018-2033 (USD THOUSAND)
TABLE 227 CANADA BETALAINS IN PLANT-BASED COLORANTS MARKET, BY SOURCE, 2018-2033 (USD THOUSAND)
TABLE 228 CANADA BETALAINS IN PLANT-BASED COLORANTS MARKET, BY EXTRACTION TECHNOLOGY, 2018-2033 (USD THOUSAND)
TABLE 229 CANADA CURCUMIN IN PLANT-BASED COLORANTS MARKET, BY EXTRACTION TECHNOLOGY, 2018-2033 (USD THOUSAND)
TABLE 230 CANADA PLANT-BASED COLORANTS MARKET, BY TYPE, 2018-2033 (USD THOUSAND)
TABLE 231 CANADA PLANT-BASED COLORANTS MARKET, BY COLOR, 2018-2033 (USD THOUSAND)
TABLE 232 CANADA PLANT-BASED COLORANTS MARKET, BY FORM, 2018-2033 (USD THOUSAND)
TABLE 233 CANADA LIQUID/PASTE IN PLANT-BASED COLORANTS MARKET, BY MANUFACTURING PROCESS, 2018-2033 (USD THOUSAND)
TABLE 234 CANADA PLANT-BASED COLORANTS MARKET, BY SOLUBILITY, 2018-2033 (USD THOUSAND)
TABLE 235 CANADA PLANT-BASED COLORANTS MARKET, BY END USE, 2018-2033 (USD THOUSAND)
TABLE 236 CANADA FOOD & BEVERAGE IN PLANT-BASED COLORANTS MARKET, BY APPLICATION, 2018-2033 (USD THOUSAND)
TABLE 237 CANADA BEVERAGES IN PLANT-BASED COLORANTS MARKET, BY TYPE, 2018-2033 (USD THOUSAND)
TABLE 238 CANADA CONFECTIONERY IN PLANT-BASED COLORANTS MARKET, BY TYPE, 2018-2033 (USD THOUSAND)
TABLE 239 CANADA DAIRY PRODUCTS IN PLANT-BASED COLORANTS MARKET, BY TYPE, 2018-2033 (USD THOUSAND)
TABLE 240 CANADA BAKERY PRODUCTS IN PLANT-BASED COLORANTS MARKET, BY TYPE, 2018-2033 (USD THOUSAND)
TABLE 241 CANADA MEAT & POULTRY IN PLANT-BASED COLORANTS MARKET, BY TYPE, 2018-2033 (USD THOUSAND)
TABLE 242 CANADA SAUCES & CONDIMENTS IN PLANT-BASED COLORANTS MARKET, BY TYPE, 2018-2033 (USD THOUSAND)
TABLE 243 CANADA FOOD & BEVERAGE IN PLANT-BASED COLORANTS MARKET, BY PRODUCT TYPE, 2018-2033 (USD THOUSAND)
TABLE 244 CANADA COSMETICS & PERSONAL CARE IN PLANT-BASED COLORANTS MARKET, BY APPLICATION, 2018-2033 (USD THOUSAND)
TABLE 245 CANADA SKINCARE IN PLANT-BASED COLORANTS MARKET, BY TYPE, 2018-2033 (USD THOUSAND)
TABLE 246 CANADA HAIRCARE IN PLANT-BASED COLORANTS MARKET, BY TYPE, 2018-2033 (USD THOUSAND)
TABLE 247 CANADA FRAGRANCES IN PLANT-BASED COLORANTS MARKET, BY TYPE, 2018-2033 (USD THOUSAND)
TABLE 248 CANADA COSMETICS & PERSONAL CARE IN PLANT-BASED COLORANTS MARKET, BY PRODUCT TYPE, 2018-2033 (USD THOUSAND)
TABLE 249 CANADA TEXTILE INDUSTRY IN PLANT-BASED COLORANTS MARKET, BY APPLICATION, 2018-2033 (USD THOUSAND)
TABLE 250 CANADA HOME TEXTILES IN PLANT-BASED COLORANTS MARKET, BY TYPE, 2018-2033 (USD THOUSAND)
TABLE 251 CANADA TECHNICAL TEXTILES IN PLANT-BASED COLORANTS MARKET, BY TYPE, 2018-2033 (USD THOUSAND)
TABLE 252 CANADA LEATHER & FUR IN PLANT-BASED COLORANTS MARKET, BY TYPE, 2018-2033 (USD THOUSAND)
TABLE 253 CANADA FIBERS IN PLANT-BASED COLORANTS MARKET, BY TYPE, 2018-2033 (USD THOUSAND)
TABLE 254 CANADA TEXTILE INDUSTRY IN PLANT-BASED COLORANTS MARKET, BY PRODUCT TYPE, 2018-2033 (USD THOUSAND)
TABLE 255 CANADA PAINTS & COATINGS IN PLANT-BASED COLORANTS MARKET, BY TYPE, 2018-2033 (USD THOUSAND)
TABLE 256 CANADA ARCHITECTURAL COATINGS IN PLANT-BASED COLORANTS MARKET, BY TYPE, 2018-2033 (USD THOUSAND)
TABLE 257 CANADA INDUSTRIAL COATINGS IN PLANT-BASED COLORANTS MARKET, BY TYPE, 2018-2033 (USD THOUSAND)
TABLE 258 CANADA AUTOMOTIVE COATINGS IN PLANT-BASED COLORANTS MARKET, BY TYPE, 2018-2033 (USD THOUSAND)
TABLE 259 CANADA PAINTS & COATINGS IN PLANT-BASED COLORANTS MARKET, BY PRODUCT TYPE, 2018-2033 (USD THOUSAND)
TABLE 260 CANADA PACKAGING IN PLANT-BASED COLORANTS MARKET, BY APPLICATION, 2018-2033 (USD THOUSAND)
TABLE 261 CANADA PACKAGING IN PLANT-BASED COLORANTS MARKET, BY PRODUCT TYPE, 2018-2033 (USD THOUSAND)
TABLE 262 CANADA PHARMCEUTICAL IN PLANT-BASED COLORANTS MARKET, BY APPLICATION, 2018-2033 (USD THOUSAND)
TABLE 263 CANADA PHARMACEUTICAL IN PLANT-BASED COLORANTS MARKET, BY PRODUCT TYPE, 2018-2033 (USD THOUSAND)
TABLE 264 CANADA PLASTICS & RUBBER IN PLANT-BASED COLORANTS MARKET, BY APPLICATION, 2018-2033 (USD THOUSAND)
TABLE 265 CANADA POLYMER COLORING IN PLANT-BASED COLORANTS MARKET, BY TYPE, 2018-2033 (USD THOUSAND)
TABLE 266 CANADA RUBBER COLORING IN PLANT-BASED COLORANTS MARKET, BY TYPE, 2018-2033 (USD THOUSAND)
TABLE 267 CANADA ADHESIVES IN PLANT-BASED COLORANTS MARKET, BY TYPE, 2018-2033 (USD THOUSAND)
TABLE 268 CANADA GREASES & LUBRICANTS IN PLANT-BASED COLORANTS MARKET, BY TYPE, 2018-2033 (USD THOUSAND)
TABLE 269 CANADA PLASTICS & RUBBER IN PLANT-BASED COLORANTS MARKET, BY PRODUCT TYPE, 2018-2033 (USD THOUSAND)
TABLE 270 CANADA PRINTING IN PLANT-BASED COLORANTS MARKET, BY APPLICATION, 2018-2033 (USD THOUSAND)
TABLE 271 CANADA PRINTING IN PLANT-BASED COLORANTS MARKET, BY PRODUCT TYPE, 2018-2033 (USD THOUSAND)
TABLE 272 CANADA PLANT-BASED COLORANTS MARKET, BY DISTRIBUTION CHANNEL, 2018-2033 (USD THOUSAND)
TABLE 273 CANADA INDIRECT IN PLANT-BASED COLORANTS MARKET, BY TYPE, 2018-2033 (USD THOUSAND)
TABLE 274 MEXICO PLANT-BASED COLORANTS MARKET, BY PRODUCT TYPE, 2018-2033 (USD THOUSAND)
TABLE 275 MEXICO PLANT-BASED COLORANTS MARKET, BY PRODUCT TYPE, 2018-2033 (TONS)
TABLE 276 MEXICO CAROTENOIDS IN PLANT-BASED COLORANTS MARKET, BY SOURCE, 2018-2033 (USD THOUSAND)
TABLE 277 MEXICO CAROTENOIDS IN PLANT-BASED COLORANTS MARKET, BY EXTRACTION TECHNOLOGY, 2018-2033 (USD THOUSAND)
TABLE 278 MEXICO ANTHOCYANINS IN PLANT-BASED COLORANTS MARKET, BY SOURCE, 2018-2033 (USD THOUSAND)
TABLE 279 MEXICO ANTHOCYANINS IN PLANT-BASED COLORANTS MARKET, BY EXTRACTION TECHNOLOGY, 2018-2033 (USD THOUSAND)
TABLE 280 MEXICO CHLOROPHYLLS IN PLANT-BASED COLORANTS MARKET, BY SOURCE, 2018-2033 (USD THOUSAND)
TABLE 281 MEXICO CHLOROPHYLLSIN PLANT-BASED COLORANTS MARKET, BY EXTRACTION TECHNOLOGY, 2018-2033 (USD THOUSAND)
TABLE 282 MEXICO BETALAINS IN PLANT-BASED COLORANTS MARKET, BY SOURCE, 2018-2033 (USD THOUSAND)
TABLE 283 MEXICO BETALAINS IN PLANT-BASED COLORANTS MARKET, BY EXTRACTION TECHNOLOGY, 2018-2033 (USD THOUSAND)
TABLE 284 MEXICO CURCUMIN IN PLANT-BASED COLORANTS MARKET, BY EXTRACTION TECHNOLOGY, 2018-2033 (USD THOUSAND)
TABLE 285 MEXICO PLANT-BASED COLORANTS MARKET, BY TYPE, 2018-2033 (USD THOUSAND)
TABLE 286 MEXICO PLANT-BASED COLORANTS MARKET, BY COLOR, 2018-2033 (USD THOUSAND)
TABLE 287 MEXICO PLANT-BASED COLORANTS MARKET, BY FORM, 2018-2033 (USD THOUSAND)
TABLE 288 MEXICO LIQUID/PASTE IN PLANT-BASED COLORANTS MARKET, BY MANUFACTURING PROCESS, 2018-2033 (USD THOUSAND)
TABLE 289 MEXICO PLANT-BASED COLORANTS MARKET, BY SOLUBILITY, 2018-2033 (USD THOUSAND)
TABLE 290 MEXICO PLANT-BASED COLORANTS MARKET, BY END USE, 2018-2033 (USD THOUSAND)
TABLE 291 MEXICO FOOD & BEVERAGE IN PLANT-BASED COLORANTS MARKET, BY APPLICATION, 2018-2033 (USD THOUSAND)
TABLE 292 MEXICO BEVERAGES IN PLANT-BASED COLORANTS MARKET, BY TYPE, 2018-2033 (USD THOUSAND)
TABLE 293 MEXICO CONFECTIONERY IN PLANT-BASED COLORANTS MARKET, BY TYPE, 2018-2033 (USD THOUSAND)
TABLE 294 MEXICO DAIRY PRODUCTS IN PLANT-BASED COLORANTS MARKET, BY TYPE, 2018-2033 (USD THOUSAND)
TABLE 295 MEXICO BAKERY PRODUCTS IN PLANT-BASED COLORANTS MARKET, BY TYPE, 2018-2033 (USD THOUSAND)
TABLE 296 MEXICO MEAT & POULTRY IN PLANT-BASED COLORANTS MARKET, BY TYPE, 2018-2033 (USD THOUSAND)
TABLE 297 MEXICO SAUCES & CONDIMENTS IN PLANT-BASED COLORANTS MARKET, BY TYPE, 2018-2033 (USD THOUSAND)
TABLE 298 MEXICO FOOD & BEVERAGE IN PLANT-BASED COLORANTS MARKET, BY PRODUCT TYPE, 2018-2033 (USD THOUSAND)
TABLE 299 MEXICO COSMETICS & PERSONAL CARE IN PLANT-BASED COLORANTS MARKET, BY APPLICATION, 2018-2033 (USD THOUSAND)
TABLE 300 MEXICO SKINCARE IN PLANT-BASED COLORANTS MARKET, BY TYPE, 2018-2033 (USD THOUSAND)
TABLE 301 MEXICO HAIRCARE IN PLANT-BASED COLORANTS MARKET, BY TYPE, 2018-2033 (USD THOUSAND)
TABLE 302 MEXICO FRAGRANCES IN PLANT-BASED COLORANTS MARKET, BY TYPE, 2018-2033 (USD THOUSAND)
TABLE 303 MEXICO COSMETICS & PERSONAL CARE IN PLANT-BASED COLORANTS MARKET, BY PRODUCT TYPE, 2018-2033 (USD THOUSAND)
TABLE 304 MEXICO TEXTILE INDUSTRY IN PLANT-BASED COLORANTS MARKET, BY APPLICATION, 2018-2033 (USD THOUSAND)
TABLE 305 MEXICO HOME TEXTILES IN PLANT-BASED COLORANTS MARKET, BY TYPE, 2018-2033 (USD THOUSAND)
TABLE 306 MEXICO TECHNICAL TEXTILES IN PLANT-BASED COLORANTS MARKET, BY TYPE, 2018-2033 (USD THOUSAND)
TABLE 307 MEXICO LEATHER & FUR IN PLANT-BASED COLORANTS MARKET, BY TYPE, 2018-2033 (USD THOUSAND)
TABLE 308 MEXICO FIBERS IN PLANT-BASED COLORANTS MARKET, BY TYPE, 2018-2033 (USD THOUSAND)
TABLE 309 MEXICO TEXTILE INDUSTRY IN PLANT-BASED COLORANTS MARKET, BY PRODUCT TYPE, 2018-2033 (USD THOUSAND)
TABLE 310 MEXICO PAINTS & COATINGS IN PLANT-BASED COLORANTS MARKET, BY TYPE, 2018-2033 (USD THOUSAND)
TABLE 311 MEXICO ARCHITECTURAL COATINGS IN PLANT-BASED COLORANTS MARKET, BY TYPE, 2018-2033 (USD THOUSAND)
TABLE 312 MEXICO INDUSTRIAL COATINGS IN PLANT-BASED COLORANTS MARKET, BY TYPE, 2018-2033 (USD THOUSAND)
TABLE 313 MEXICO AUTOMOTIVE COATINGS IN PLANT-BASED COLORANTS MARKET, BY TYPE, 2018-2033 (USD THOUSAND)
TABLE 314 MEXICO PAINTS & COATINGS IN PLANT-BASED COLORANTS MARKET, BY PRODUCT TYPE, 2018-2033 (USD THOUSAND)
TABLE 315 MEXICO PACKAGING IN PLANT-BASED COLORANTS MARKET, BY APPLICATION, 2018-2033 (USD THOUSAND)
TABLE 316 MEXICO PACKAGING IN PLANT-BASED COLORANTS MARKET, BY PRODUCT TYPE, 2018-2033 (USD THOUSAND)
TABLE 317 MEXICO PHARMCEUTICAL IN PLANT-BASED COLORANTS MARKET, BY APPLICATION, 2018-2033 (USD THOUSAND)
TABLE 318 MEXICO PHARMACEUTICAL IN PLANT-BASED COLORANTS MARKET, BY PRODUCT TYPE, 2018-2033 (USD THOUSAND)
TABLE 319 MEXICO PLASTICS & RUBBER IN PLANT-BASED COLORANTS MARKET, BY APPLICATION, 2018-2033 (USD THOUSAND)
TABLE 320 MEXICO POLYMER COLORING IN PLANT-BASED COLORANTS MARKET, BY TYPE, 2018-2033 (USD THOUSAND)
TABLE 321 MEXICO RUBBER COLORING IN PLANT-BASED COLORANTS MARKET, BY TYPE, 2018-2033 (USD THOUSAND)
TABLE 322 MEXICO ADHESIVES IN PLANT-BASED COLORANTS MARKET, BY TYPE, 2018-2033 (USD THOUSAND)
TABLE 323 MEXICO GREASES & LUBRICANTS IN PLANT-BASED COLORANTS MARKET, BY TYPE, 2018-2033 (USD THOUSAND)
TABLE 324 MEXICO PLASTICS & RUBBER IN PLANT-BASED COLORANTS MARKET, BY PRODUCT TYPE, 2018-2033 (USD THOUSAND)
TABLE 325 MEXICO PRINTING IN PLANT-BASED COLORANTS MARKET, BY APPLICATION, 2018-2033 (USD THOUSAND)
TABLE 326 MEXICO PRINTING IN PLANT-BASED COLORANTS MARKET, BY PRODUCT TYPE, 2018-2033 (USD THOUSAND)
TABLE 327 MEXICO PLANT-BASED COLORANTS MARKET, BY DISTRIBUTION CHANNEL, 2018-2033 (USD THOUSAND)
TABLE 328 MEXICO INDIRECT IN PLANT-BASED COLORANTS MARKET, BY TYPE, 2018-2033 (USD THOUSAND)
List of Figure
FIGURE 1 NORTH AMERICA PLANT-BASED COLORANTS MARKET: SEGMENTATION
FIGURE 2 NORTH AMERICA PLANT-BASED COLORANTS MARKET: DATA TRIANGULATION
FIGURE 3 NORTH AMERICA PLANT-BASED COLORANTS MARKET: DROC ANALYSIS
FIGURE 4 NORTH AMERICA PLANT-BASED COLORANTS MARKET: NORTH AMERICA VS REGIONAL MARKET ANALYSIS
FIGURE 5 NORTH AMERICA PLANT-BASED COLORANTS MARKET: COMPANY RESEARCH ANALYSIS
FIGURE 6 NORTH AMERICA PLANT-BASED COLORANTS MARKET: INTERVIEW DEMOGRAPHICS
FIGURE 7 NORTH AMERICA PLANT-BASED COLORANTS MARKET: DBMR MARKET POSITION GRID
FIGURE 8 NORTH AMERICA PLANT-BASED COLORANTS MARKET: VENDOR SHARE ANALYSIS
FIGURE 9 NORTH AMERICA PLANT-BASED COLORANTS MARKET: MULTIVARIVATE MODELING
FIGURE 10 NORTH AMERICA PLANT-BASED COLORANTS MARKET: PRODUCT TYPE TIMELINE CURVE
FIGURE 11 NORTH AMERICA PLANT-BASED COLORANTS MARKET: END-USER COVERAGE GRID
FIGURE 12 NORTH AMERICA PLANT-BASED COLORANTS MARKET: SEGMENTATION
FIGURE 13 ELEVEN SEGMENTS COMPRISE THE NORTH AMERICA PLANT-BASED COLORANTS MARKET, BY PRODUCT TYPE (2025)
FIGURE 14 NORTH AMERICA PLANT-BASED COLORANTS MARKET: EXECUTIVE SUMMARY
FIGURE 15 STRATEGIC DECISIONS
FIGURE 16 RISING CONSUMER DEMAND FOR CLEAN-LABEL, NATURAL, AND RECOGNIZABLE FOOD INGREDIENTS IS EXPECTED TO DRIVE THE NORTH AMERICA PLANT-BASED COLORANTS MARKET DURING THE FORECAST PERIOD OF 2026 TO 2033
FIGURE 17 CAROTENOIDS SEGMENT IS EXPECTED TO ACCOUNT FOR THE LARGEST SHARE OF THE NORTH AMERICA PLANT-BASED COLORANTS MARKET IN 2026 & 2033
FIGURE 18 PORTER’S FIVE FORCES ANALYSIS
FIGURE 19 NORTH AMERICA PLANT-BASED COLORANTS MARKET, 2018-2033, AVERAGE PRICE (USD/KG)
FIGURE 20 VENDOR SELECTION CRITERIA
FIGURE 21 DROC ANALYSIS
FIGURE 22 NORTH AMERICA PLANT-BASED COLORANTS MARKET: BY PRODUCT TYPE, 2025 (USD THOUSAND)
FIGURE 23 NORTH AMERICA PLANT-BASED COLORANTS MARKET: BY TYPE, 2025 (USD THOUSAND)
FIGURE 24 NORTH AMERICA PLANT-BASED COLORANTS MARKET: BY COLOR, 2025 (USD THOUSAND)
FIGURE 25 NORTH AMERICA PLANT-BASED COLORANTS MARKET: BY FORM, 2025 (USD THOUSAND)
FIGURE 26 NORTH AMERICA PLANT-BASED COLORANTS MARKET: BY SOLUBILITY, 2025 (USD THOUSAND)
FIGURE 27 NORTH AMERICA PLANT-BASED COLORANTS MARKET: BY END USE, 2025 (USD THOUSAND)
FIGURE 28 NORTH AMERICA PLANT-BASED COLORANTS MARKET: BY DISTRIBUTION CHANNEL, 2025 (USD THOUSAND)
FIGURE 29 NORTH AMERICA PLANT-BASED COLORANTS MARKET: SNAPSHOT (2026)
FIGURE 30 NORTH AMERICA PLANT-BASED COLORANTS MARKET: COMPANY SHARE 2025 (%)
Data collection and base year analysis are done using data collection modules with large sample sizes. The stage includes obtaining market information or related data through various sources and strategies. It includes examining and planning all the data acquired from the past in advance. It likewise envelops the examination of information inconsistencies seen across different information sources. The market data is analysed and estimated using market statistical and coherent models. Also, market share analysis and key trend analysis are the major success factors in the market report. To know more, please request an analyst call or drop down your inquiry.
The key research methodology used by DBMR research team is data triangulation which involves data mining, analysis of the impact of data variables on the market and primary (industry expert) validation. Data models include Vendor Positioning Grid, Market Time Line Analysis, Market Overview and Guide, Company Positioning Grid, Patent Analysis, Pricing Analysis, Company Market Share Analysis, Standards of Measurement, Global versus Regional and Vendor Share Analysis. To know more about the research methodology, drop in an inquiry to speak to our industry experts.
Data Bridge Market Research is a leader in advanced formative research. We take pride in servicing our existing and new customers with data and analysis that match and suits their goal. The report can be customized to include price trend analysis of target brands understanding the market for additional countries (ask for the list of countries), clinical trial results data, literature review, refurbished market and product base analysis. Market analysis of target competitors can be analyzed from technology-based analysis to market portfolio strategies. We can add as many competitors that you require data about in the format and data style you are looking for. Our team of analysts can also provide you data in crude raw excel files pivot tables (Fact book) or can assist you in creating presentations from the data sets available in the report.


