
North America Plastic Compounding Market
Market Size in USD Billion
 USD
58.94 Billion
USD
85.13 Billion
2024
2032
USD
58.94 Billion
USD
85.13 Billion
2024
2032
| 2025 - 2032 | |
| USD 58.94 Billion | |
| USD 85.13 Billion | |
| % | |
|
North America Plastic Compounding Market Size
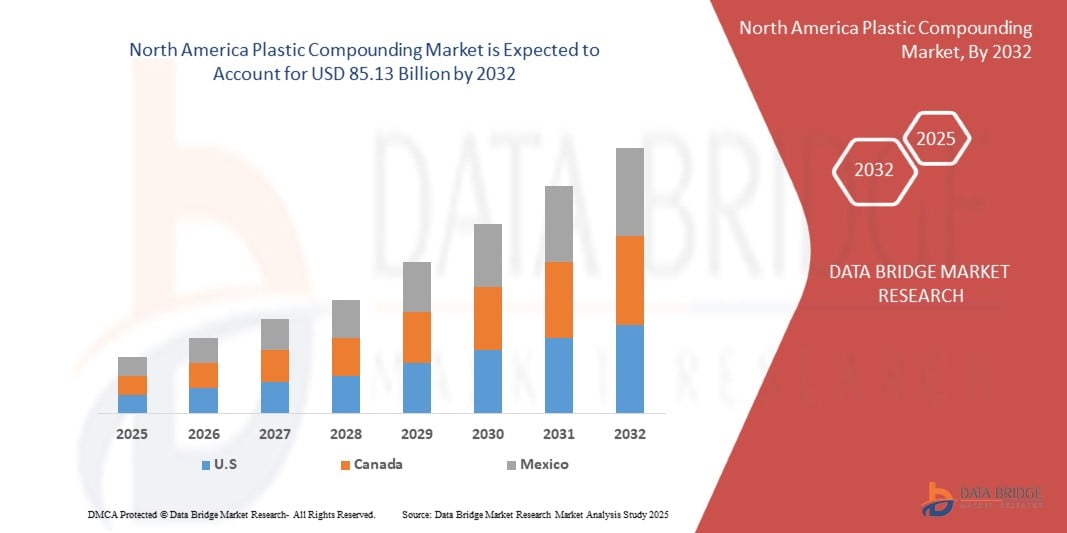
- The North America Plastic Compounding Market size was valued at USD 58.94 in 2024 and is expected to reach USD 85.13 billion by 2032, at a CAGR of 4.75% during the forecast period by Shift towards recyclable and biodegradable plastic compounds due to environmental regulations, advancements in compounding technologies improving product performance and cost-efficiency and supportive government policies and initiatives promoting the use of plastics in various industries
- Furthermore, the market is expected to growing use of bioplastics and sustainable compound alternatives, Surge in electric vehicle adoption requiring advanced polymers and Increasing demand for recyclable and circular plastic solutions
North America Plastic Compounding Market Analysis
- The global rise in the shift towards recyclable and biodegradable plastic compounds due to environmental regulations, advancements in compounding technologies improving product performance and cost-efficiency
- Key factors include the global rise in the shift towards recyclable and biodegradable plastic compounds due to environmental regulations, advancements in compounding technologies improving product performance and cost-efficiency, growing demand from energy transmission sectors, and increasing investments in grid modernization and cross-border infrastructure
- U.S. dominates the North America Plastic Compounding Market, holding the largest revenue share of 64.03% in 2024, growing demand for enhanced material properties, cost-efficiency, and increasing adoption in various industrial applications
- U.S. is projected to be the fastest-growing country in the market during the forecast period, driven by growing demand for lightweight, durable materials across industries and increasing focus on recyclable and sustainable plastic compounds
- The thermoplastics segment is expected to dominate the North America Plastic Compounding Market with a 61.36% share in 2025, driven by rising demand for improved material properties, cost-effectiveness, and broader industrial usage
Report Scope and North America Plastic Compounding Market Segmentation
|
Attributes |
North America Plastic Compounding Key Market Insights |
|
Segments Covered |
|
|
Countries Covered |
North America
|
|
Key Market Players |
|
|
Market Opportunities |
|
|
Value Added Data Infosets |
In addition to the insights on market scenarios such as market value, growth rate, segmentation, geographical coverage, and major players, the market reports curated by the Data Bridge Market Research also include import export analysis, production capacity overview, production consumption analysis, price trend analysis, climate change scenario, supply chain analysis, value chain analysis, raw material/consumables overview, vendor selection criteria, PESTLE Analysis, Porter Analysis, and regulatory framework. |
North America Plastic Compounding Market Trends
Surging Demand for High-Performance Plastics
- Demand for high-performance plastic compounds is growing rapidly—driven by rising urbanization, industrial activity, and the expanding use of electric vehicles and smart infrastructure. Advanced plastic compounds address these challenges by offering improved durability, energy efficiency, and enhanced product performance
- As countries focus on reducing carbon emissions and enhancing grid stability, there is a growing shift toward modernizing power infrastructure using innovative plastic compounds. This transition is critical for meeting increasing electricity demands while supporting cleaner and more efficient transmission systems
- Major industry players such as Covestro, LyondellBasell, and BASF are significantly increasing their R&D efforts to develop next-generation plastic compounds that are more sustainable, flexible, and high-performing, further driving innovation and market growth
- Advancements in plastic compounding technology—characterized by improved thermal stability, electrical insulation, and mechanical strength—are driving market growth. Leading manufacturers are actively developing specialized compounds to support large-scale renewable energy integration and enhance cross-regional energy infrastructure, fueling expansion in the global North America Plastic Compounding Market
North America Plastic Compounding Market Dynamics
Driver
Shift Towards Recyclable and Biodegradable Plastic Compounds Due to Environmental Regulations
- The rising global demand for sustainable materials—driven by stringent environmental regulations, increasing consumer awareness, and corporate sustainability goals—is placing immense pressure on traditional plastic production methods. To address this challenge, many manufacturers are accelerating investments in recyclable and biodegradable plastic compounds to reduce environmental impact and support circular economy initiatives. These developments are creating greener, more efficient, and future-ready material solutions, similar to how energy-efficient technologies optimize resource use.
- For instance, in 2024, several major chemical companies announced large-scale projects focused on expanding biodegradable plastic compounding capacities, aiming to meet growing demand from packaging, automotive, and consumer goods sectors. These initiatives focus on reducing plastic waste, enhancing recyclability, and complying with global regulatory frameworks such as the EU’s Circular Economy Action Plan.
- These investments are not only transforming material formulations but also enabling wider adoption of sustainable plastics across industries. Leading players such as BASF, Covestro, and LyondellBasell are heavily investing in R&D to develop next-generation bio-based and recyclable plastic compounds, ensuring enhanced performance and environmental compliance.
- Additionally, ongoing commitment by governments, private firms, and regulatory bodies is playing a pivotal role in promoting recyclable and biodegradable plastics as a critical component of global sustainability efforts. These initiatives are establishing eco-friendly plastic compounds as a key enabler of the circular economy and a major growth driver in the global North America Plastic Compounding Market
Restraint/Challenge
Volatility in Raw Material Prices, Especially Petroleum-Based Feedstocks Like Polypropylene and Polyethylene
- The volatility in raw material prices, particularly petroleum-based feedstocks such as polypropylene and polyethylene, remains a significant restraint on the North America Plastic Compounding Market. Fluctuating prices impact production costs and profitability, creating uncertainty for manufacturers and end-users alike
- Furthermore, dependence on crude oil markets exposes the compounding industry to geopolitical tensions, supply chain disruptions, and changing trade policies, which can lead to sudden price spikes or shortages
- For instance, in early 2025, global crude oil price fluctuations caused polypropylene prices to vary by over 20% within months, directly affecting plastic compound manufacturers’ input costs and forcing adjustments in pricing strategies
- Additionally, alternative raw materials such as bio-based feedstocks, though promising, are currently limited by higher costs and scalability challenges, preventing full mitigation of petroleum price volatility
- This price instability poses challenges for long-term planning and investment in the plastic compounding sector, particularly for smaller manufacturers and regions with less financial resilience. Despite efforts to diversify raw material sources and improve supply chain flexibility, volatility in feedstock prices remains a key barrier to stable growth
North America Plastic Compounding Market Scope
The market is segmented on the basis of polymer type, filler type, manufacturing process, usability, properties, and application.
- Polymer Type
On the basis of polymer type, the market is segmented into thermoplastics, thermosetting plastics, engineering plastics, bioplastics, and others. In 2025, the thermoplastics segment is expected to dominate the market with a market share of 61.36%, growing with the CAGR of 4.24% in the forecast period of 2025 to 2032 driven by growing demand for lightweight, durable materials across industries and increasing focus on recyclable and sustainable plastic compounds.
- Filler Type
On the basis of filler type, the market is segmented into mineral fillers, reinforcements, additives, and others. In 2025, the mineral fillers segment is expected to dominate the market with a market share of 47.86%, growing with the CAGR of 5.56% in the forecast period of 2025 to 2032 driven by growing demand for enhanced material properties, cost-efficiency, and increasing adoption in various industrial applications.
- Manufacturing Process
On the basis of manufacturing process, the market is segmented into extrusion, compaction / pressing, kneader / banbury mixing, injection molding based compounding, and others. In 2025, the extrusion segment is expected to dominate the market with a market share of 44.05%, growing with the CAGR of 5.12% in the forecast period of 2025 to 2032 driven by its widespread adoption for efficient, continuous compounding and growing demand for high-quality plastic compounds across various industries.
- Properties
On the basis of properties, the market is segmented into resistance, durability, flexibility, impact resistance, rigidity, and others. In 2025, the resistance segment is expected to dominate the market with a market share of 27.98%, growing with the CAGR of 5.42% in the forecast period of 2025 to 2032 driven by increasing demand for long-lasting and high-performance plastic compounds across automotive, construction, and consumer goods industries.
- Application
On the basis of application, the market is segmented into aerospace and defense, packaging, electrical & electronics, energy and power, building & construction, automotive, medical devices, furniture, and others. In 2025, the automotive segment is expected to dominate the market with a market share of 26.65%, growing with the CAGR of 3.38% in the forecast period of 2025 to 2032 driven by increasing demand for lightweight, durable, and recyclable plastic compounds to improve fuel efficiency and meet stringent environmental regulations.
North America Plastic Compounding Market Regional Analysis
- North America Plastic Compounding Market is expected to reach USD 85.13 billion by 2032, from USD 58.94 billion in 2024, growing at the CAGR of 4.75% in the forecast period of 2025 to 2032
- North America allocates a significant portion of its GDP to manufacturing and industrial development, ensuring robust funding for advanced materials and innovative plastic compounding technologies. In contrast, emerging markets are increasing their investments in plastic compounding driven by growing industrialization, urbanization, and rising demand for sustainable and high-performance materials. The availability of funding from both public and private sectors plays a crucial role in expanding production capacities and adoption of advanced plastic compounds globally
- In U.S., advanced plastic compounding technologies are widely adopted and integrated into various industrial applications, supporting sectors such as automotive, aerospace, and electronics. In contrast, emerging markets with developing manufacturing infrastructure are experiencing rapid growth in demand for specialized plastic compounds, driven by expanding industrial bases and increasing healthcare, automotive, and packaging needs. As these healthcare and industrial systems become more centralized or privatized, it often leads to increased investment in cutting-edge plastic compounding technologies, which promotes market growth and accessibility
Canada North America Plastic Compounding Market Insight
Canada is expected to register the CAGR of 4.44% from 2025 to 2032 in the North America region, driven by growing demand for enhanced material properties, cost-efficiency, and increasing adoption in various industrial applications.
Mexico North America Plastic Compounding Market Insight
Mexico is expected to register the CAGR of 3.91% from 2025 to 2032, driven by growing demand for lightweight, durable materials across industries and increasing focus on recyclable and sustainable plastic compounds.
North America Plastic Compounding Market Share
The North America Plastic Compounding Market is primarily led by well-established companies, including:
- LyondellBasell Industries Holdings B.V. (U.S.)
- BASF (Germany)
- LG Chem (South Korea)
- Dow (U.S.)
- SABIC (Saudi Arabia)
- Covestro AG (Germany)
- Teknor Apex (U.S.)
- LANXESS (Germany)
- Celanese Corporation (U.S.)
- Borealis GmbH (Austria)
- Asahi Kasei Corp. (Japan)
- Mitsubishi Chemical Group Corporation (Japan)
- DuPont (U.S.)
- Avient Corporation (U.S.)
- INEOS (U.K.)
- Kingfa Sci. & Tech. Co., Ltd (China)
- Washington Penn (U.S.)
- RTP Company (U.S.)
- Syensqo (Belgium)
- Envalior (Germany)
- Arkema (France)
- Trinseo (U.S.)
- Daicel Corporation (Japan)
- KANEKA CORPORATION (Japan)
- TORAY INDUSTRIES, INC. (Japan)
- Mitsui Chemicals, Inc. (Japan)
- Ensinger (Germany)
- CLARIANT (Switzerland)
Latest Developments in North America Plastic Compounding Market
- In June 2025, Envalior, in collaboration with SENTImotion and Frencken Group, announced a product innovation involving a new gearbox concept for robot arms using Stanyl PA46 engineering plastic. This development enables 50% lighter and 50% more cost-effective gearboxes compared to metal alternatives, supporting large-scale production of lightweight, energy-efficient robots. The innovation significantly benefits Envalior by expanding its footprint in the robotics and mobility sectors, opening new growth opportunities in consumer and industrial automation
- In May 2024, Envalior announced its participation in the “Plastics in E&E Applications” SKZ conference, where it showcased product innovations including sustainable polyamide 6 compounds and a new halogen-free flame-retardant PBT (e.g., Pocan BFN4221Z). This development focuses on expanding Envalior’s engineering plastics portfolio with a higher proportion of sustainable raw materials, enabling customers to reduce their carbon footprint and reliance on fossil-based inputs. The highlighted materials offer enhanced mechanical performance and flame retardancy, positioning Envalior to better serve growing demand in E&E sectors such as electromobility, 5G, and autonomous systems while reinforcing its leadership in sustainable thermoplastics
- In July 2025, Arkema has launched Zenimid, a new brand name for its ultra-high-performance polyimide range, marking a strategic product development. This innovation enhances Arkema’s specialty materials portfolio by catering to high-demand sectors such as aerospace, electronics, and automotive. With exceptional thermal, mechanical, and chemical resistance, Zenimid supports the company’s growth in advanced applications. The launch reinforces Arkema’s market position in high-performance polymers
- In June 2025, Trinseo unveiled LIGOS A9615, a new acrylic adhesive tailored for the General Purpose Label (GPL) segment, launched on June 9, 2025, targeting film labels in the Southeast Asian market. This development represents a strategic product launch reinforcing Trinseo’s strength in adhesive innovation. The product’s key benefits include excellent aging resistance, clean removability with repositioning capability, and plasticizer resistance, enabling reliable adhesion even on curved PVC surfaces common in consumer goods and packaging applications
- In February 2025, Trinseo announced, the launch of the first transparent, dissolution‑recycled polystyrene (rPS) resin product in Europe specifically approved for direct food contact, officially compliant with EU Regulation 2022/1616 This regulatory milestone followed extensive testing including a “Challenge Test” conducted with the Fraunhofer Institute to validate decontamination effectiveness and food‑safety compliance of the final resin. Produced at Trinseo’s Schkopau facility and containing approximately 30% recycled content, the new rPS resin offers a carbon footprint reduction of about 18% compared to virgin polystyrene . For Trinseo, this development represents a strategic sustainability advancement, enabling the company to meet growing demand for circular material solutions and support its customers’ recycled content targets
SKU-

- Interactive Data Analysis Dashboard
- Company Analysis Dashboard for high growth potential opportunities
- Research Analyst Access for customization & queries
- Competitor Analysis with Interactive dashboard
- Latest News, Updates & Trend analysis
- Harness the Power of Benchmark Analysis for Comprehensive Competitor Tracking
Table of Content
1 INTRODUCTION
1.1 OBJECTIVES OF THE STUDY
1.2 MARKET DEFINITION
1.3 OVERVIEW
1.4 LIMITATIONS
1.5 MARKETS COVERED
2 MARKET SEGMENTATION
2.1 MARKETS COVERED
2.2 GEOGRAPHICAL SCOPE
2.3 YEARS CONSIDERED FOR THE STUDY
2.4 CURRENCY AND PRICING
2.5 DBMR TRIPOD DATA VALIDATION MODEL
2.6 MULTIVARIATE MODELING
2.7 PRIMARY INTERVIEWS WITH KEY OPINION LEADERS
2.8 DBMR MARKET POSITION GRID
2.9 MARKET APPLICATION COVERAGE GRID
2.1 SECONDARY SOURCES
2.11 ASSUMPTIONS
3 EXECUTIVE SUMMARY
4 PREMIUM INSIGHTS
4.1 PORTER’S FIVE FORCES ANALYSIS
4.1.1 THREAT OF NEW ENTRANTS
4.1.2 BARGAINING POWER OF SUPPLIERS
4.1.3 BARGAINING POWER OF BUYERS
4.1.4 THREAT OF SUBSTITUTES
4.1.5 INTERNAL COMPETITION
4.2 INNOVATION TRACKER AND STRATEGIC ANALYSIS
4.2.1 MAJOR DEALS AND STRATEGIC ALLIANCES ANALYSIS
4.2.1.1 JOINT VENTURES
4.2.1.2 MERGERS AND ACQUISITIONS
4.2.1.3 LICENSING AND PARTNERSHIP
4.2.1.4 TECHNOLOGY COLLABORATIONS
4.2.1.5 STRATEGIC DIVESTMENTS
4.2.2 NUMBER OF PRODUCTS IN DEVELOPMENT
4.2.3 STAGE OF DEVELOPMENT
4.2.4 TIMELINES AND MILESTONES
4.2.5 INNOVATION STRATEGIES AND METHODOLOGIES
4.2.6 RISK ASSESSMENT AND MITIGATION
4.2.7 FUTURE OUTLOOK
4.3 VALUE CHAIN ANALYSIS
4.4 IMPORT EXPORT SCENARIO
4.5 PRODUCTION CAPACITY FOR TOP MANUFACTURERS
4.6 BRAND OUTLOOK
4.7 CONSUMER BUYING BEHAVIOUR
4.8 DATA BASE OF COMPOUNDERS & THE EQUIPMENT THEY HAVE IN USE
4.9 PATENT ANALYSIS
4.9.1 PATENT QUALITY AND STRENGTH
4.9.2 PATENT FAMILIES
4.9.3 LICENSING AND COLLABORATIONS
4.9.4 REGION PATENT LANDSCAPE
4.9.5 IP STRATEGY AND MANAGEMENT
4.1 RAW MATERIAL COVERAGE
4.11 SUPPLY CHAIN ANALYSIS OF THE NORTH AMERICA PLASTIC COMPOUNDING MARKET
4.11.1 OVERVIEW
4.11.2 LOGISTIC COST SCENARIOS
4.11.3 IMPORTANCE OF LOGISTICS SERVICE PROVIDERS (LSPS)
4.12 TECHNOLOGICAL ADVANCEMENTS IN THE NORTH AMERICA PLASTIC COMPOUNDING MARKET
4.12.1 AI AND DIGITAL PROCESS OPTIMIZATION
4.12.2 ADVANCED EXTRUSION AND MATERIAL HANDLING TECHNOLOGIES
4.12.3 BIO-BASED AND FUNCTIONALIZED POLYMER COMPOUNDS
4.12.4 SMART AND RESPONSIVE COMPOUNDING SOLUTIONS
4.12.5 AUTOMATION AND INDUSTRY 4.0 IN COMPOUNDING OPERATIONS
4.12.6 SUSTAINABILITY AND CIRCULAR ECONOMY INNOVATIONS
4.12.7 DIGITAL CUSTOMER ENGAGEMENT AND FORMULATION PLATFORMS
4.13 VENDOR SELECTION CRITERIA
4.14 COMPANY EVALUATION QUADRANT
4.15 PRICING ANALYSIS
5 ROLE OF TARIFFS IN THE NORTH AMERICA PLASTIC COMPOUNDING MARKET
5.1 TARIFF LANDSCAPE: DUTIES ON POLYMERS, ADDITIVES, AND MACHINERY
5.2 IMPACT OF TARIFFS ON COST STRUCTURES AND SUPPLY CHAIN DYNAMICS
5.3 INFLUENCE OF TRADE AGREEMENTS AND REGULATORY POLICIES
5.4 MARKET TRENDS AMPLIFYING TARIFF IMPACTS
5.5 COMPETITIVE IMPLICATIONS FOR INDUSTRY PARTICIPANTS
5.6 CHALLENGES AND OPPORTUNITIES ARISING FROM TARIFFS
5.7 KEY COMPANIES AND TARIFF STRATEGY SNAPSHOT
6 REGULATION COVERAGE: NORTH AMERICA PLASTIC COMPOUNDING MARKET
7 MARKET OVERVIEW
7.1 DRIVERS
7.1.1 SHIFT TOWARDS RECYCLABLE AND BIODEGRADABLE PLASTIC COMPOUNDS DUE TO ENVIRONMENTAL REGULATIONS
7.1.2 ADVANCEMENTS IN COMPOUNDING TECHNOLOGIES IMPROVING PRODUCT PERFORMANCE AND COST-EFFICIENCY
7.1.3 DEVELOPMENT OF NANOCOMPOSITE PLASTICS OFFERING SUPERIOR MECHANICAL AND BARRIER PROPERTIES
7.1.4 INCREASED USE OF COMPOUNDED PLASTICS IN MEDICAL DEVICES DUE TO BIOCOMPATIBILITY AND STERILIZATION COMPATIBILITY
7.2 RESTRAINTS
7.2.1 VOLATILITY IN RAW MATERIAL PRICES, ESPECIALLY PETROLEUM-BASED FEEDSTOCKS LIKE POLYPROPYLENE AND POLYETHYLENE
7.2.2 COMPLEX RECYCLING PROCESSES AND LACK OF PROPER INFRASTRUCTURE FOR PLASTIC COMPOUND WASTE MANAGEMENT
7.3 OPPORTUNITIES
7.3.1 GROWING USE OF BIOPLASTICS AND SUSTAINABLE COMPOUND ALTERNATIVES
7.3.2 SURGE IN ELECTRIC VEHICLE ADOPTION REQUIRING ADVANCED POLYMERS
7.3.3 INCREASING DEMAND FOR RECYCLABLE AND CIRCULAR PLASTIC SOLUTIONS
7.4 CHALLENGES
7.4.1 PERFORMANCE LIMITATIONS OF SUSTAINABLE ALTERNATIVES
7.4.2 REGULATORY AND STANDARDS FRAGMENTATION ACROSS REGIONS
8 NORTH AMERICA PLASTIC COMPOUNDING MARKET, BY POLYMER TYPE
8.1 OVERVIEW
8.2 THERMOPLASTICS
8.2.1 THERMOPLASTICS, BY TYPE
8.2.2 POLYETHYLENE (PE), BY TYPE
8.3 ENGINEERING PLASTICS
8.3.1 ENGINEERING PLASTICS, BY TYPE
8.4 THERMOSETTING PLASTICS
8.4.1 THERMOSETTING PLASTICS, BY TYPE
8.5 BIOPLASTICS
8.5.1 BIOPLASTICS, BY TYPE
8.6 OTHERS
9 NORTH AMERICA PLASTIC COMPOUNDING MARKET, BY FILLER TYPE
9.1 OVERVIEW
9.2 MINERAL FILLERS
9.2.1 MINERAL FILLERS, BY TYPE
9.3 REINFORCEMENTS
9.3.1 REINFORCEMENTS, BY TYPE
9.4 ADDITIVES
9.4.1 ADDITIVES, BY TYPE
9.5 OTHERS
10 NORTH AMERICA PLASTIC COMPOUNDING MARKET, BY MANUFACTURING PROCESS
10.1 OVERVIEW
10.2 EXTRUSION
10.2.1 EXTRUSION, BY TYPE
10.2.2 EXTRUSION, BY PELLETIZING SYSTEM
10.3 INJECTION MOLDING BASED COMPOUNDING
10.3.1 INJECTION MOLDING BASED COMPOUNDING, BY PELLETIZING SYSTEM
10.4 COMPACTION/PRESSING
10.4.1 COMPACTION/PRESSING, BY PELLETIZING SYSTEM
10.5 KNEADER/BANBURY MIXING
10.5.1 KNEADER/BANBURY MIXING, BY PELLETIZING SYSTEM
10.6 OTHERS
11 NORTH AMERICA PLASTIC COMPOUNDING MARKET, BY PROPERTIES
11.1 OVERVIEW
11.2 RESISTANCE
11.3 DURABILITY
11.4 FLEXIBILITY
11.5 IMPACT RESISTANCE
11.6 RIGIDITY
11.7 OTHERS
12 NORTH AMERICA PLASTIC COMPOUNDING MARKET, BY APPLICATION
12.1 OVERVIEW
12.2 AUTOMOTIVE
12.2.1 AUTOMOTIVE, BY CATEGORY
12.2.1.1 INTERIOR COMPONENTS, BY TYPE
12.2.1.2 EXTERIOR BODY PARTS, BY TYPE
12.2.1.3 UNDER-THE-HOOD APPLICATIONS, BY TYPE
12.3 PACKAGING
12.3.1 PACKAGING, BY CATEGORY
12.3.1.1 FOOD & BEVERAGE PACKAGING, BY TYPE
12.3.1.2 INDUSTRIAL PACKAGING, BY TYPE
12.3.1.3 CONSUMER GOODS PACKAGING, BY TYPE
12.4 BUILDING & CONSTRUCTION
12.4.1 BUILDING & CONSTRUCTION, BY CATEGORY
12.5 ELECTRICAL & ELECTRONICS
12.5.1 ELECTRICAL & ELECTRONICS, BY CATEGORY
12.6 MEDICAL DEVICES
12.6.1 MEDICAL DEVICES, BY CATEGORY
12.7 FURNITURE
12.7.1 FURNITURE, BY CATEGORY
12.8 ENERGY AND POWER
12.8.1 ENERGY & POWER, BY CATEGORY
12.9 AEROSPACE AND DEFENSE
12.9.1 AEROSPACE AND DEFENSE, BY CATEGORY
12.1 OTHERS
13 NORTH AMERICA PLASTIC COMPOUNDING MARKET BY COUNTRIES
13.1 NORTH AMERICA
13.1.1 U.S.
13.1.2 CANADA
13.1.3 MEXICO
14 NORTH AMERICA PLASTIC COMPOUNDING MARKET: COMPANY LANDSCAPE
14.1 COMPANY SHARE ANALYSIS: NORTH AMERICA
15 SWOT ANALYSIS
16 COMPANY PROFILES
16.1 SABIC
16.1.1 COMPANY SNAPSHOT
16.1.2 REVENUE ANALYSIS
16.1.3 COMPANY SHARE ANALYSIS
16.1.4 PRODUCT PORTFOLIO
16.1.5 RECENT DEVELOPMENT
16.2 LYONDELLBASELL INDUSTRIES HOLDINGS B.V.
16.2.1 COMPANY SNAPSHOT
16.2.2 REVENUE ANALYSIS
16.2.3 COMPANY SHARE ANALYSIS
16.2.4 PRODUCT PORTFOLIO
16.2.5 RECENT DEVELOPMENTS/NEWS
16.3 DOW
16.3.1 COMPANY SNAPSHOT
16.3.2 REVENUE ANALYSIS
16.3.3 COMPANY SHARE ANALYSIS
16.3.4 PRODUCT PORTFOLIO
16.3.5 RECENT DEVELOPMENT
16.4 DUPONT
16.4.1 COMPANY SNAPSHOT
16.4.2 REVENUE ANALYSIS
16.4.3 COMPANY SHARE ANALYSIS
16.4.4 PRODUCT PORTFOLIO
16.4.5 RECENT DEVELOPMENT
16.5 ARKEMA
16.5.1 COMPANY SNAPSHOT
16.5.2 REVENUE ANALYSIS
16.5.3 COMPANY SHARE ANALYSIS
16.5.4 PRODUCT PORTFOLIO
16.5.5 RECENT DEVELOPMENTS
16.6 ASAHI KASEI CORP.
16.6.1 COMPANY SNAPSHOT
16.6.2 REVENUE ANALYSIS
16.6.3 PRODUCT PORTFOLIO
16.6.4 RECENT DEVELOPMENT
16.7 AVIENT CORPORATION
16.7.1 COMPANY SNAPSHOT
16.7.2 REVENUE ANALYSIS
16.7.3 PRODUCT PORTFOLIO
16.7.4 RECENT DEVELOPMENT
16.8 BOREALIS GMBH
16.8.1 COMPANY SNAPSHOT
16.8.2 PRODUCT PORTFOLIO
16.8.3 RECENT DEVELOPMENT
16.9 BASF
16.9.1 COMPANY SNAPSHOT
16.9.2 REVENUE ANALYSIS
16.9.3 PRODUCT PORTFOLIO
16.9.4 RECENT DEVELOPMENT
16.1 CLEANESE CORPORATION
16.10.1 COMPANY SNAPSHOT
16.10.2 REVENUE ANALYSIS
16.10.3 PRODUCT PORTFOLIO
16.10.4 RECENT DEVELOPMENT
16.11 CHIMEI
16.11.1 COMPANY SNAPSHOT
16.11.2 REVENUE ANALYSIS
16.11.3 PRODUCT PORTFOLIO
16.11.4 RECENT DEVELOPMENT
16.12 CLARIANT
16.12.1 COMPANY SNAPSHOT
16.12.2 REVENUE ANALYSIS
16.12.3 PRODUCT PORTFOLIO
16.12.4 RECENT DEVELOPMENT
16.13 COVESTRO AG
16.13.1 COMPANY SNAPSHOT
16.13.2 REVENUE ANALYSIS
16.13.3 PRODUCT PORTFOLIO
16.13.4 RECENT DEVELOPMENT
16.14 DAICEL CORPORATION
16.14.1 COMPANY SNAPSHOT
16.14.2 REVENUE ANALYSIS
16.14.3 PRODUCT PORTFOLIO
16.14.4 RECENT DEVELOPMENTS
16.15 ENSINGER GMBH
16.15.1 COMPANY SNAPSHOT
16.15.2 PRODUCT PORTFOLIO
16.15.3 RECENT DEVELOPMENT
16.16 ENVALIOR
16.16.1 COMPANY SNAPSHOT
16.16.2 PRODUCT PORTFOLIO
16.16.3 RECENT DEVELOPMENTS
16.17 INEOS
16.17.1 COMPANY SNAPSHOT
16.17.2 PRODUCT PORTFOLIO
16.17.3 RECENT DEVELOPMENT
16.18 KANEKA CORPORATION
16.18.1 COMPANY SNAPSHOT
16.18.2 REVENUE ANALYSIS
16.18.3 PRODUCT PORTFOLIO
16.18.4 RECENT DEVELOPMENT
16.19 KINGFA SCI.&TECH. CO.,LTD.
16.19.1 COMPANY SNAPSHOT
16.19.2 REVENUE ANALYSIS
16.19.3 PRODUCT PORTFOLIO
16.19.4 RECENT DEVELOPMENT
16.2 LANXESS
16.20.1 COMPANY SNAPSHOT
16.20.2 REVENUE ANALYSIS
16.20.3 BUSINESS PORTFOLIO
16.20.4 RECENT DEVELOPMENT
16.21 LG CHEM
16.21.1 COMPANY SNAPSHOT
16.21.2 REVENUE ANALYSIS
16.21.3 PRODUCT PORTFOLIO
16.21.4 RECENT DEVELOPMENT
16.22 MITSUBISHI CHEMICAL GROUP CORPORATION.
16.22.1 COMPANY SNAPSHOT
16.22.2 REVENUE ANALYSIS
16.22.3 PRODUCT PORTFOLIO
16.22.4 RECENT DEVELOPMENT
16.23 MITSUI CHEMICALS, INC
16.23.1 COMPANY SNAPSHOT
16.23.2 REVENUE ANALYSIS
16.23.3 PRODUCT PORTFOLIO
16.23.4 RECENT DEVELOPMENT
16.24 RTP COMPANY
16.24.1 COMPANY SNAPSHOT
16.24.2 PRODUCT PORTFOLIO
16.24.3 RECENT DEVELOPMENT
16.25 SCG
16.25.1 COMPANY SNAPSHOT
16.25.2 REVENUE ANALYSIS
16.25.3 PRODUCT PORTFOLIO
16.25.4 RECENT DEVELOPMENT
16.26 SYENSQO
16.26.1 COMPANY SNAPSHOT
16.26.2 REVENUE ANALYSIS
16.26.3 PRODUCT PORTFOLIO
16.26.4 RECENT DEVELOPMENTS
16.27 TEKNOR APEX
16.27.1 COMPANY SNAPSHOT
16.27.2 PRODUCT PORTFOLIO
16.27.3 RECENT DEVELOPMENT
16.28 TORAY INDUSTRIES, INC.
16.28.1 COMPANY SNAPSHOT
16.28.2 REVENUE ANALYSIS
16.28.3 PRODUCT PORTFOLIO
16.28.4 RECENT DEVELOPMENT
16.29 TRINSEO
16.29.1 COMPANY SNAPSHOT
16.29.2 REVENUE ANALYSIS
16.29.3 SOLUTION PORTFOLIO
16.29.4 RECENT DEVELOPMENTS
16.3 WASHINGTON PENN
16.30.1 COMPANY SNAPSHOT
16.30.2 PRODUCT PORTFOLIO
16.30.3 RECENT DEVELOPMENT
17 QUESTIONNAIRE
18 RELATED REPORTS
List of Table
TABLE 1 STAGES OF VALUE CHAIN
TABLE 2 BRAND OUTLOOK: NORTH AMERICA PLASTIC COMPOUNDING MARKET
TABLE 3 CONSUMER BUYING BEHAVIOUR
TABLE 4 NORTH AMERICA PLAYERS IN PLASTIC COMPOUNDING
TABLE 5 NUMBER OF PATENTS PER YEAR
TABLE 6 NUMBER OF PATENTS PER REGION/COUNTRY
TABLE 7 TOP PATENT APPLICANTS
TABLE 8 TARIFF EXPOSURE AND STRATEGIC RESPONSE BY COMPANY TYPE
TABLE 9 TARIFF EXPOSURE AND STRATEGIC RESPONSE OF KEY PLAYERS
TABLE 10 NORTH AMERICA PLASTIC COMPOUNDING MARKET, BY POLYMER TYPE, 2018-2032 (USD THOUSAND)
TABLE 11 NORTH AMERICA PLASTIC COMPOUNDING MARKET, BY POLYMER TYPE, 2018-2032 (KILO TONS)
TABLE 12 NORTH AMERICA THERMOPLASTICS IN PLASTIC COMPOUNDING MARKET, BY REGION, 2018-2032 (USD THOUSAND)
TABLE 13 NORTH AMERICA THERMOPLASTICS IN PLASTIC COMPOUNDING MARKET, BY REGION, 2018-2032 (KILO TONS)
TABLE 14 NORTH AMERICA THERMOPLASTICS IN PLASTIC COMPOUNDING MARKET, BY TYPE, 2018-2032 (USD THOUSAND)
TABLE 15 NORTH AMERICA POLYETHYLENE (PE) IN PLASTIC COMPOUNDING MARKET, BY TYPE, 2018-2032 (USD THOUSAND)
TABLE 16 NORTH AMERICA ENGINEERING PLASTICS IN PLASTIC COMPOUNDING MARKET, BY REGION, 2018-2032 (USD THOUSAND )
TABLE 17 NORTH AMERICA ENGINEERING PLASTICS IN PLASTIC COMPOUNDING MARKET, BY REGION, 2018-2032 (KILO TONS)
TABLE 18 NORTH AMERICA ENGINEERING PLASTICS IN PLASTIC COMPOUNDING MARKET, BY TYPE, 2018-2032 (USD THOUSAND)
TABLE 19 NORTH AMERICA THERMOSETTING PLASTICS IN PLASTIC COMPOUNDING MARKET, BY REGION, 2018-2032 (USD THOUSAND)
TABLE 20 NORTH AMERICA THERMOSETTING PLASTICS IN PLASTIC COMPOUNDING MARKET, BY REGION, 2018-2032 (KILO TONS)
TABLE 21 NORTH AMERICA THERMOSETTING PLASTICS IN PLASTIC COMPOUNDING MARKET, BY TYPE, 2018-2032 (USD THOUSAND)
TABLE 22 NORTH AMERICA BIOPLASTICS IN PLASTIC COMPOUNDING MARKET, BY REGION, 2018-2032 (USD THOUSAND)
TABLE 23 NORTH AMERICA BIOPLASTICS IN PLASTIC COMPOUNDING MARKET, BY REGION, 2018-2032 (KILO TONS)
TABLE 24 NORTH AMERICA BIOPLASTICS IN PLASTIC COMPOUNDING MARKET, BY TYPE, 2018-2032 (USD THOUSAND)
TABLE 25 NORTH AMERICA OTHERS IN PLASTIC COMPOUNDING MARKET, BY REGION, 2018-2032 (USD THOUSAND)
TABLE 26 NORTH AMERICA OTHERS IN PLASTIC COMPOUNDING MARKET, BY REGION, 2018-2032 (KILO TONS)
TABLE 27 NORTH AMERICA PLASTIC COMPOUNDING MARKET, BY FILTER TYPE, 2018-2032 (USD THOUSAND)
TABLE 28 NORTH AMERICA MINERAL FILLERS IN PLASTIC COMPOUNDING MARKET, BY REGION, 2018-2032 (USD THOUSAND)
TABLE 29 NORTH AMERICA MINERAL FILLERS IN PLASTIC COMPOUNDING MARKET, BY TYPE, 2018-2032 (USD THOUSAND)
TABLE 30 NORTH AMERICA REINFORCEMENTS IN PLASTIC COMPOUNDING MARKET, BY REGION, 2018-2032 (USD THOUSAND)
TABLE 31 NORTH AMERICA REINFORCEMENTS IN PLASTIC COMPOUNDING MARKET, BY TYPE, 2018-2032 (USD THOUSAND)
TABLE 32 NORTH AMERICA ADDITIVES IN PLASTIC COMPOUNDING MARKET, BY REGION, 2018-2032 (USD THOUSAND)
TABLE 33 NORTH AMERICA ADDITIVES IN PLASTIC COMPOUNDING MARKET, BY TYPE, 2018-2032 (USD THOUSAND)
TABLE 34 NORTH AMERICA OTHERS IN PLASTIC COMPOUNDING MARKET, BY REGION, 2018-2032 (USD THOUSAND)
TABLE 35 NORTH AMERICA PLASTIC COMPOUNDING MARKET, BY MANUFACTURING PROCESS, 2018-2032 (USD THOUSAND)
TABLE 36 NORTH AMERICA PLASTIC COMPOUNDING MARKET, BY MANUFACTURING PROCESS, 2018-2032 (KILO TONS)
TABLE 37 NORTH AMERICA EXTRUSION IN PLASTIC COMPOUNDING MARKET, BY REGION, 2018-2032 (USD THOUSAND)
TABLE 38 NORTH AMERICA EXTRUSION IN PLASTIC COMPOUNDING MARKET, BY REGION, 2018-2032 (KILO TONS)
TABLE 39 NORTH AMERICA EXTRUSION IN PLASTIC COMPOUNDING MARKET, BY TYPE, 2018-2032 (USD THOUSAND)
TABLE 40 NORTH AMERICA EXTRUSION IN PLASTIC COMPOUNDING MARKET, BY PELLETIZING SYSTEM, 2018-2032 (USD THOUSAND)
TABLE 41 NORTH AMERICA INJECTION MOLDING BASED COMPOUNDING IN PLASTIC COMPOUNDING MARKET, BY REGION, 2018-2032 (USD THOUSAND)
TABLE 42 NORTH AMERICA INJECTION MOLDING BASED COMPOUNDING IN PLASTIC COMPOUNDING MARKET, BY REGION, 2018-2032 (KILO TONS)
TABLE 43 NORTH AMERICA INJECTION MOLDING BASED COMPOUNDING IN PLASTIC COMPOUNDING MARKET, BY PELLETIZING SYSTEM, 2018-2032 (USD THOUSAND)
TABLE 44 NORTH AMERICA COMPACTION/PRESSING IN PLASTIC COMPOUNDING MARKET, BY REGION, 2018-2032 (USD THOUSAND)
TABLE 45 NORTH AMERICA COMPACTION/PRESSING IN PLASTIC COMPOUNDING MARKET, BY REGION, 2018-2032 (KILO TONS)
TABLE 46 NORTH AMERICA COMPACTION/PRESSING IN PLASTIC COMPOUNDING MARKET, BY PELLETIZING SYSTEM, 2018-2032 (USD THOUSAND)
TABLE 47 NORTH AMERICA KNEADER/BANBURY MIXING IN PLASTIC COMPOUNDING MARKET, BY REGION, 2018-2032 (USD THOUSAND)
TABLE 48 NORTH AMERICA KNEADER/BANBURY MIXING IN PLASTIC COMPOUNDING MARKET, BY REGION, 2018-2032 (KILO TONS)
TABLE 49 NORTH AMERICA KNEADER/BANBURY MIXING IN PLASTIC COMPOUNDING MARKET, BY PELLETIZING SYSTEM, 2018-2032 (USD THOUSAND)
TABLE 50 NORTH AMERICA OTHERS IN PLASTIC COMPOUNDING MARKET, BY REGION, 2018-2032 (USD THOUSAND)
TABLE 51 NORTH AMERICA OTHERS IN PLASTIC COMPOUNDING MARKET, BY REGION, 2018-2032 (KILO TONS)
TABLE 52 NORTH AMERICA PLASTIC COMPOUNDING MARKET, BY PROPERTIES, 2018-2032 (USD THOUSAND)
TABLE 53 NORTH AMERICA RESISTANCE IN PLASTIC COMPOUNDING MARKET, BY REGION, 2018-2032 (USD THOUSAND)
TABLE 54 NORTH AMERICA DURABILITY IN PLASTIC COMPOUNDING MARKET, BY REGION, 2018-2032 (USD THOUSAND)
TABLE 55 NORTH AMERICA FLEXIBILITY IN PLASTIC COMPOUNDING MARKET, BY REGION, 2018-2032 (USD THOUSAND)
TABLE 56 NORTH AMERICA IMPACT RESISTANCE IN PLASTIC COMPOUNDING MARKET, BY REGION, 2018-2032 (USD THOUSAND)
TABLE 57 NORTH AMERICA RIGIDITY IN PLASTIC COMPOUNDING MARKET, BY REGION, 2018-2032 (USD THOUSAND)
TABLE 58 NORTH AMERICA OTHERS IN PLASTIC COMPOUNDING MARKET, BY REGION, 2018-2032 (USD THOUSAND)
TABLE 59 NORTH AMERICA PLASTIC COMPOUNDING MARKET, BY APPLICATION, 2018-2032 (USD THOUSAND)
TABLE 60 NORTH AMERICA PLASTIC COMPOUNDING MARKET, BY APPLICATION, 2018-2032 (KILO TONS)
TABLE 61 NORTH AMERICA AUTOMOTIVE IN PLASTIC COMPOUNDING MARKET, BY REGION, 2018-2032 (USD THOUSAND)
TABLE 62 NORTH AMERICA AUTOMOTIVE IN PLASTIC COMPOUNDING MARKET, BY REGION, 2018-2032 (KILO TONS)
TABLE 63 NORTH AMERICA AUTOMOTIVE IN PLASTIC COMPOUNDING MARKET, BY CATEGORY, 2018-2032 (USD THOUSAND)
TABLE 64 NORTH AMERICA INTERIOR COMPONENTS IN PLASTIC COMPOUNDING MARKET, BY TYPE, 2018-2032 (USD THOUSAND)
TABLE 65 NORTH AMERICA EXTERIOR BODY PARTS IN PLASTIC COMPOUNDING MARKET, BY TYPE, 2018-2032 (USD THOUSAND)
TABLE 66 NORTH AMERICA UNDER-THE-HOOD APPLICATIONS IN PLASTIC COMPOUNDING MARKET, BY TYPE, 2018-2032 (USD THOUSAND)
TABLE 67 NORTH AMERICA PACKAGING IN PLASTIC COMPOUNDING MARKET, BY REGION, 2018-2032 (USD THOUSAND)
TABLE 68 NORTH AMERICA PACKAGING IN PLASTIC COMPOUNDING MARKET, BY REGION, 2018-2032 (KILO TONS)
TABLE 69 NORTH AMERICA PACKAGING IN PLASTIC COMPOUNDING MARKET, BY CATEGORY, 2018-2032 (USD THOUSAND)
TABLE 70 NORTH AMERICA FOOD & BEVERAGE PACKAGING IN PLASTIC COMPOUNDING MARKET, BY TYPE, 2018-2032 (USD THOUSAND)
TABLE 71 NORTH AMERICA INDUSTRIAL PACKAGING IN PLASTIC COMPOUNDING MARKET, BY TYPE, 2018-2032 (USD THOUSAND)
TABLE 72 NORTH AMERICA CONSUMER GOODS PACKAGING IN PLASTIC COMPOUNDING MARKET, BY TYPE, 2018-2032 (USD THOUSAND)
TABLE 73 NORTH AMERICA BUILDING & CONSTRUCTION IN PLASTIC COMPOUNDING MARKET, BY REGION, 2018-2032 (USD THOUSAND)
TABLE 74 NORTH AMERICA BUILDING & CONSTRUCTION IN PLASTIC COMPOUNDING MARKET, BY REGION, 2018-2032 (KILO TONS)
TABLE 75 NORTH AMERICA BUILDING & CONSTRUCTION IN PLASTIC COMPOUNDING MARKET, BY CATEGORY, 2018-2032 (USD THOUSAND)
TABLE 76 NORTH AMERICA ELECTRICAL & ELECTRONICS IN PLASTIC COMPOUNDING MARKET, BY REGION, 2018-2032 (USD THOUSAND)
TABLE 77 NORTH AMERICA ELECTRICAL & ELECTRONICS IN PLASTIC COMPOUNDING MARKET, BY REGION, 2018-2032 (KILO TONS)
TABLE 78 NORTH AMERICA ELECTRICAL & ELECTRONICS IN PLASTIC COMPOUNDING MARKET, BY CATEGORY, 2018-2032 (USD THOUSAND)
TABLE 79 NORTH AMERICA MEDICAL DEVICES IN PLASTIC COMPOUNDING MARKET, BY REGION, 2018-2032 (USD THOUSAND)
TABLE 80 NORTH AMERICA MEDICAL DEVICES IN PLASTIC COMPOUNDING MARKET, BY REGION, 2018-2032 (KILO TONS)
TABLE 81 NORTH AMERICA MEDICAL DEVICES IN PLASTIC COMPOUNDING MARKET, BY CATEGORY, 2018-2032 (USD THOUSAND)
TABLE 82 NORTH AMERICA FURNITURE IN PLASTIC COMPOUNDING MARKET, BY REGION, 2018-2032 (USD THOUSAND)
TABLE 83 NORTH AMERICA FURNITURE IN PLASTIC COMPOUNDING MARKET, BY REGION, 2018-2032 (KILO TONS)
TABLE 84 NORTH AMERICA FURNITURE IN PLASTIC COMPOUNDING MARKET, BY CATEGORY, 2018-2032 (USD THOUSAND)
TABLE 85 NORTH AMERICA ENERGY AND POWER IN PLASTIC COMPOUNDING MARKET, BY REGION, 2018-2032 (USD THOUSAND)
TABLE 86 NORTH AMERICA ENERGY AND POWER IN PLASTIC COMPOUNDING MARKET, BY REGION, 2018-2032 (KILO TONS)
TABLE 87 NORTH AMERICA ENERGY AND POWER IN PLASTIC COMPOUNDING MARKET, BY CATEGORY, 2018-2032 (USD THOUSAND)
TABLE 88 NORTH AMERICA AEROSPACE AND DEFENSE IN PLASTIC COMPOUNDING MARKET, BY REGION, 2018-2032 (USD THOUSAND)
TABLE 89 NORTH AMERICA AEROSPACE AND DEFENSE IN PLASTIC COMPOUNDING MARKET, BY REGION, 2018-2032 (KILO TONS)
TABLE 90 NORTH AMERICA AEROSPACE AND DEFENSE IN PLASTIC COMPOUNDING MARKET, BY CATEGORY, 2018-2032 (USD THOUSAND)
TABLE 91 NORTH AMERICA OTHERS IN PLASTIC COMPOUNDING MARKET, BY REGION, 2018-2032 (USD THOUSAND)
TABLE 92 NORTH AMERICA OTHERS IN PLASTIC COMPOUNDING MARKET, BY REGION, 2018-2032 (KILO TONS)
TABLE 93 NORTH AMERICA PLASTIC COMPOUNDING MARKET, BY COUNTRY, 2018-2032 (USD THOUSAND)
TABLE 94 NORTH AMERICA PLASTIC COMPOUNDING MARKET, BY COUNTRY, 2018-2032 (KILO TONS)
TABLE 95 NORTH AMERICA PLASTIC COMPOUNDING MARKET, BY POLYMER TYPE, 2018-2032 (USD THOUSAND)
TABLE 96 NORTH AMERICA PLASTIC COMPOUNDING MARKET, BY POLYMER TYPE, 2018-2032 (KILO TONS)
TABLE 97 NORTH AMERICA THERMOPLASTICS IN PLASTIC COMPOUNDING MARKET, BY TYPE, 2018-2032 (USD THOUSAND)
TABLE 98 NORTH AMERICA POLYETHYLENE (PE) IN PLASTIC COMPOUNDING MARKET, BY TYPE, 2018-2032 (USD THOUSAND)
TABLE 99 NORTH AMERICA ENGINEERING PLASTICS IN PLASTIC COMPOUNDING MARKET, BY TYPE, 2018-2032 (USD THOUSAND)
TABLE 100 NORTH AMERICA THERMOSETTING PLASTICS IN PLASTIC COMPOUNDING MARKET, BY TYPE, 2018-2032 (USD THOUSAND)
TABLE 101 NORTH AMERICA BIOPLASTICS IN PLASTIC COMPOUNDING MARKET, BY TYPE, 2018-2032 (USD THOUSAND)
TABLE 102 NORTH AMERICA PLASTIC COMPOUNDING MARKET, BY FILLER TYPE, 2018-2032 (USD THOUSAND)
TABLE 103 NORTH AMERICA MINERAL FILLERS IN PLASTIC COMPOUNDING MARKET, BY TYPE, 2018-2032 (USD THOUSAND)
TABLE 104 NORTH AMERICA REINFORCEMENTS IN PLASTIC COMPOUNDING MARKET, BY TYPE, 2018-2032 (USD THOUSAND)
TABLE 105 NORTH AMERICA ADDITIVES IN PLASTIC COMPOUNDING MARKET, BY TYPE, 2018-2032 (USD THOUSAND)
TABLE 106 NORTH AMERICA PLASTIC COMPOUNDING MARKET, BY MANUFACTURING PROCESS, 2018-2032 (USD THOUSAND)
TABLE 107 NORTH AMERICA PLASTIC COMPOUNDING MARKET, BY MANUFACTURING PROCESS, 2018-2032 (KILO TONS)
TABLE 108 NORTH AMERICA EXTRUSION IN PLASTIC COMPOUNDING MARKET, BY TYPE, 2018-2032 (USD THOUSAND)
TABLE 109 NORTH AMERICA EXTRUSION IN PLASTIC COMPOUNDING MARKET, BY PELLETIZING SYSTEM, 2018-2032 (USD THOUSAND)
TABLE 110 NORTH AMERICA INJECTION MOLDING BASED COMPOUNDING IN PLASTIC COMPOUNDING MARKET, BY PELLETIZING SYSTEM, 2018-2032 (USD THOUSAND)
TABLE 111 NORTH AMERICA COMPACTION/PRESSING IN PLASTIC COMPOUNDING MARKET, BY PELLETIZING SYSTEM, 2018-2032 (USD THOUSAND)
TABLE 112 NORTH AMERICA KNEADER/BANBURY MIXING IN PLASTIC COMPOUNDING MARKET, BY PELLETIZING SYSTEM, 2018-2032 (USD THOUSAND)
TABLE 113 NORTH AMERICA PLASTIC COMPOUNDING MARKET, BY PROPERTIES, 2018-2032 (USD THOUSAND)
TABLE 114 NORTH AMERICA PLASTIC COMPOUNDING MARKET, BY APPLICATION, 2018-2032 (USD THOUSAND)
TABLE 115 NORTH AMERICA PLASTIC COMPOUNDING MARKET, BY APPLICATION, 2018-2032 (KILO TONS)
TABLE 116 NORTH AMERICA AUTOMOTIVE IN PLASTIC COMPOUNDING MARKET, BY CATEGORY, 2018-2032 (USD THOUSAND)
TABLE 117 NORTH AMERICA INTERIOR COMPONENTS IN PLASTIC COMPOUNDING MARKET, BY TYPE, 2018-2032 (USD THOUSAND)
TABLE 118 NORTH AMERICA EXTERIOR BODY PARTS IN PLASTIC COMPOUNDING MARKET, BY TYPE, 2018-2032 (USD THOUSAND)
TABLE 119 NORTH AMERICA UNDER-THE-HOOD APPLICATIONS IN PLASTIC COMPOUNDING MARKET, BY TYPE, 2018-2032 (USD THOUSAND)
TABLE 120 NORTH AMERICA PACKAGING IN PLASTIC COMPOUNDING MARKET, BY CATEGORY, 2018-2032 (USD THOUSAND)
TABLE 121 NORTH AMERICA FOOD & BEVERAGE PACKAGING IN PLASTIC COMPOUNDING MARKET, BY TYPE, 2018-2032 (USD THOUSAND)
TABLE 122 NORTH AMERICA INDUSTRIAL PACKAGING IN PLASTIC COMPOUNDING MARKET, BY TYPE, 2018-2032 (USD THOUSAND)
TABLE 123 NORTH AMERICA CONSUMER GOODS PACKAGING IN PLASTIC COMPOUNDING MARKET, BY TYPE, 2018-2032 (USD THOUSAND)
TABLE 124 NORTH AMERICA BUILDING & CONSTRUCTION IN PLASTIC COMPOUNDING MARKET, BY CATEGORY, 2018-2032 (USD THOUSAND)
TABLE 125 NORTH AMERICA ELECTRICAL & ELECTRONICS IN PLASTIC COMPOUNDING MARKET, BY CATEGORY, 2018-2032 (USD THOUSAND)
TABLE 126 NORTH AMERICA MEDICAL DEVICES IN PLASTIC COMPOUNDING MARKET, BY CATEGORY, 2018-2032 (USD THOUSAND)
TABLE 127 NORTH AMERICA FURNITURE IN PLASTIC COMPOUNDING MARKET, BY CATEGORY, 2018-2032 (USD THOUSAND)
TABLE 128 NORTH AMERICA ENERGY AND POWER IN PLASTIC COMPOUNDING MARKET, BY CATEGORY, 2018-2032 (USD THOUSAND)
TABLE 129 NORTH AMERICA AEROSPACE AND DEFENSE IN PLASTIC COMPOUNDING MARKET, BY CATEGORY, 2018-2032 (USD THOUSAND)
TABLE 130 U.S. PLASTIC COMPOUNDING MARKET, BY POLYMER TYPE, 2018-2032 (USD THOUSAND)
TABLE 131 U.S. PLASTIC COMPOUNDING MARKET, BY POLYMER TYPE, 2018-2032 (KILO TONS)
TABLE 132 U.S. THERMOPLASTICS IN PLASTIC COMPOUNDING MARKET, BY TYPE, 2018-2032 (USD THOUSAND)
TABLE 133 U.S. POLYETHYLENE (PE) IN PLASTIC COMPOUNDING MARKET, BY TYPE, 2018-2032 (USD THOUSAND)
TABLE 134 U.S. ENGINEERING PLASTICS IN PLASTIC COMPOUNDING MARKET, BY TYPE, 2018-2032 (USD THOUSAND)
TABLE 135 U.S. THERMOSETTING PLASTICS IN PLASTIC COMPOUNDING MARKET, BY TYPE, 2018-2032 (USD THOUSAND)
TABLE 136 U.S. BIOPLASTICS IN PLASTIC COMPOUNDING MARKET, BY TYPE, 2018-2032 (USD THOUSAND)
TABLE 137 U.S. PLASTIC COMPOUNDING MARKET, BY FILLER TYPE, 2018-2032 (USD THOUSAND)
TABLE 138 U.S. MINERAL FILLERS IN PLASTIC COMPOUNDING MARKET, BY TYPE, 2018-2032 (USD THOUSAND)
TABLE 139 U.S. REINFORCEMENTS IN PLASTIC COMPOUNDING MARKET, BY TYPE, 2018-2032 (USD THOUSAND)
TABLE 140 U.S. ADDITIVES IN PLASTIC COMPOUNDING MARKET, BY TYPE, 2018-2032 (USD THOUSAND)
TABLE 141 U.S. PLASTIC COMPOUNDING MARKET, BY MANUFACTURING PROCESS, 2018-2032 (USD THOUSAND)
TABLE 142 U.S. PLASTIC COMPOUNDING MARKET, BY MANUFACTURING PROCESS, 2018-2032 (KILO TONS)
TABLE 143 U.S. EXTRUSION IN PLASTIC COMPOUNDING MARKET, BY TYPE, 2018-2032 (USD THOUSAND)
TABLE 144 U.S. EXTRUSION IN PLASTIC COMPOUNDING MARKET, BY PELLETIZING SYSTEM, 2018-2032 (USD THOUSAND)
TABLE 145 U.S. INJECTION MOLDING BASED COMPOUNDING IN PLASTIC COMPOUNDING MARKET, BY PELLETIZING SYSTEM, 2018-2032 (USD THOUSAND)
TABLE 146 U.S. COMPACTION/PRESSING IN PLASTIC COMPOUNDING MARKET, BY PELLETIZING SYSTEM, 2018-2032 (USD THOUSAND)
TABLE 147 U.S. KNEADER/BANBURY MIXING IN PLASTIC COMPOUNDING MARKET, BY PELLETIZING SYSTEM, 2018-2032 (USD THOUSAND)
TABLE 148 U.S. PLASTIC COMPOUNDING MARKET, BY PROPERTIES, 2018-2032 (USD THOUSAND)
TABLE 149 U.S. PLASTIC COMPOUNDING MARKET, BY APPLICATION, 2018-2032 (USD THOUSAND)
TABLE 150 U.S. PLASTIC COMPOUNDING MARKET, BY APPLICATION, 2018-2032 (KILO TONS)
TABLE 151 U.S. AUTOMOTIVE IN PLASTIC COMPOUNDING MARKET, BY CATEGORY, 2018-2032 (USD THOUSAND)
TABLE 152 U.S. INTERIOR COMPONENTS IN PLASTIC COMPOUNDING MARKET, BY TYPE, 2018-2032 (USD THOUSAND)
TABLE 153 U.S. EXTERIOR BODY PARTS IN PLASTIC COMPOUNDING MARKET, BY TYPE, 2018-2032 (USD THOUSAND)
TABLE 154 U.S. UNDER-THE-HOOD APPLICATIONS IN PLASTIC COMPOUNDING MARKET, BY TYPE, 2018-2032 (USD THOUSAND)
TABLE 155 U.S. PACKAGING IN PLASTIC COMPOUNDING MARKET, BY CATEGORY, 2018-2032 (USD THOUSAND)
TABLE 156 U.S. FOOD & BEVERAGE PACKAGING IN PLASTIC COMPOUNDING MARKET, BY TYPE, 2018-2032 (USD THOUSAND)
TABLE 157 U.S. INDUSTRIAL PACKAGING IN PLASTIC COMPOUNDING MARKET, BY TYPE, 2018-2032 (USD THOUSAND)
TABLE 158 U.S. CONSUMER GOODS PACKAGING IN PLASTIC COMPOUNDING MARKET, BY TYPE, 2018-2032 (USD THOUSAND)
TABLE 159 U.S. BUILDING & CONSTRUCTION IN PLASTIC COMPOUNDING MARKET, BY CATEGORY, 2018-2032 (USD THOUSAND)
TABLE 160 U.S. ELECTRICAL & ELECTRONICS IN PLASTIC COMPOUNDING MARKET, BY CATEGORY, 2018-2032 (USD THOUSAND)
TABLE 161 U.S. MEDICAL DEVICES IN PLASTIC COMPOUNDING MARKET, BY CATEGORY, 2018-2032 (USD THOUSAND)
TABLE 162 U.S. FURNITURE IN PLASTIC COMPOUNDING MARKET, BY CATEGORY, 2018-2032 (USD THOUSAND)
TABLE 163 U.S. ENERGY AND POWER IN PLASTIC COMPOUNDING MARKET, BY CATEGORY, 2018-2032 (USD THOUSAND)
TABLE 164 U.S. AEROSPACE AND DEFENSE IN PLASTIC COMPOUNDING MARKET, BY CATEGORY, 2018-2032 (USD THOUSAND)
TABLE 165 CANADA PLASTIC COMPOUNDING MARKET, BY POLYMER TYPE, 2018-2032 (USD THOUSAND)
TABLE 166 CANADA PLASTIC COMPOUNDING MARKET, BY POLYMER TYPE, 2018-2032 (KILO TONS)
TABLE 167 CANADA THERMOPLASTICS IN PLASTIC COMPOUNDING MARKET, BY TYPE, 2018-2032 (USD THOUSAND)
TABLE 168 CANADA POLYETHYLENE (PE) IN PLASTIC COMPOUNDING MARKET, BY TYPE, 2018-2032 (USD THOUSAND)
TABLE 169 CANADA ENGINEERING PLASTICS IN PLASTIC COMPOUNDING MARKET, BY TYPE, 2018-2032 (USD THOUSAND)
TABLE 170 CANADA THERMOSETTING PLASTICS IN PLASTIC COMPOUNDING MARKET, BY TYPE, 2018-2032 (USD THOUSAND)
TABLE 171 CANADA BIOPLASTICS IN PLASTIC COMPOUNDING MARKET, BY TYPE, 2018-2032 (USD THOUSAND)
TABLE 172 CANADA PLASTIC COMPOUNDING MARKET, BY FILLER TYPE, 2018-2032 (USD THOUSAND)
TABLE 173 CANADA MINERAL FILLERS IN PLASTIC COMPOUNDING MARKET, BY TYPE, 2018-2032 (USD THOUSAND)
TABLE 174 CANADA REINFORCEMENTS IN PLASTIC COMPOUNDING MARKET, BY TYPE, 2018-2032 (USD THOUSAND)
TABLE 175 CANADA ADDITIVES IN PLASTIC COMPOUNDING MARKET, BY TYPE, 2018-2032 (USD THOUSAND)
TABLE 176 CANADA PLASTIC COMPOUNDING MARKET, BY MANUFACTURING PROCESS, 2018-2032 (USD THOUSAND)
TABLE 177 CANADA PLASTIC COMPOUNDING MARKET, BY MANUFACTURING PROCESS, 2018-2032 (KILO TONS)
TABLE 178 CANADA EXTRUSION IN PLASTIC COMPOUNDING MARKET, BY TYPE, 2018-2032 (USD THOUSAND)
TABLE 179 CANADA EXTRUSION IN PLASTIC COMPOUNDING MARKET, BY PELLETIZING SYSTEM, 2018-2032 (USD THOUSAND)
TABLE 180 CANADA INJECTION MOLDING BASED COMPOUNDING IN PLASTIC COMPOUNDING MARKET, BY PELLETIZING SYSTEM, 2018-2032 (USD THOUSAND)
TABLE 181 CANADA COMPACTION/PRESSING IN PLASTIC COMPOUNDING MARKET, BY PELLETIZING SYSTEM, 2018-2032 (USD THOUSAND)
TABLE 182 CANADA KNEADER/BANBURY MIXING IN PLASTIC COMPOUNDING MARKET, BY PELLETIZING SYSTEM, 2018-2032 (USD THOUSAND)
TABLE 183 CANADA PLASTIC COMPOUNDING MARKET, BY PROPERTIES, 2018-2032 (USD THOUSAND)
TABLE 184 CANADA PLASTIC COMPOUNDING MARKET, BY APPLICATION, 2018-2032 (USD THOUSAND)
TABLE 185 CANADA PLASTIC COMPOUNDING MARKET, BY APPLICATION, 2018-2032 (KILO TONS)
TABLE 186 CANADA AUTOMOTIVE IN PLASTIC COMPOUNDING MARKET, BY CATEGORY, 2018-2032 (USD THOUSAND)
TABLE 187 CANADA INTERIOR COMPONENTS IN PLASTIC COMPOUNDING MARKET, BY TYPE, 2018-2032 (USD THOUSAND)
TABLE 188 CANADA EXTERIOR BODY PARTS IN PLASTIC COMPOUNDING MARKET, BY TYPE, 2018-2032 (USD THOUSAND)
TABLE 189 CANADA UNDER-THE-HOOD APPLICATIONS IN PLASTIC COMPOUNDING MARKET, BY TYPE, 2018-2032 (USD THOUSAND)
TABLE 190 CANADA PACKAGING IN PLASTIC COMPOUNDING MARKET, BY CATEGORY, 2018-2032 (USD THOUSAND)
TABLE 191 CANADA FOOD & BEVERAGE PACKAGING IN PLASTIC COMPOUNDING MARKET, BY TYPE, 2018-2032 (USD THOUSAND)
TABLE 192 CANADA INDUSTRIAL PACKAGING IN PLASTIC COMPOUNDING MARKET, BY TYPE, 2018-2032 (USD THOUSAND)
TABLE 193 CANADA CONSUMER GOODS PACKAGING IN PLASTIC COMPOUNDING MARKET, BY TYPE, 2018-2032 (USD THOUSAND)
TABLE 194 CANADA BUILDING & CONSTRUCTION IN PLASTIC COMPOUNDING MARKET, BY CATEGORY, 2018-2032 (USD THOUSAND)
TABLE 195 CANADA ELECTRICAL & ELECTRONICS IN PLASTIC COMPOUNDING MARKET, BY CATEGORY, 2018-2032 (USD THOUSAND)
TABLE 196 CANADA MEDICAL DEVICES IN PLASTIC COMPOUNDING MARKET, BY CATEGORY, 2018-2032 (USD THOUSAND)
TABLE 197 CANADA FURNITURE IN PLASTIC COMPOUNDING MARKET, BY CATEGORY, 2018-2032 (USD THOUSAND)
TABLE 198 CANADA ENERGY AND POWER IN PLASTIC COMPOUNDING MARKET, BY CATEGORY, 2018-2032 (USD THOUSAND)
TABLE 199 CANADA AEROSPACE AND DEFENSE IN PLASTIC COMPOUNDING MARKET, BY CATEGORY, 2018-2032 (USD THOUSAND)
TABLE 200 MEXICO PLASTIC COMPOUNDING MARKET, BY POLYMER TYPE, 2018-2032 (USD THOUSAND)
TABLE 201 MEXICO PLASTIC COMPOUNDING MARKET, BY POLYMER TYPE, 2018-2032 (KILO TONS)
TABLE 202 MEXICO THERMOPLASTICS IN PLASTIC COMPOUNDING MARKET, BY TYPE, 2018-2032 (USD THOUSAND)
TABLE 203 MEXICO POLYETHYLENE (PE) IN PLASTIC COMPOUNDING MARKET, BY TYPE, 2018-2032 (USD THOUSAND)
TABLE 204 MEXICO ENGINEERING PLASTICS IN PLASTIC COMPOUNDING MARKET, BY TYPE, 2018-2032 (USD THOUSAND)
TABLE 205 MEXICO THERMOSETTING PLASTICS IN PLASTIC COMPOUNDING MARKET, BY TYPE, 2018-2032 (USD THOUSAND)
TABLE 206 MEXICO BIOPLASTICS IN PLASTIC COMPOUNDING MARKET, BY TYPE, 2018-2032 (USD THOUSAND)
TABLE 207 MEXICO PLASTIC COMPOUNDING MARKET, BY FILLER TYPE, 2018-2032 (USD THOUSAND)
TABLE 208 MEXICO MINERAL FILLERS IN PLASTIC COMPOUNDING MARKET, BY TYPE, 2018-2032 (USD THOUSAND)
TABLE 209 MEXICO REINFORCEMENTS IN PLASTIC COMPOUNDING MARKET, BY TYPE, 2018-2032 (USD THOUSAND)
TABLE 210 MEXICO ADDITIVES IN PLASTIC COMPOUNDING MARKET, BY TYPE, 2018-2032 (USD THOUSAND)
TABLE 211 MEXICO PLASTIC COMPOUNDING MARKET, BY MANUFACTURING PROCESS, 2018-2032 (USD THOUSAND)
TABLE 212 MEXICO PLASTIC COMPOUNDING MARKET, BY MANUFACTURING PROCESS, 2018-2032 (KILO TONS)
TABLE 213 MEXICO EXTRUSION IN PLASTIC COMPOUNDING MARKET, BY TYPE, 2018-2032 (USD THOUSAND)
TABLE 214 MEXICO EXTRUSION IN PLASTIC COMPOUNDING MARKET, BY PELLETIZING SYSTEM, 2018-2032 (USD THOUSAND)
TABLE 215 MEXICO INJECTION MOLDING BASED COMPOUNDING IN PLASTIC COMPOUNDING MARKET, BY PELLETIZING SYSTEM, 2018-2032 (USD THOUSAND)
TABLE 216 MEXICO COMPACTION/PRESSING IN PLASTIC COMPOUNDING MARKET, BY PELLETIZING SYSTEM, 2018-2032 (USD THOUSAND)
TABLE 217 MEXICO KNEADER/BANBURY MIXING IN PLASTIC COMPOUNDING MARKET, BY PELLETIZING SYSTEM, 2018-2032 (USD THOUSAND)
TABLE 218 MEXICO PLASTIC COMPOUNDING MARKET, BY PROPERTIES, 2018-2032 (USD THOUSAND)
TABLE 219 MEXICO PLASTIC COMPOUNDING MARKET, BY APPLICATION, 2018-2032 (USD THOUSAND)
TABLE 220 MEXICO PLASTIC COMPOUNDING MARKET, BY APPLICATION, 2018-2032 (KILO TONS)
TABLE 221 MEXICO AUTOMOTIVE IN PLASTIC COMPOUNDING MARKET, BY CATEGORY, 2018-2032 (USD THOUSAND)
TABLE 222 MEXICO INTERIOR COMPONENTS IN PLASTIC COMPOUNDING MARKET, BY TYPE, 2018-2032 (USD THOUSAND)
TABLE 223 MEXICO EXTERIOR BODY PARTS IN PLASTIC COMPOUNDING MARKET, BY TYPE, 2018-2032 (USD THOUSAND)
TABLE 224 MEXICO UNDER-THE-HOOD APPLICATIONS IN PLASTIC COMPOUNDING MARKET, BY TYPE, 2018-2032 (USD THOUSAND)
TABLE 225 MEXICO PACKAGING IN PLASTIC COMPOUNDING MARKET, BY CATEGORY, 2018-2032 (USD THOUSAND)
TABLE 226 MEXICO FOOD & BEVERAGE PACKAGING IN PLASTIC COMPOUNDING MARKET, BY TYPE, 2018-2032 (USD THOUSAND)
TABLE 227 MEXICO INDUSTRIAL PACKAGING IN PLASTIC COMPOUNDING MARKET, BY TYPE, 2018-2032 (USD THOUSAND)
TABLE 228 MEXICO CONSUMER GOODS PACKAGING IN PLASTIC COMPOUNDING MARKET, BY TYPE, 2018-2032 (USD THOUSAND)
TABLE 229 MEXICO BUILDING & CONSTRUCTION IN PLASTIC COMPOUNDING MARKET, BY CATEGORY, 2018-2032 (USD THOUSAND)
TABLE 230 MEXICO ELECTRICAL & ELECTRONICS IN PLASTIC COMPOUNDING MARKET, BY CATEGORY, 2018-2032 (USD THOUSAND)
TABLE 231 MEXICO MEDICAL DEVICES IN PLASTIC COMPOUNDING MARKET, BY CATEGORY, 2018-2032 (USD THOUSAND)
TABLE 232 MEXICO FURNITURE IN PLASTIC COMPOUNDING MARKET, BY CATEGORY, 2018-2032 (USD THOUSAND)
TABLE 233 MEXICO ENERGY AND POWER IN PLASTIC COMPOUNDING MARKET, BY CATEGORY, 2018-2032 (USD THOUSAND)
TABLE 234 MEXICO AEROSPACE AND DEFENSE IN PLASTIC COMPOUNDING MARKET, BY CATEGORY, 2018-2032 (USD THOUSAND)
List of Figure
FIGURE 1 NORTH AMERICA PLASTIC COMPOUNDING MARKET
FIGURE 2 NORTH AMERICA PLASTIC COMPOUNDING MARKET: DATA TRIANGULATION
FIGURE 3 NORTH AMERICA PLASTIC COMPOUNDING MARKET: DROC ANALYSIS
FIGURE 4 NORTH AMERICA PLASTIC COMPOUNDING MARKET: NORTH AMERICA VS REGIONAL MARKET ANALYSIS
FIGURE 5 NORTH AMERICA PLASTIC COMPOUNDING MARKET: COMPANY RESEARCH ANALYSIS
FIGURE 6 NORTH AMERICA PLASTIC COMPOUNDING MARKET: MULTIVARIATE MODELLING
FIGURE 7 NORTH AMERICA PLASTIC COMPOUNDING MARKET: INTERVIEW DEMOGRAPHICS
FIGURE 8 NORTH AMERICA PLASTIC COMPOUNDING MARKET: DBMR MARKET POSITION GRID
FIGURE 9 NORTH AMERICA PLASTIC COMPOUNDING MARKET: MARKET APPLICATION COVERAGE GRID
FIGURE 10 EXECUTIVE SUMMARY
FIGURE 11 NORTH AMERICA PLASTIC COMPOUNDING MARKET: SEGMENTATION
FIGURE 12 FIVE SEGMENTS COMPRISE THE NORTH AMERICA PLASTIC COMPOUNDING MARKET, BY POLYMER TYPE
FIGURE 13 STRATEGIC DECISIONS
FIGURE 14 SHIFT TOWARDS RECYCLABLE AND BIODEGRADABLE PLASTIC COMPOUNDS DUE TO ENVIRONMENTAL REGULATION IS EXPECTED TO DRIVE THE NORTH AMERICA PLASTIC COMPUNDING MARKET DURING THE FORECAST PERIOD OF 2025 TO 2032
FIGURE 15 THERMOPLASTICS SEGMENT IS EXPECTED TO ACCOUNT FOR THE LARGEST SHARE OF THE NORTH AMERICA PLASTIC COMPUNDING MARKET IN 2025 AND 2032
FIGURE 16 PORTER’S FIVE FORCES ANALYSIS
FIGURE 17 NORTH AMERICA PLASTIC COMPOUNDING MARKET: VALUE CHAIN ANALYSIS
FIGURE 18 IMPORT EXPORT SCENARIO (USD THOUSAND)
FIGURE 19 PRODUCTION CAPACITY FOR TOP MANUFACTURERS
FIGURE 20 IPC CODE V/S NUMBER OF PATENTS
FIGURE 21 NUMBER OF PATENTS PER YEAR
FIGURE 22 NUMBER OF PATENTS PER REGION/COUNTRY
FIGURE 23 TOP PATENT APPLICANTS
FIGURE 24 NORTH AMERICA PLASTIC COMPOUNDING MARKET, 2024-2032, AVERAGE SELLING PRICE (USD/KG)
FIGURE 25 DRIVERS, RESTRAINTS, OPPORTUNITIES AND CHALLENGES OF THE NORTH AMERICA PLASTIC COMPOUNDING MARKET
FIGURE 26 NORTH AMERICA PLASTIC COMPOUNDING MARKET: BY POLYMER TYPE, 2024
FIGURE 27 NORTH AMERICA PLASTIC COMPOUNDING MARKET, BY FILTER TYPE, 2024
FIGURE 28 NORTH AMERICA PLASTIC COMPOUNDING MARKET, BY MANUFACTURING PROCESS, 2024
FIGURE 29 NORTH AMERICA PLASTIC COMPOUNDING MARKET, BY PROPERTIES, 2024
FIGURE 30 NORTH AMERICA PLASTIC COMPOUNDING MARKET, BY APPLICATION, 2024
FIGURE 31 NORTH AMERICA PLASTIC COMPOUNDING MARKET: SNAPSHOT (2024)
FIGURE 32 NORTH AMERICA PLASTIC COMPOUNDING MARKET: COMPANY SHARE 2024 (%)
North America Plastic Compounding Market, Supply Chain Analysis and Ecosystem Framework
To support market growth and help clients navigate the impact of geopolitical shifts, DBMR has integrated in-depth supply chain analysis into its North America Plastic Compounding Market research reports. This addition empowers clients to respond effectively to global changes affecting their industries. The supply chain analysis section includes detailed insights such as North America Plastic Compounding Market consumption and production by country, price trend analysis, the impact of tariffs and geopolitical developments, and import and export trends by country and HSN code. It also highlights major suppliers with data on production capacity and company profiles, as well as key importers and exporters. In addition to research, DBMR offers specialized supply chain consulting services backed by over a decade of experience, providing solutions like supplier discovery, supplier risk assessment, price trend analysis, impact evaluation of inflation and trade route changes, and comprehensive market trend analysis.
Data collection and base year analysis are done using data collection modules with large sample sizes. The stage includes obtaining market information or related data through various sources and strategies. It includes examining and planning all the data acquired from the past in advance. It likewise envelops the examination of information inconsistencies seen across different information sources. The market data is analysed and estimated using market statistical and coherent models. Also, market share analysis and key trend analysis are the major success factors in the market report. To know more, please request an analyst call or drop down your inquiry.
The key research methodology used by DBMR research team is data triangulation which involves data mining, analysis of the impact of data variables on the market and primary (industry expert) validation. Data models include Vendor Positioning Grid, Market Time Line Analysis, Market Overview and Guide, Company Positioning Grid, Patent Analysis, Pricing Analysis, Company Market Share Analysis, Standards of Measurement, Global versus Regional and Vendor Share Analysis. To know more about the research methodology, drop in an inquiry to speak to our industry experts.
Data Bridge Market Research is a leader in advanced formative research. We take pride in servicing our existing and new customers with data and analysis that match and suits their goal. The report can be customized to include price trend analysis of target brands understanding the market for additional countries (ask for the list of countries), clinical trial results data, literature review, refurbished market and product base analysis. Market analysis of target competitors can be analyzed from technology-based analysis to market portfolio strategies. We can add as many competitors that you require data about in the format and data style you are looking for. Our team of analysts can also provide you data in crude raw excel files pivot tables (Fact book) or can assist you in creating presentations from the data sets available in the report.


