
North America Process Safety Services Market Analysis and Size
The process safety services market has witnessed high growth due to the increasing adoption of safety norms and standards in various industry verticals such as oil and gas, pharmaceuticals, food and beverages, and others. The industries have become more stringent towards safety norms as the incidents can incur a high loss to the industry both in terms of life and property. The industries focus on incorporating safety solutions and conducting hazard analysis to determine the risk factors and further processes to mitigate those risks. Moreover, with increasing digitalization, the development of process safety systems provides automation in compliance and easy integration with the organizations' control systems. This enables fail-safe control of the entire process and helps to optimize productivity and profit.
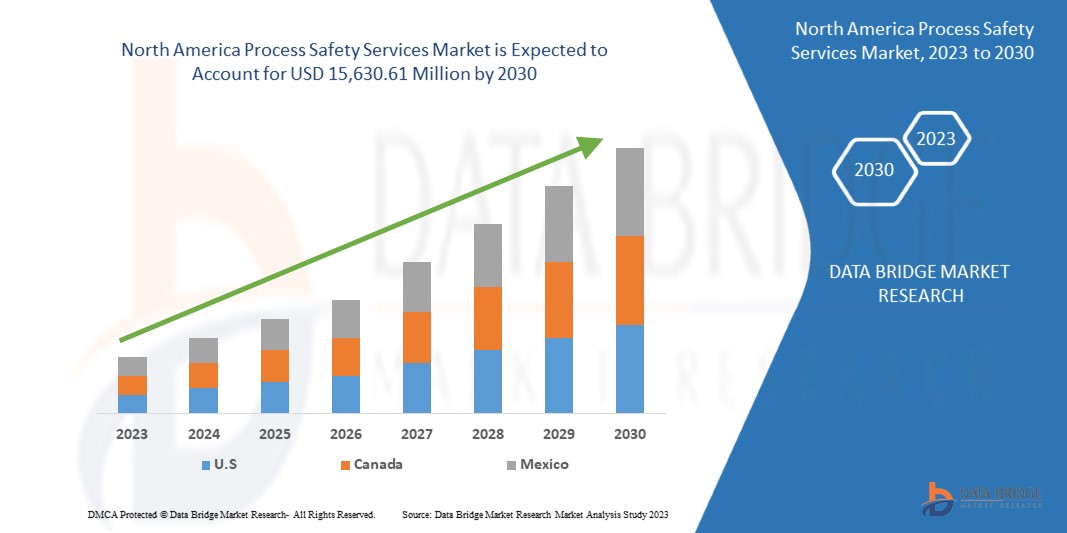
Data Bridge Market Research analyses that the North America process safety services market is expected to reach a value of USD 15,630.61 million by 2030, at a CAGR of 11.4% during the forecast period. The North America process safety services market report also comprehensively covers pricing analysis, patent analysis, and technological advancements.
|
Report Metric |
Details |
|
Forecast Period |
2023 to 2030 |
|
Base Year |
2022 |
|
Historic Years |
2021 (Customizable to 2015-2020) |
|
Quantitative Units |
Revenue in Million, Pricing in USD |
|
Segments Covered |
By Offering (Solution and Services), Safety Integrity Level (Level 2., Level 3, Level 1, and Level 4), End User (Process Manufacturing, Automotive and Discrete Manufacturing, Utilities, Government, Construction and Real Estate, Retail, and Others) |
|
Regions Covered |
U.S., Canada, and Mexico |
|
Market Players Covered |
Siemens, Johnson Controls, Honeywell International Inc., Emerson Electric Co., Schneider Electric, Bureau Veritas, SGS SA, Rockwell Automation, ABB, DEKRA, OMRON Corporation, Intertek Group plc, TÜV SÜD, SOCOTEC, MISTRAS Group, HIMA, Ingenero, Inc., Smith & Burgess Process Safety Consulting, Process Engineering Associates, and LLC, ioKinetic, LLC and others |
Market Definition
Process safety is a framework for managing the integrity of operating systems and processes that handle hazardous substances. It relies on good design principles, engineering, and operating and maintenance practices. It deals with the prevention and control of events that can release hazardous materials and energy. Process safety services and management include designing, certifying, inspecting, and testing processes in concerned industries or organizations to prevent hazardous accidents, quality issues, supply chain damages, and equipment damages. Process safety services aid in assisting clients in meeting their process safety and risk management needs. Process safety services assist clients in all aspects of process safety, from setting up complete process safety management programs and assisting with the execution of various elements.
North America Process Safety Services Market Dynamics
This section deals with understanding the market drivers, advantages, opportunities, restraints, and challenges. All of this is discussed in detail as below:
DRIVERS
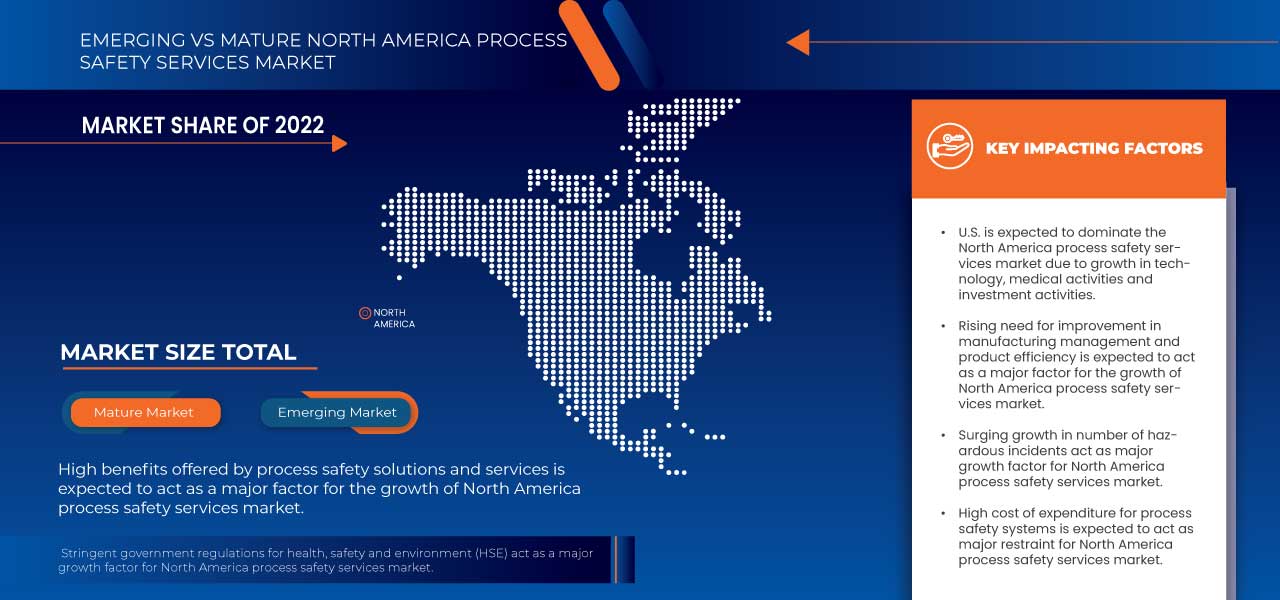
- Rising need for improvement in manufacturing management and product efficiency
Process safety services aid in managing the integrity of operating systems and processes that handle hazardous materials. It can help in identifying, understanding, controlling, and preventing process-related incidents. If any incident occurs, it can cause an adverse effect on the manufacturing process and product efficiency in case of any incident during the ongoing process. The product may get leaked or damaged in case of an accident. However, with the implementation of process safety solutions, the loss of product can be minimized, and manufacturing efficiency can be enhanced, leading to high growth of the process safety services market.
- Surging growth in the number of hazardous incidents
A hazardous incident refers to a spill or release of chemicals, radioactive materials, or biological materials inside a building or the environment, which causes a huge loss of people, infrastructure, or the environment. Hazardous materials can cause hazardous incidents, including explosives, flammable and combustible substances, poisons, and radioactive materials.
Many industries, such as chemical and pharmaceutical plants, mining, consumer goods, pulp and paper, automotive, oil and gas, and manufacturing operations, contain hazardous environments where fire and explosions are major safety concerns. A small spark in an oil & gas industry, refinery, or chemical plant triggers fires, or explosions blast, which could damage machinery and the environment and, even worse, loss of lives.
Thus, due to the increasing number of hazardous incidents or accidents and explosions, manufacturers were implementing and opting for various process safety services to ensure the safety of workers, manufacturing plants, and the environment, which is driving the growth of the market.
OPPORTUNITIES
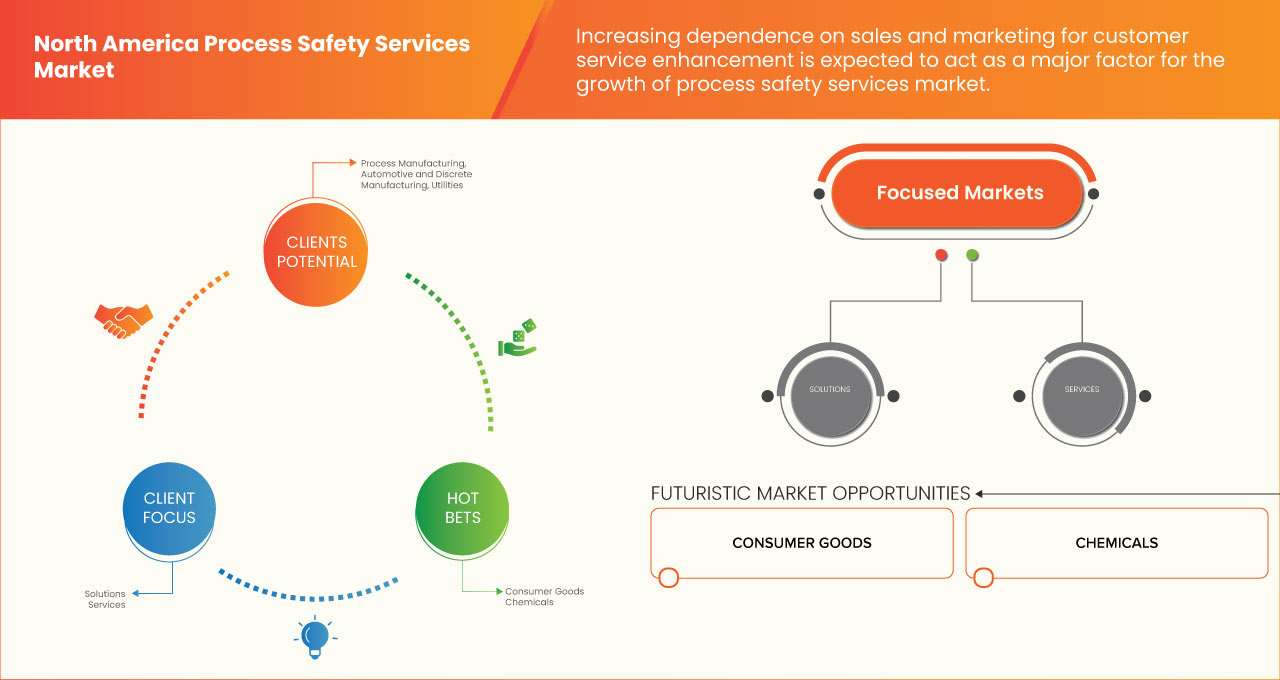
- Rising demand for process safety services in pharmaceutical and food processing industries
With the growing North America population, standard of living, and urbanization, the demand for quality food, medicines, and medical care is also rising. Unforeseen outbreaks of epidemics and pandemics have alerted the governments of the world of the lack of healthcare infrastructure. Governments are investing highly in the healthcare sector and the research and development of modern pharmaceuticals. Food processing needs to be properly supervised, and several quality checks and inspections need to be catered to create a new window of opportunity for the growth of the North America process safety services market.
RESTRAINT/CHALLENGE
- Complexities associated with implementation standards
Industries heavily rely on a useful set of tools for reducing the likelihood of incidents and injuries in the workplace. These include several rules, policies, procedures, and various mechanical safeguards, such as personal protective equipment and machine guards. These are highly useful to incorporate but can also be highly insufficient. No matter how well designed or assimilated, these devices cannot prevent all incidents in complex workplaces. Moreover, several complexities can arise while implementing safety standards. All the equipment and systems need to be aligned with the safety systems.
Industrial safety standards can mitigate the risk and protect from probable risk. However, implementing those standards can lead to several changes in the industry and incur additional costs that can act as a major restraint for the growth of process safety services market.
- Lack of awareness among industries for process safety
Industries need to implement process safety services in their business operation for multiple reasons, such as compliance with regulations, securing supply chains, preventing accidents and hazardous events, compliance with pollution prevention and standardizing and certifying packaging, distribution, and product quality, among others.
Many small and medium-sized enterprises lack the awareness and resources to hire services to ensure process safety. Due to this, their ability to compete in the market is hindered, where consumers mostly look for vendors who are certified in compliance with regulations and quality. Companies developing products without following safety protocols and regulations laid down by the government risk their product being discontinued.
Thus, the lack of awareness among various manufacturing companies to implement adequate safety systems and solutions can restrict the growth of the process safety services market.
Recent Development
- In October 2020, ABB digitalized process safety lifecycle management with the launch of ABB Ability Safety Insight which is a suite of digital software applications which supports companies across the energy and process sectors throughout the entire lifecycle of process safety management. This has helped the company to enhance its process safety management offerings in the market.
- In August 2018, Honeywell International Inc. entered into a reseller agreement with Applied Engineering Solutions, Inc. Under this agreement, the company integrated Applied Engineering Solutions, Inc's aeSolutions' software and aeShield into their new process safety suite. This integration paired the HAZOP/LOPA, SRS, and SIL Verification requirements from aeShield with Honeywell's Safety Builder, Process Safety Analyzer, and Trace into a Process Safety Suite. This has helped the company to enhance its process safety suite in the market.
North America Process Safety Services Market Scope
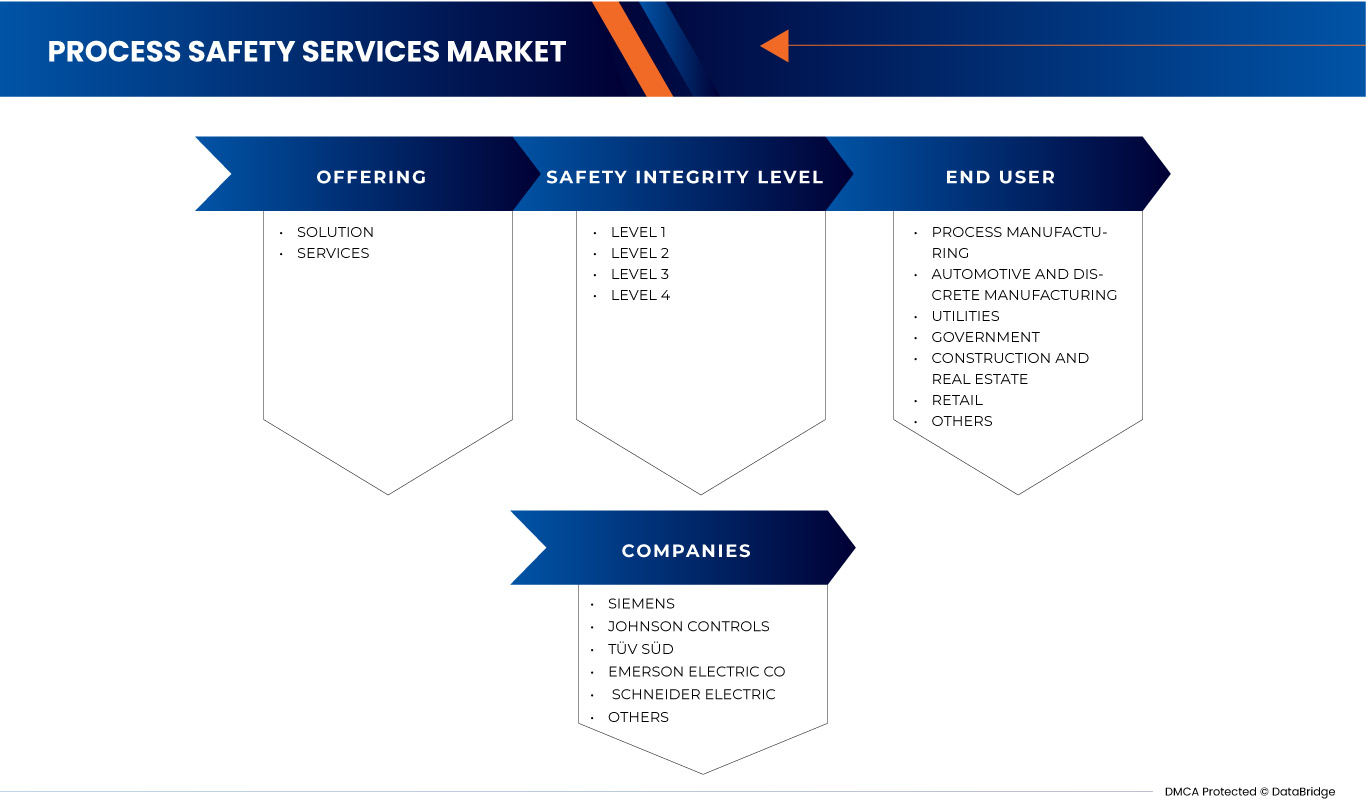
The North America process safety services market is segmented on the basis of offering, safety integrity level, and end user. The growth amongst these segments will help you analyze meager growth segments in the industries and provide the users with a valuable market overview and market insights to help them make strategic decisions for identifying core market applications.
By Offering
- Solution
- Services
On the basis of offering, the process safety services market is segmented into solution and services.
By Safety Integrity Level
- Level 1
- Level 2
- Level 3
- Level 4
On the basis of safety integrity level, the process safety services market is segmented into level 1, level 2, level 3, and level 4.
By End User
- Process manufacturing
- Automotive and Discrete Manufacturing
- Utilities
- Government
- Construction and Real Estate
- Retail
- Others
On the basis of end user, the process safety services market is segmented into process manufacturing, automotive and discrete manufacturing, utilities, government, construction and real estate, retail, and others.
North America Process Safety Services Market Regional Analysis/Insights
The North America process safety services market is analyzed, and market size insights and trends are provided by region, offering, safety integrity level, and end user as referenced above.
The countries covered in the North America process safety services market report are U.S., Canada, and Mexico.
In 2023, U.S. is expected to dominate in the North America region as the country has a large and diverse industrial base, which includes sectors such as oil and gas, chemicals, and manufacturing.
The region section of the report also provides individual market-impacting factors and changes in market regulation that impact the current and future trends of the market. Data points like downstream and upstream value chain analysis, technical trends, and porter's five forces analysis, case studies are some of the pointers used to forecast the market scenario for individual countries. Also, the presence and availability of North America brands and their challenges faced due to large or scarce competition from local and domestic brands, the impact of domestic tariffs, and trade routes are considered while providing forecast analysis of the region data.
Competitive Landscape and North America Process Safety Services Market Share Analysis
The North America process safety services market competitive landscape provides details by the competitor. Details included are company overview, company financials, revenue generated, market potential, investment in research and development, new market initiatives, North America presence, production sites and facilities, production capacities, company strengths and weaknesses, product launch, product width and breadth, and application dominance. The above data points provided are only related to the companies' focus related to the North America process safety services market.
Some of the major players operating in the North America process safety services market are Siemens, Johnson Controls, Honeywell International Inc., Emerson Electric Co., Schneider Electric, Bureau Veritas, SGS SA, Rockwell Automation, ABB, DEKRA, OMRON Corporation, Intertek Group plc, TÜV SÜD, SOCOTEC, MISTRAS Group, HIMA, Ingenero, Inc., Smith & Burgess Process Safety Consulting, Process Engineering Associates, and LLC, ioKinetic, LLC, and others.
SKU-

- Interactive Data Analysis Dashboard
- Company Analysis Dashboard for high growth potential opportunities
- Research Analyst Access for customization & queries
- Competitor Analysis with Interactive dashboard
- Latest News, Updates & Trend analysis
- Harness the Power of Benchmark Analysis for Comprehensive Competitor Tracking
Table of Content
1 INTRODUCTION
1.1 OBJECTIVES OF THE STUDY
1.2 MARKET DEFINITION
1.3 OVERVIEW OF NORTH AMERICA PROCESS SAFETY SERVICES MARKET
1.4 CURRENCY AND PRICING
1.5 LIMITATIONS
1.6 MARKETS COVERED
2 MARKET SEGMENTATION
2.1 MARKETS COVERED
2.2 GEOGRAPHICAL SCOPE
2.3 YEARS CONSIDERED FOR THE STUDY
2.4 DBMR TRIPOD DATA VALIDATION MODEL
2.5 PRIMARY INTERVIEWS WITH KEY OPINION LEADERS
2.6 DBMR MARKET POSITION GRID
2.7 VENDOR SHARE ANALYSIS
2.8 MULTIVARIATE MODELING
2.9 OFFERING TIMELINE CURVE
2.1 MARKET END USER COVERAGE GRID
2.11 SECONDARY SOURCES
2.12 ASSUMPTIONS
3 EXECUTIVE SUMMARY
4 PREMIUM INSIGHTS
4.1 PORTER’S FIVE FORCE ANALYSIS
4.2 REGULATORY STANDARDS
4.2.1 OVERVIEW
4.2.2 COMAH
4.2.3 CONTROL OF MAJOR ACCIDENT HAZARDS REGULATIONS 1999 (COMAH): EMERGENCY PLANNING FOR MAJOR ACCIDENTS
4.2.4 CONTROL OF MAJOR ACCIDENT HAZARDS REGULATIONS 2015 (COMAH):
4.2.5 HAZOP
4.2.6 SIF-PRO
4.2.7 IEC 61508
4.2.8 IEC 61511
4.2.9 BATTERY TESTING
4.2.9.1 UL-9540
4.2.9.2 UL-9540A
4.2.9.3 IEC 62133
4.2.9.4 IS 1651
4.2.10 NFPA 855
4.2.11 DSEAR
4.3 STANDARDS AND DIRECTIVES ANALYSIS
4.3.1 OVERVIEW
4.3.2 PROCESS SAFETY MANAGEMENT (PSM)
4.3.3 UNITED STATES ENVIRONMENTAL PROTECTION AGENCY (EPA)
5 MARKET OVERVIEW
5.1 DRIVERS
5.1.1 RISING NEED FOR IMPROVEMENT IN MANUFACTURING MANAGEMENT AND PRODUCT EFFICIENCY
5.1.2 STRINGENT GOVERNMENT REGULATIONS FOR HEALTH, SAFETY, AND ENVIRONMENT (HSE)
5.1.3 SURGING GROWTH IN THE NUMBER OF HAZARDOUS INCIDENTS
5.1.4 HIGH BENEFITS OFFERED BY PROCESS SAFETY SOLUTIONS AND SERVICES
5.2 RESTRAINTS
5.2.1 HIGH COST OF EXPENDITURE FOR PROCESS SAFETY SYSTEMS
5.2.2 COMPLEXITIES ASSOCIATED WITH IMPLEMENTATION STANDARDS
5.3 OPPORTUNITIES
5.3.1 RISING DEMAND FOR PROCESS SAFETY SERVICES IN PHARMACEUTICAL AND FOOD PROCESSING INDUSTRIES
5.3.2 INCREASING NEED TO REDUCE HAZARDOUS EVENTS IN OIL AND GAS INDUSTRY
5.3.3 RISING NEED FOR TRAINING FOR THE ENGINEER, OPERATOR, AND MAINTENANCE PROFESSIONALS
5.3.4 INCREASING GROWTH OF INDUSTRY 4.0
5.4 CHALLENGE
5.4.1 LACK OF AWARENESS AMONG INDUSTRIES FOR PROCESS SAFETY
6 NORTH AMERICA PROCESS SAFETY SERVICES MARKET, BY OFFERING
6.1 OVERVIEW
6.2 SOLUTION
6.2.1 PSM PROGRAM MANAGEMENT
6.2.2 MECHANICAL INTEGRITY PROGRAM
6.2.3 EMERGENCY PLANNING AND RESPONSE
6.2.4 PROCESS SAFETY INFORMATION (PSI)
6.2.5 PROCESS HAZARD ANALYSIS (PHA)
6.2.6 CONTRACTOR MANAGEMENT PROGRAM
6.2.7 PRE-STARTUP SAFETY REVIEW (PSSR)
6.2.8 STANDARD OPERATING PROCEDURES (SOP)
6.2.9 DUST HAZARD ANALYSIS (DSA)
6.2.10 MANAGEMENT OF CHANGE (MOC)
6.2.11 COMPLIANCE MANAGEMENT
6.2.12 AUDITS, INCIDENT INVESTIGATION, AND RESPONSE
6.2.13 OTHERS
6.3 SERVICES
6.3.1 TESTING
6.3.2 CERTIFICATION AND INSPECTION
6.3.3 CONSULTING
6.3.4 TRAINING
6.3.5 AUDITING
7 NORTH AMERICA PROCESS SAFETY SERVICES MARKET, BY SAFETY INTEGRITY LEVEL
7.1 OVERVIEW
7.2 LEVEL 2
7.3 LEVEL 3
7.4 LEVEL 1
7.5 LEVEL 4
8 NORTH AMERICA PROCESS SAFETY SERVICES MARKET, BY END USER
8.1 OVERVIEW
8.2 PROCESS MANUFACTURING
8.2.1 PROCESS MANUFACTURING, BY OFFERING
8.2.1.1 SOLUTION
8.2.1.1.1 PSM PROGRAM MANAGEMENT
8.2.1.1.2 MECHANICAL INTEGRITY PROGRAM
8.2.1.1.3 EMERGENCY PLANNING AND RESPONSE
8.2.1.1.4 PROCESS SAFETY INFORMATION (PSI)
8.2.1.1.5 PROCESS HAZARD ANALYSIS (PHA)
8.2.1.1.6 CONTRACTOR MANAGEMENT PROGRAM
8.2.1.1.7 PRE-STARTUP SAFETY REVIEW (PSSR)
8.2.1.1.8 STANDARD OPERATING PROCEDURES (SOP)
8.2.1.1.9 DUST HAZARD ANALYSIS (DSA)
8.2.1.1.10 MANAGEMENT OF CHANGE (MOC)
8.2.1.1.11 COMPLIANCE MANAGEMENT
8.2.1.1.12 AUDITS, INCIDENT INVESTIGATION, AND RESPONSE
8.2.1.1.13 OTHERS
8.2.1.2 SERVICES
8.2.1.2.1 TESTING
8.2.1.2.2 CERTIFICATION AND INSPECTION
8.2.1.2.3 CONSULTING
8.2.1.2.4 TRAINING
8.2.1.2.5 AUDITING
8.2.2 PROCESS MANUFACTURING, BY TYPE
8.2.2.1 CHEMICAL
8.2.2.2 CONSUMER GOODS
8.2.2.2.1 FOOD AND BEVERAGE
8.2.2.2.2 PERSONAL CARE MANUFACTURING
8.2.2.2.3 OTHERS
8.2.2.3 PHARMACEUTICAL
8.2.2.4 METALS AND MINING
8.2.2.5 OIL AND GAS
8.2.2.6 PULP AND PAPER
8.2.2.7 OTHERS
8.3 AUTOMOTIVE AND DISCRETE MANUFACTURING
8.3.1 SOLUTION
8.3.1.1 PSM PROGRAM MANAGEMENT
8.3.1.2 MECHANICAL INTEGRITY PROGRAM
8.3.1.3 EMERGENCY PLANNING AND RESPONSE
8.3.1.4 PROCESS SAFETY INFORMATION (PSI)
8.3.1.5 PROCESS HAZARD ANALYSIS (PHA)
8.3.1.6 CONTRACTOR MANAGEMENT PROGRAM
8.3.1.7 PRE-STARTUP SAFETY REVIEW (PSSR)
8.3.1.8 STANDARD OPERATING PROCEDURES (SOP)
8.3.1.9 DUST HAZARD ANALYSIS (DSA)
8.3.1.10 MANAGEMENT OF CHANGE (MOC)
8.3.1.11 COMPLIANCE MANAGEMENT
8.3.1.12 AUDITS, INCIDENT INVESTIGATION, AND RESPONSE
8.3.1.13 OTHERS
8.3.2 SERVICES
8.3.2.1 TESTING
8.3.2.2 CERTIFICATION AND INSPECTION
8.3.2.3 CONSULTING
8.3.2.4 TRAINING
8.3.2.5 AUDITING
8.4 UTILITIES
8.4.1 UTILITIES, BY OFFERING
8.4.1.1 SOLUTION
8.4.1.1.1 PSM PROGRAM MANAGEMENT
8.4.1.1.2 MECHANICAL INTEGRITY PROGRAM
8.4.1.1.3 EMERGENCY PLANNING AND RESPONSE
8.4.1.1.4 PROCESS SAFETY INFORMATION (PSI)
8.4.1.1.5 PROCESS HAZARD ANALYSIS (PHA)
8.4.1.1.6 CONTRACTOR MANAGEMENT PROGRAM
8.4.1.1.7 PRE-STARTUP SAFETY REVIEW (PSSR)
8.4.1.1.8 STANDARD OPERATING PROCEDURES (SOP)
8.4.1.1.9 DUST HAZARD ANALYSIS (DSA)
8.4.1.1.10 MANAGEMENT OF CHANGE (MOC)
8.4.1.1.11 COMPLIANCE MANAGEMENT
8.4.1.1.12 AUDITS, INCIDENT INVESTIGATION, AND RESPONSE
8.4.1.1.13 OTHERS
8.4.1.2 SERVICES
8.4.1.2.1 TESTING
8.4.1.2.2 CERTIFICATION AND INSPECTION
8.4.1.2.3 CONSULTING
8.4.1.2.4 TRAINING
8.4.1.2.5 AUDITING
8.4.2 UTILITIES, BY TYPE
8.4.2.1 WASTE DISPOSAL
8.4.2.2 ELECTRICITY
8.4.2.3 HEAT
8.4.2.4 WATER
8.5 GOVERNMENT
8.5.1 SOLUTION
8.5.1.1 PSM PROGRAM MANAGEMENT
8.5.1.2 MECHANICAL INTEGRITY PROGRAM
8.5.1.3 EMERGENCY PLANNING AND RESPONSE
8.5.1.4 PROCESS SAFETY INFORMATION (PSI)
8.5.1.5 PROCESS HAZARD ANALYSIS (PHA)
8.5.1.6 CONTRACTOR MANAGEMENT PROGRAM
8.5.1.7 PRE-STARTUP SAFETY REVIEW (PSSR)
8.5.1.8 STANDARD OPERATING PROCEDURES (SOP)
8.5.1.9 DUST HAZARD ANALYSIS (DSA)
8.5.1.10 MANAGEMENT OF CHANGE (MOC)
8.5.1.11 COMPLIANCE MANAGEMENT
8.5.1.12 AUDITS, INCIDENT INVESTIGATION, AND RESPONSE
8.5.1.13 OTHERS
8.5.2 SERVICES
8.5.2.1 TESTING
8.5.2.2 CERTIFICATION AND INSPECTION
8.5.2.3 CONSULTING
8.5.2.4 TRAINING
8.5.2.5 AUDITING
8.6 CONSTRUCTION AND REAL ESTATE
8.6.1 SOLUTION
8.6.1.1 PSM PROGRAM MANAGEMENT
8.6.1.2 MECHANICAL INTEGRITY PROGRAM
8.6.1.3 EMERGENCY PLANNING AND RESPONSE
8.6.1.4 PROCESS SAFETY INFORMATION (PSI)
8.6.1.5 PROCESS HAZARD ANALYSIS (PHA)
8.6.1.6 CONTRACTOR MANAGEMENT PROGRAM
8.6.1.7 PRE-STARTUP SAFETY REVIEW (PSSR)
8.6.1.8 STANDARD OPERATING PROCEDURES (SOP)
8.6.1.9 DUST HAZARD ANALYSIS (DSA)
8.6.1.10 MANAGEMENT OF CHANGE (MOC)
8.6.1.11 COMPLIANCE MANAGEMENT
8.6.1.12 AUDITS, INCIDENT INVESTIGATION, AND RESPONSE
8.6.1.13 OTHERS
8.6.2 SERVICES
8.6.2.1 TESTING
8.6.2.2 CERTIFICATION AND INSPECTION
8.6.2.3 CONSULTING
8.6.2.4 TRAINING
8.6.2.5 AUDITING
8.7 RETAIL
8.7.1 SOLUTION
8.7.1.1 PSM PROGRAM MANAGEMENT
8.7.1.2 MECHANICAL INTEGRITY PROGRAM
8.7.1.3 EMERGENCY PLANNING AND RESPONSE
8.7.1.4 PROCESS SAFETY INFORMATION (PSI)
8.7.1.5 PROCESS HAZARD ANALYSIS (PHA)
8.7.1.6 CONTRACTOR MANAGEMENT PROGRAM
8.7.1.7 PRE-STARTUP SAFETY REVIEW (PSSR)
8.7.1.8 STANDARD OPERATING PROCEDURES (SOP)
8.7.1.9 DUST HAZARD ANALYSIS (DSA)
8.7.1.10 MANAGEMENT OF CHANGE (MOC)
8.7.1.11 COMPLIANCE MANAGEMENT
8.7.1.12 AUDITS, INCIDENT INVESTIGATION, AND RESPONSE
8.7.1.13 OTHERS
8.7.2 SERVICES
8.7.2.1 TESTING
8.7.2.2 CERTIFICATION AND INSPECTION
8.7.2.3 CONSULTING
8.7.2.4 TRAINING
8.7.2.5 AUDITING
8.8 OTHERS
9 NORTH AMERICA PROCESS SAFETY SERVICES MARKET, BY REGION
9.1 NORTH AMERICA
9.1.1 U.S.
9.1.2 CANADA
9.1.3 MEXICO
10 NORTH AMERICA PROCESS SAFETY SERVICES MARKET, COMPANY LANDSCAPE
10.1 COMPANY SHARE ANALYSIS: NORTH AMERICA
11 SWOT ANALYSIS
12 COMPANY PROFILE
12.1 SIEMENS
12.1.1 COMPANY SNAPSHOT
12.1.2 REVENUE ANALYSIS
12.1.3 COMPANY SHARE ANALYSIS
12.1.4 PRODUCT PORTFOLIO
12.1.5 RECENT DEVELOPMENTS
12.2 JOHNSON CONTROLS
12.2.1 COMPANY SNAPSHOT
12.2.2 REVENUE ANALYSIS
12.2.3 COMPANY SHARE ANALYSIS
12.2.4 PRODUCT PORTFOLIO
12.2.5 RECENT DEVELOPMENT
12.3 TÜV SÜD
12.3.1 COMPANY SNAPSHOT
12.3.2 COMPANY SHARE ANALYSIS
12.3.3 PRODUCT PORTFOLIO
12.3.4 RECENT DEVELOPMENTS
12.4 EMERSON ELECTRIC CO.
12.4.1 COMPANY SNAPSHOT
12.4.2 REVENUE ANALYSIS
12.4.3 COMPANY SHARE ANALYSIS
12.4.4 PRODUCT PORTFOLIO
12.4.5 RECENT DEVELOPMENTS
12.5 SCHNEIDER ELLECTRIC
12.5.1 COMPANY SNAPSHOT
12.5.2 REVENUE ANALYSIS
12.5.3 COMPANY SHARE ANALYSIS
12.5.4 PRODUCT PORTFOLIO
12.5.5 RECENT DEVELOPMENTS
12.6 ABB
12.6.1 COMPANY SNAPSHOT
12.6.2 REVENUE ANALYSIS
12.6.3 PRODUCT PORTFOLIO
12.6.4 RECENT DEVELOPMENTS
12.7 BUREAU VERITAS
12.7.1 COMPANY SNAPSHOT
12.7.2 REVENUE ANALYSIS
12.7.3 PRODUCT PORTFOLIO
12.7.4 RECENT DEVELOPMENTS
12.8 DEKRA
12.8.1 COMPANY SNAPSHOT
12.8.2 PRODUCT PORTFOLIO
12.8.3 RECENT DEVELOPMENT
12.9 HONEYWELL INTERNATIONAL INC.
12.9.1 COMPANY SNAPSHOT
12.9.2 REVENUE ANALYSIS
12.9.3 SOLUTION PORTFOLIO
12.9.4 RECENT DEVELOPMENTS
12.1 HIMA
12.10.1 COMPANY SNAPSHOT
12.10.2 PRODUCT PORTFOLIO
12.10.3 RECENT DEVELOPMENTS
12.11 INGENERO, INC
12.11.1 COMPANY SNAPSHOT
12.11.2 SERVICE PORTFOLIO
12.11.3 RECENT DEVELOPMENT
12.12 INTERTEK GROUP PLC
12.12.1 COMPANY SNAPSHOT
12.12.2 REVENUE ANALYSIS
12.12.3 PRODUCT PORTFOLIO
12.12.4 RECENT DEVELOPMENTS
12.13 IOKINETIC, LLC
12.13.1 COMPANY SNAPSHOT
12.13.2 PRODUCT PORTFOLIO
12.13.3 RECENT DEVELOPMENTS
12.14 MISTRAS GROUP, INC.
12.14.1 COMPANY SNAPSHOT
12.14.2 REVENUE ANALYSIS
12.14.3 PRODUCT PORTFOLIO
12.14.4 RECENT DEVELOPMENTS
12.15 OMRON CORPORATION
12.15.1 COMPANY SNAPSHOT
12.15.2 REVENUE ANALYSIS
12.15.3 PRODUCT PORTFOLIO
12.15.4 RECENT DEVELOPMENTS
12.16 PROCESS ENGINEERING ASSOCIATES, LLC
12.16.1 COMPANY SNAPSHOT
12.16.2 PRODUCT PORTFOLIO
12.16.3 RECENT DEVELOPMENT
12.17 ROCKWELL AUTOMTAION
12.17.1 COMPANY SNAPSHOT
12.17.2 REVENUE ANALYSIS
12.17.3 PRODUCT PORTFOLIO
12.17.4 RECENT DEVELOPMENTS
12.18 SGS SA
12.18.1 COMPANY SNAPSHOT
12.18.2 REVENUE ANALYSIS
12.18.3 PRODUCT PORTFOLIO
12.18.4 RECENT DEVELOPMENTS
12.19 SMITH & BURGESS PROCESS SAFETY CONSULTING
12.19.1 COMPANY SNAPSHOT
12.19.2 PRODUCT PORTFOLIO
12.19.3 RECENT DEVELOPMENTS
12.2 SOCOTEC
12.20.1 COMPANY SNAPSHOT
12.20.2 PRODUCT PORTFOLIO
12.20.3 RECENT DEVELOPMENTS
13 QUESTIONNAIRE
14 RELATED REPORTS
List of Table
TABLE 1 NORTH AMERICA PROCESS SAFETY SERVICES MARKET, BY OFFERING, 2021-2030 (USD MILLION)
TABLE 2 NORTH AMERICA SOLUTION IN PROCESS SAFETY SERVICES MARKET, BY REGION, 2021-2030 (USD MILLION)
TABLE 3 NORTH AMERICA SOLUTION IN PROCESS SAFETY SERVICES MARKET, BY TYPE, 2021-2030 (USD MILLION)
TABLE 4 NORTH AMERICA SERVICES IN PROCESS SAFETY SERVICES MARKET, BY REGION, 2021-2030 (USD MILLION)
TABLE 5 NORTH AMERICA SERVICES IN PROCESS SAFETY SERVICES MARKET, BY TYPE, 2021-2030 (USD MILLION)
TABLE 6 NORTH AMERICA PROCESS SAFETY SERVICES MARKET, BY SAFETY INTEGRITY LEVEL, 2021-2030 (USD MILLION)
TABLE 7 NORTH AMERICA LEVEL 2 IN PROCESS SAFETY SERVICES MARKET, BY REGION, 2021-2030 (USD MILLION)
TABLE 8 NORTH AMERICA LEVEL 3 IN PROCESS SAFETY SERVICES MARKET, BY REGION, 2021-2030 (USD MILLION)
TABLE 9 NORTH AMERICA LEVEL 1 IN PROCESS SAFETY SERVICES MARKET, BY REGION, 2021-2030 (USD MILLION)
TABLE 10 NORTH AMERICA LEVEL 4 IN PROCESS SAFETY SERVICES MARKET, BY REGION, 2021-2030 (USD MILLION)
TABLE 11 NORTH AMERICA PROCESS SAFETY SERVICES MARKET, BY END USER, 2021-2030 (USD MILLION)
TABLE 12 NORTH AMERICA PROCESS MANUFACTURING IN PROCESS SAFETY SERVICES MARKET, BY REGION, 2021-2030 (USD MILLION)
TABLE 13 NORTH AMERICA PROCESS MANUFACTURING IN PROCESS SAFETY SERVICES MARKET, BY OFFERING, 2021-2030 (USD MILLION)
TABLE 14 NORTH AMERICA SOLUTION IN PROCESS SAFETY SERVICES MARKET, BY OFFERING, 2021-2030 (USD MILLION)
TABLE 15 NORTH AMERICA SERVICES IN PROCESS SAFETY SERVICES MARKET, BY OFFERING, 2021-2030 (USD MILLION)
TABLE 16 NORTH AMERICA PROCESS MANUFACTURING IN PROCESS SAFETY SERVICES MARKET, BY TYPE, 2021-2030 (USD MILLION)
TABLE 17 NORTH AMERICA CONSUMER GOODS IN PROCESS SAFETY SERVICES MARKET, BY TYPE, 2021-2030 (USD MILLION)
TABLE 18 NORTH AMERICA AUTOMOTIVE AND DISCRETE MANUFACTURING IN PROCESS SAFETY SERVICES MARKET, BY REGION, 2021-2030 (USD MILLION)
TABLE 19 NORTH AMERICA AUTOMOTIVE AND DISCRETE MANUFACTURING IN PROCESS SAFETY SERVICES MARKET, BY OFFERING, 2021-2030 (USD MILLION)
TABLE 20 NORTH AMERICA SOLUTION IN PROCESS SAFETY SERVICES MARKET, BY OFFERING, 2021-2030 (USD MILLION)
TABLE 21 NORTH AMERICA SERVICES IN PROCESS SAFETY SERVICES MARKET, BY OFFERING, 2021-2030 (USD MILLION)
TABLE 22 NORTH AMERICA UTILITIES IN PROCESS SAFETY SERVICES MARKET, BY REGION, 2021-2030 (USD MILLION)
TABLE 23 NORTH AMERICA UTILITIES IN PROCESS SAFETY SERVICES MARKET, BY OFFERING, 2021-2030 (USD MILLION)
TABLE 24 NORTH AMERICA SOLUTION IN PROCESS SAFETY SERVICES MARKET, BY OFFERING, 2021-2030 (USD MILLION)
TABLE 25 NORTH AMERICA SERVICES IN PROCESS SAFETY SERVICES MARKET, BY OFFERING, 2021-2030 (USD MILLION)
TABLE 26 NORTH AMERICA UTILITIES IN PROCESS SAFETY SERVICES MARKET, BY TYPE, 2021-2030 (USD MILLION)
TABLE 27 NORTH AMERICA GOVERNMENT IN PROCESS SAFETY SERVICES MARKET, BY REGION, 2021-2030 (USD MILLION)
TABLE 28 NORTH AMERICA GOVERNMENT IN PROCESS SAFETY SERVICES MARKET, BY OFFERING, 2021-2030 (USD MILLION)
TABLE 29 NORTH AMERICA SOLUTION IN PROCESS SAFETY SERVICES MARKET, BY OFFERING, 2021-2030 (USD MILLION)
TABLE 30 NORTH AMERICA SERVICES IN PROCESS SAFETY SERVICES MARKET, BY OFFERING, 2021-2030 (USD MILLION)
TABLE 31 NORTH AMERICA CONSTRUCTION AND REAL ESTATE IN PROCESS SAFETY SERVICES MARKET, BY REGION, 2021-2030 (USD MILLION)
TABLE 32 NORTH AMERICA CONSTRUCTION AND REAL ESTATE IN PROCESS SAFETY SERVICES MARKET, BY OFFERING, 2021-2030 (USD MILLION)
TABLE 33 NORTH AMERICA SOLUTION IN PROCESS SAFETY SERVICES MARKET, BY OFFERING, 2021-2030 (USD MILLION)
TABLE 34 NORTH AMERICA SERVICES IN PROCESS SAFETY SERVICES MARKET, BY OFFERING, 2021-2030 (USD MILLION)
TABLE 35 NORTH AMERICA RETAIL IN PROCESS SAFETY SERVICES MARKET, BY REGION, 2021-2030 (USD MILLION)
TABLE 36 NORTH AMERICA RETAIL IN PROCESS SAFETY SERVICES MARKET, BY OFFERING, 2021-2030 (USD MILLION)
TABLE 37 NORTH AMERICA SOLUTION IN PROCESS SAFETY SERVICES MARKET, BY OFFERING, 2021-2030 (USD MILLION)
TABLE 38 NORTH AMERICA SERVICES IN PROCESS SAFETY SERVICES MARKET, BY OFFERING, 2021-2030 (USD MILLION)
TABLE 39 NORTH AMERICA OTHERS IN PROCESS SAFETY SERVICES MARKET, BY REGION, 2021-2030 (USD MILLION)
TABLE 40 NORTH AMERICA PROCESS SAFETY SERVICES MARKET, BY COUNTRY, 2021-2030 (USD MILLION)
TABLE 41 NORTH AMERICA PROCESS SAFETY SERVICES MARKET, BY OFFERING, 2021-2030 (USD MILLION)
TABLE 42 NORTH AMERICA SOLUTION IN PROCESS SAFETY SERVICES MARKET, BY TYPE, 2021-2030 (USD MILLION)
TABLE 43 NORTH AMERICA SERVICES IN PROCESS SAFETY SERVICES MARKET, BY TYPE, 2021-2030 (USD MILLION)
TABLE 44 NORTH AMERICA PROCESS SAFETY SERVICES MARKET, BY SAFETY INTEGRITY LEVEL, 2021-2030 (USD MILLION)
TABLE 45 NORTH AMERICA PROCESS SAFETY SERVICES MARKET, BY END USER, 2021-2030 (USD MILLION)
TABLE 46 NORTH AMERICA PROCESS MANUFACTURING IN PROCESS SAFETY SERVICES MARKET, BY OFFERING, 2021-2030 (USD MILLION)
TABLE 47 NORTH AMERICA SOLUTION IN PROCESS SAFETY SERVICES MARKET, BY OFFERING, 2021-2030 (USD MILLION)
TABLE 48 NORTH AMERICA SERVICES IN PROCESS SAFETY SERVICES MARKET, BY OFFERING, 2021-2030 (USD MILLION)
TABLE 49 NORTH AMERICA PROCESS MANUFACTURING IN PROCESS SAFETY SERVICES MARKET, BY TYPE, 2021-2030 (USD MILLION)
TABLE 50 NORTH AMERICA CONSUMER GOODS IN PROCESS SAFETY SERVICES MARKET, BY TYPE, 2021-2030 (USD MILLION)
TABLE 51 NORTH AMERICA AUTOMOTIVE AND DISCRETE MANUFACTURING IN PROCESS SAFETY SERVICES MARKET, BY OFFERING, 2021-2030 (USD MILLION)
TABLE 52 NORTH AMERICA SOLUTION IN PROCESS SAFETY SERVICES MARKET, BY OFFERING, 2021-2030 (USD MILLION)
TABLE 53 NORTH AMERICA SERVICES IN PROCESS SAFETY SERVICES MARKET, BY OFFERING, 2021-2030 (USD MILLION)
TABLE 54 NORTH AMERICA UTILITIES IN PROCESS SAFETY SERVICES MARKET, BY OFFERING, 2021-2030 (USD MILLION)
TABLE 55 NORTH AMERICA SOLUTION IN PROCESS SAFETY SERVICES MARKET, BY OFFERING, 2021-2030 (USD MILLION)
TABLE 56 NORTH AMERICA SERVICES IN PROCESS SAFETY SERVICES MARKET, BY OFFERING, 2021-2030 (USD MILLION)
TABLE 57 NORTH AMERICA UTILITIES IN PROCESS SAFETY SERVICES MARKET, BY TYPE, 2021-2030 (USD MILLION)
TABLE 58 NORTH AMERICA GOVERNMENT IN PROCESS SAFETY SERVICES MARKET, BY OFFERING, 2021-2030 (USD MILLION)
TABLE 59 NORTH AMERICA SOLUTION IN PROCESS SAFETY SERVICES MARKET, BY OFFERING, 2021-2030 (USD MILLION)
TABLE 60 NORTH AMERICA SERVICES IN PROCESS SAFETY SERVICES MARKET, BY OFFERING, 2021-2030 (USD MILLION)
TABLE 61 NORTH AMERICA CONSTRUCTION AND REAL ESTATE IN PROCESS SAFETY SERVICES MARKET, BY OFFERING, 2021-2030 (USD MILLION)
TABLE 62 NORTH AMERICA SOLUTION IN PROCESS SAFETY SERVICES MARKET, BY OFFERING, 2021-2030 (USD MILLION)
TABLE 63 NORTH AMERICA SERVICES IN PROCESS SAFETY SERVICES MARKET, BY OFFERING, 2021-2030 (USD MILLION)
TABLE 64 NORTH AMERICA RETAIL IN PROCESS SAFETY SERVICES MARKET, BY OFFERING, 2021-2030 (USD MILLION)
TABLE 65 NORTH AMERICA SOLUTION IN PROCESS SAFETY SERVICES MARKET, BY OFFERING, 2021-2030 (USD MILLION)
TABLE 66 NORTH AMERICA SERVICES IN PROCESS SAFETY SERVICES MARKET, BY OFFERING, 2021-2030 (USD MILLION)
TABLE 67 U.S. PROCESS SAFETY SERVICES MARKET, BY TYPE, 2021-2030 (USD MILLION)
TABLE 68 U.S. SOLUTION IN PROCESS SAFETY SERVICES MARKET, BY TYPE, 2021-2030 (USD MILLION)
TABLE 69 U.S. SERVICES IN PROCESS SAFETY SERVICES MARKET, BY TYPE, 2021-2030 (USD MILLION)
TABLE 70 U.S. PROCESS SAFETY SERVICES MARKET, BY SAFETY INTEGRITY LEVEL, 2021-2030 (USD MILLION)
TABLE 71 U.S. PROCESS SAFETY SERVICES MARKET, BY END USER, 2021-2030 (USD MILLION)
TABLE 72 U.S. PROCESS MANUFACTURING IN PROCESS SAFETY SERVICES MARKET, BY OFFERING, 2021-2030 (USD MILLION)
TABLE 73 U.S. PROCESS MANUFACTURING IN PROCESS SAFETY SERVICES MARKET, BY OFFERING, 2021-2030 (USD MILLION)
TABLE 74 U.S. SERVICES IN PROCESS SAFETY SERVICES MARKET, BY OFFERING, 2021-2030 (USD MILLION)
TABLE 75 U.S. PROCESS MANUFACTURING IN PROCESS SAFETY SERVICES MARKET, BY TYPE, 2021-2030 (USD MILLION)
TABLE 76 U.S. CONSUMER GOODS IN PROCESS SAFETY SERVICES MARKET, BY TYPE, 2021-2030 (USD MILLION)
TABLE 77 U.S. AUTOMOTIVE AND DISCRETE MANUFACTURING IN PROCESS SAFETY SERVICES MARKET, BY OFFERING, 2021-2030 (USD MILLION)
TABLE 78 U.S. SOLUTION IN PROCESS SAFETY SERVICES MARKET, BY OFFERING, 2021-2030 (USD MILLION)
TABLE 79 U.S. SERVICES IN PROCESS SAFETY SERVICES MARKET, BY OFFERING, 2021-2030 (USD MILLION)
TABLE 80 U.S. UTILITIES IN PROCESS SAFETY SERVICES MARKET, BY OFFERING, 2021-2030 (USD MILLION)
TABLE 81 U.S. SOLUTION IN PROCESS SAFETY SERVICES MARKET, BY OFFERING, 2021-2030 (USD MILLION)
TABLE 82 U.S. SERVICES IN PROCESS SAFETY SERVICES MARKET, BY OFFERING, 2021-2030 (USD MILLION)
TABLE 83 U.S. UTILITIES IN PROCESS SAFETY SERVICES MARKET, BY TYPE, 2021-2030 (USD MILLION)
TABLE 84 U.S. GOVERNMENT IN PROCESS SAFETY SERVICES MARKET, BY OFFERING, 2021-2030 (USD MILLION)
TABLE 85 U.S. SOLUTION IN PROCESS SAFETY SERVICES MARKET, BY OFFERING, 2021-2030 (USD MILLION)
TABLE 86 U.S. SERVICES IN PROCESS SAFETY SERVICES MARKET, BY OFFERING, 2021-2030 (USD MILLION)
TABLE 87 U.S. CONSTRUCTION AND REAL ESTATE IN PROCESS SAFETY SERVICES MARKET, BY OFFERING, 2021-2030 (USD MILLION)
TABLE 88 U.S. SOLUTION IN PROCESS SAFETY SERVICES MARKET, BY OFFERING, 2021-2030 (USD MILLION)
TABLE 89 U.S. SERVICES IN PROCESS SAFETY SERVICES MARKET, BY OFFERING, 2021-2030 (USD MILLION)
TABLE 90 U.S. RETAIL IN PROCESS SAFETY SERVICES MARKET, BY OFFERING, 2021-2030 (USD MILLION)
TABLE 91 U.S. SOLUTION IN PROCESS SAFETY SERVICES MARKET, BY OFFERING, 2021-2030 (USD MILLION)
TABLE 92 U.S. SERVICES IN PROCESS SAFETY SERVICES MARKET, BY OFFERING, 2021-2030 (USD MILLION)
TABLE 93 CANADA PROCESS SAFETY SERVICES MARKET, BY TYPE, 2021-2030 (USD MILLION)
TABLE 94 CANADA SOLUTION IN PROCESS SAFETY SERVICES MARKET, BY TYPE, 2021-2030 (USD MILLION)
TABLE 95 CANADA SERVICES IN PROCESS SAFETY SERVICES MARKET, BY TYPE, 2021-2030 (USD MILLION)
TABLE 96 CANADA PROCESS SAFETY SERVICES MARKET, BY SAFETY INTEGRITY LEVEL, 2021-2030 (USD MILLION)
TABLE 97 CANADA PROCESS SAFETY SERVICES MARKET, BY END USER, 2021-2030 (USD MILLION)
TABLE 98 CANADA PROCESS MANUFACTURING IN PROCESS SAFETY SERVICES MARKET, BY OFFERING, 2021-2030 (USD MILLION)
TABLE 99 CANADA SOLUTION IN PROCESS SAFETY SERVICES MARKET, BY OFFERING, 2021-2030 (USD MILLION)
TABLE 100 CANADA SERVICES IN PROCESS SAFETY SERVICES MARKET, BY OFFERING, 2021-2030 (USD MILLION)
TABLE 101 CANADA PROCESS MANUFACTURING IN PROCESS SAFETY SERVICES MARKET, BY TYPE, 2021-2030 (USD MILLION)
TABLE 102 CANADA CONSUMER GOODS IN PROCESS SAFETY SERVICES MARKET, BY TYPE, 2021-2030 (USD MILLION)
TABLE 103 CANADA AUTOMOTIVE AND DISCRETE MANUFACTURING IN PROCESS SAFETY SERVICES MARKET, BY OFFERING, 2021-2030 (USD MILLION)
TABLE 104 CANADA SOLUTION IN PROCESS SAFETY SERVICES MARKET, BY OFFERING, 2021-2030 (USD MILLION)
TABLE 105 CANADA SERVICES IN PROCESS SAFETY SERVICES MARKET, BY OFFERING, 2021-2030 (USD MILLION)
TABLE 106 CANADA UTILITIES IN PROCESS SAFETY SERVICES MARKET, BY OFFERING, 2021-2030 (USD MILLION)
TABLE 107 CANADA SOLUTION IN PROCESS SAFETY SERVICES MARKET, BY OFFERING, 2021-2030 (USD MILLION)
TABLE 108 CANADA SERVICES IN PROCESS SAFETY SERVICES MARKET, BY OFFERING, 2021-2030 (USD MILLION)
TABLE 109 CANADA UTILITIES IN PROCESS SAFETY SERVICES MARKET, BY TYPE, 2021-2030 (USD MILLION)
TABLE 110 CANADA GOVERNMENT IN PROCESS SAFETY SERVICES MARKET, BY OFFERING, 2021-2030 (USD MILLION)
TABLE 111 CANADA SOLUTION IN PROCESS SAFETY SERVICES MARKET, BY OFFERING, 2021-2030 (USD MILLION)
TABLE 112 CANADA SERVICES IN PROCESS SAFETY SERVICES MARKET, BY OFFERING, 2021-2030 (USD MILLION)
TABLE 113 CANADA CONSTRUCTION AND REAL ESTATE IN PROCESS SAFETY SERVICES MARKET, BY OFFERING, 2021-2030 (USD MILLION)
TABLE 114 CANADA SOLUTION IN PROCESS SAFETY SERVICES MARKET, BY OFFERING, 2021-2030 (USD MILLION)
TABLE 115 CANADA SERVICES IN PROCESS SAFETY SERVICES MARKET, BY OFFERING, 2021-2030 (USD MILLION)
TABLE 116 CANADA RETAIL IN PROCESS SAFETY SERVICES MARKET, BY OFFERING, 2021-2030 (USD MILLION)
TABLE 117 CANADA SOLUTION IN PROCESS SAFETY SERVICES MARKET, BY OFFERING, 2021-2030 (USD MILLION)
TABLE 118 CANADA SERVICES IN PROCESS SAFETY SERVICES MARKET, BY OFFERING, 2021-2030 (USD MILLION)
TABLE 119 MEXICO PROCESS SAFETY SERVICES MARKET, BY OFFERING, 2021-2030 (USD MILLION)
TABLE 120 MEXICO SOLUTION IN PROCESS SAFETY SERVICES MARKET, BY TYPE, 2021-2030 (USD MILLION)
TABLE 121 MEXICO SERVICES IN PROCESS SAFETY SERVICES MARKET, BY TYPE, 2021-2030 (USD MILLION)
TABLE 122 MEXICO PROCESS SAFETY SERVICES MARKET, BY SAFETY INTEGRITY LEVEL, 2021-2030 (USD MILLION)
TABLE 123 MEXICO PROCESS SAFETY SERVICES MARKET, BY END USER, 2021-2030 (USD MILLION)
TABLE 124 MEXICO PROCESS MANUFACTURING IN PROCESS SAFETY SERVICES MARKET, BY OFFERING, 2021-2030 (USD MILLION)
TABLE 125 MEXICO SOLUTION IN PROCESS SAFETY SERVICES MARKET, BY OFFERING, 2021-2030 (USD MILLION)
TABLE 126 MEXICO SERVICES IN PROCESS SAFETY SERVICES MARKET, BY OFFERING, 2021-2030 (USD MILLION)
TABLE 127 MEXICO PROCESS MANUFACTURING IN PROCESS SAFETY SERVICES MARKET, BY TYPE, 2021-2030 (USD MILLION)
TABLE 128 MEXICO CONSUMER GOODS IN PROCESS SAFETY SERVICES MARKET, BY TYPE, 2021-2030 (USD MILLION)
TABLE 129 MEXICO AUTOMOTIVE AND DISCRETE MANUFACTURING IN PROCESS SAFETY SERVICES MARKET, BY OFFERING, 2021-2030 (USD MILLION)
TABLE 130 MEXICO SOLUTION IN PROCESS SAFETY SERVICES MARKET, BY OFFERING, 2021-2030 (USD MILLION)
TABLE 131 MEXICO SERVICES IN PROCESS SAFETY SERVICES MARKET, BY OFFERING, 2021-2030 (USD MILLION)
TABLE 132 MEXICO UTILITIES IN PROCESS SAFETY SERVICES MARKET, BY OFFERING, 2021-2030 (USD MILLION)
TABLE 133 MEXICO SOLUTION IN PROCESS SAFETY SERVICES MARKET, BY OFFERING, 2021-2030 (USD MILLION)
TABLE 134 MEXICO SERVICES IN PROCESS SAFETY SERVICES MARKET, BY OFFERING, 2021-2030 (USD MILLION)
TABLE 135 MEXICO UTILITIES IN PROCESS SAFETY SERVICES MARKET, BY TYPE, 2021-2030 (USD MILLION)
TABLE 136 MEXICO GOVERNMENT IN PROCESS SAFETY SERVICES MARKET, BY OFFERING, 2021-2030 (USD MILLION)
TABLE 137 MEXICO SOLUTION IN PROCESS SAFETY SERVICES MARKET, BY OFFERING, 2021-2030 (USD MILLION)
TABLE 138 MEXICO SERVICES IN PROCESS SAFETY SERVICES MARKET, BY OFFERING, 2021-2030 (USD MILLION)
TABLE 139 MEXICO CONSTRUCTION AND REAL ESTATE IN PROCESS SAFETY SERVICES MARKET, BY OFFERING, 2021-2030 (USD MILLION)
TABLE 140 MEXICO SOLUTION IN PROCESS SAFETY SERVICES MARKET, BY OFFERING, 2021-2030 (USD MILLION)
TABLE 141 MEXICO SERVICES IN PROCESS SAFETY SERVICES MARKET, BY OFFERING, 2021-2030 (USD MILLION)
TABLE 142 MEXICO RETAIL IN PROCESS SAFETY SERVICES MARKET, BY OFFERING, 2021-2030 (USD MILLION)
TABLE 143 MEXICO SOLUTION IN PROCESS SAFETY SERVICES MARKET, BY OFFERING, 2021-2030 (USD MILLION)
TABLE 144 MEXICO SERVICES IN PROCESS SAFETY SERVICES MARKET, BY OFFERING, 2021-2030 (USD MILLION)
List of Figure
FIGURE 1 NORTH AMERICA PROCESS SAFETY SERVICES MARKET: SEGMENTATION
FIGURE 2 NORTH AMERICA PROCESS SAFETY SERVICES MARKET: DATA TRIANGULATION
FIGURE 3 NORTH AMERICA PROCESS SAFETY SERVICES MARKET: DROC ANALYSIS
FIGURE 4 NORTH AMERICA PROCESS SAFETY SERVICES MARKET: NORTH AMERICA VS REGIONAL MARKET ANALYSIS
FIGURE 5 NORTH AMERICA PROCESS SAFETY SERVICES MARKET: COMPANY RESEARCH ANALYSIS
FIGURE 6 NORTH AMERICA PROCESS SAFETY SERVICES MARKET: INTERVIEW DEMOGRAPHICS
FIGURE 7 NORTH AMERICA PROCESS SAFETY SERVICES MARKET: DBMR MARKET POSITION GRID
FIGURE 8 NORTH AMERICA PROCESS SAFETY SERVICES MARKET: VENDOR SHARE ANALYSIS
FIGURE 9 NORTH AMERICA PROCESS SAFETY SERVICES MARKET: MULTIVARIATE MODELLING
FIGURE 10 NORTH AMERICA PROCESS SAFETY SERVICES MARKET: OFFERING TIMELINE CURVE
FIGURE 11 NORTH AMERICA PROCESS SAFETY SERVICES MARKET: END USER COVERAGE GRID
FIGURE 12 NORTH AMERICA PROCESS SAFETY SERVICES MARKET: SEGMENTATION
FIGURE 13 HIGH BENEFITS OFFERED BY PROCESS SAFETY SOLUTIONS AND SERVICES IS EXPECTED TO DRIVE NORTH AMERICA PROCESS SAFETY SERVICES MARKET IN THE FORECAST PERIOD OF 2023 TO 2030
FIGURE 14 SOLUTION SEGMENT IS EXPECTED TO ACCOUNT FOR THE LARGEST SHARE OF NORTH AMERICA PROCESS SAFETY SERVICES MARKET IN 2023 & 2030
FIGURE 15 DRIVERS, RESTRAINTS, OPPORTUNITIES AND CHALLENGE OF NORTH AMERICA PROCESS SAFETY SERVICES MARKET
FIGURE 16 NORTH AMERICA PROCESS SAFETY SERVICES MARKET: BY OFFERING, 2022
FIGURE 17 NORTH AMERICA PROCESS SAFETY SERVICES MARKET: BY SAFETY INTEGRITY LEVEL, 2022
FIGURE 18 NORTH AMERICA PROCESS SAFETY SERVICES MARKET: BY END USER, 2022
FIGURE 19 NORTH AMERICA PROCESS SAFETY SERVICES MARKET: SNAPSHOT (2022)
FIGURE 20 NORTH AMERICA PROCESS SAFETY SERVICES MARKET: BY COUNTRY (2022)
FIGURE 21 NORTH AMERICA PROCESS SAFETY SERVICES MARKET: BY COUNTRY (2023 & 2030)
FIGURE 22 NORTH AMERICA PROCESS SAFETY SERVICES MARKET: BY COUNTRY (2022 & 2030)
FIGURE 23 NORTH AMERICA PROCESS SAFETY SERVICES MARKET: BY TYPE (2023-2030)
FIGURE 24 NORTH AMERICA PROCESS SAFETY SERVICES MARKET: COMPANY SHARE 2022(%)
Data collection and base year analysis are done using data collection modules with large sample sizes. The stage includes obtaining market information or related data through various sources and strategies. It includes examining and planning all the data acquired from the past in advance. It likewise envelops the examination of information inconsistencies seen across different information sources. The market data is analysed and estimated using market statistical and coherent models. Also, market share analysis and key trend analysis are the major success factors in the market report. To know more, please request an analyst call or drop down your inquiry.
The key research methodology used by DBMR research team is data triangulation which involves data mining, analysis of the impact of data variables on the market and primary (industry expert) validation. Data models include Vendor Positioning Grid, Market Time Line Analysis, Market Overview and Guide, Company Positioning Grid, Patent Analysis, Pricing Analysis, Company Market Share Analysis, Standards of Measurement, Global versus Regional and Vendor Share Analysis. To know more about the research methodology, drop in an inquiry to speak to our industry experts.
Data Bridge Market Research is a leader in advanced formative research. We take pride in servicing our existing and new customers with data and analysis that match and suits their goal. The report can be customized to include price trend analysis of target brands understanding the market for additional countries (ask for the list of countries), clinical trial results data, literature review, refurbished market and product base analysis. Market analysis of target competitors can be analyzed from technology-based analysis to market portfolio strategies. We can add as many competitors that you require data about in the format and data style you are looking for. Our team of analysts can also provide you data in crude raw excel files pivot tables (Fact book) or can assist you in creating presentations from the data sets available in the report.


