Chemical and Materials

Image

North America Protective Gloves Market – Industry Trends and Forecast to 2028

  • Chemical and Materials
  • Published Report
  • Aug 2021
  • North America
  • 350 Pages
  • No of Tables: 264
  • No of Figures: 28

North America Protective Gloves Market, By Product (Nitrile Gloves, Latex Gloves, Vinyl Gloves, Puncture Resistant Gloves, Polyethylene Gloves, Cotton Fabric Gloves, Butyl Gloves, Aluminized Gloves, Neoprene Gloves, Kevlar Gloves, Leather Gloves And Others), Type (Disposable And Reusable), Application (Biological, Chemical, Mechanical, Thermal, Anti-Static, and Others), Distribution Channel (Retail, Direct Sales/B2B), End User (Healthcare, Food And Beverages, Oil & Gas, Transportation, Fire Protection, Construction, Manufacturing, Sports, Military, Mining, and Others)  Country ( U.S., Canada And Mexico ),Industrytrends And  Forecast To 2028.

North America Protective Gloves Market Market Analysis and Insights: North America Protective Gloves Market

North America protective gloves market is expected to gain market growth in the forecast period of 2021 to 2028. Data Bridge Market Research analyses that the market is growing at a CAGR of 7.3% in the forecast period of 2021 to 2028 and expected to reach USD 7,616,240.11 thousands by 2028.

Protective gloves or safety gloves are gloves designed to protect individuals from safety hazards such as cuts, burns, chemicals, abrasions, biohazards, among others. Although, various types of safety gloves are available in the market, it is important to choose the right materials and product for the intended purpose.

Currently various types of safety gloves such as cut-resistant, heat-resistant, anti-impact, anti-vibration, among others are available in the market that are made from materials such as latex, nitrile, vinyl, among others. Protective gloves widely find applications in varied industrial segments such as healthcare, military, construction, among others.

Protective gloves market report provides details of market share, new developments, and product pipeline analysis, impact of domestic and localised market players, analyses opportunities in terms of emerging revenue pockets, changes in market regulations, product approvals, strategic decisions, product launches, geographic expansions, and technological innovations in the market. To understand the analysis and the market scenario, contact us for an Analyst Brief, our team will help you create a revenue impact solution to achieve your desired goal.

North America Protective Gloves Market 
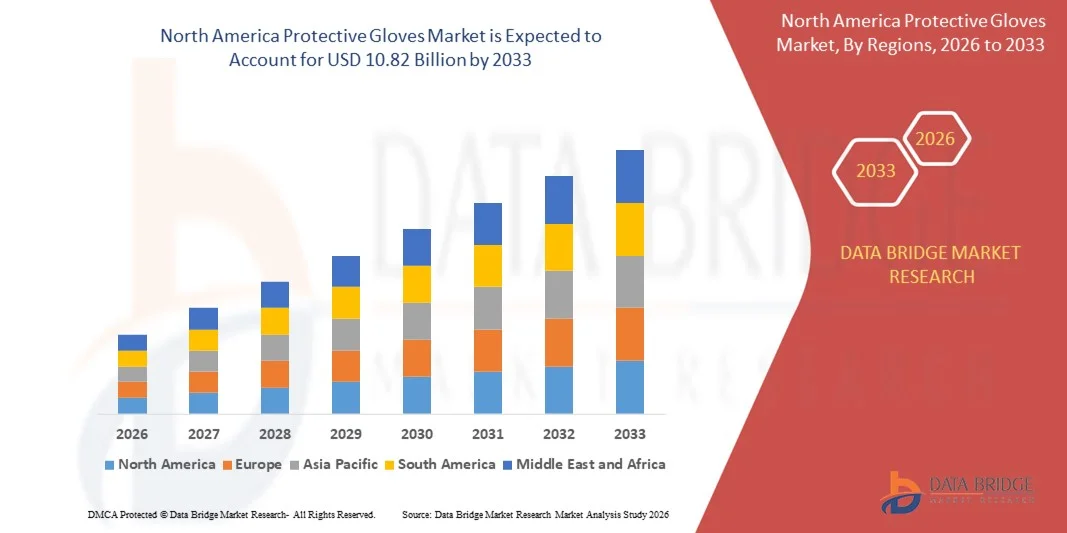
North America Protective Gloves Market Scope and Market Size

North America Protective Gloves market is segmented of the categorized into product, type, distribution channel, application and end-user. The growth among segments helps you analyse niche pockets of growth and strategies to approach the market and determine your core application areas and the difference in your target markets.

  • On the basis of product, the North America protective gloves market is segmented into cotton fabric gloves, latex gloves, puncture resistant gloves, nitrile gloves, neoprene gloves, Kevlar gloves, leather gloves, vinyl gloves, butyl gloves, polyethylene gloves, aluminium gloves and others. In 2021, nitrile gloves segment is expected to dominate in North America protective gloves market due extensive application of protective gloves in oil and mining sector of the region. 
  • On the basis of type, the North America protective gloves market is segmented into reusable and disposable. In 2021, the disposable segment is dominating in North America protective gloves market due to economical nature of such gloves compared to the reusable gloves.
  • On the basis of application, the North America protective gloves market is segmented into chemical, mechanical, biological, thermal, anti-static and others. In 2021, biological segment is expected to dominate in North America protective gloves market as extensive bio based research is conducted by Centre of Disease Control in the respective region.
  • On the basis of distribution channel, the North America protective gloves market is segmented into retail and direct sales/B2B. In 2021, retail segment dominates North America protective gloves market due to the well-developed retail and associated transportation network of the region.
  • On the basis of end-user, North America protective gloves market is segmented into healthcare, manufacturing, food and beverages, transportation, construction, oil and gas, sports, fire protection, military, mining and others. In 2021, healthcare segment is expected to dominate in North America protective gloves market due to increasing number of healthcare as well as well as old age health facilities in the region.

Protective Gloves Market Country Level Analysis

North America Protective Gloves Market is analysed and market size information is provided by country, product, type, distribution channel, application and end-user as referenced above.The countries covered in North America Protective Gloves Market report are U.S., Canada, Mexico.

U.S. is dominating the North America Protective gloves market due to the large demand of protective gloves in various industrial segments present in the region.

The country section of the report also provides individual market impacting factors and changes in regulation in the market domestically that impacts the current and future trends of the market. Data points such as new sales, replacement sales, country demographics, regulatory acts, and import-export tariffs are some of the major pointers used to forecast the market scenario for individual countries. Also, presence and availability of brands and their challenges faced due to large or scarce competition from local and domestic brands, impact of sales channels are considered while providing forecast analysis of the country data.

Growth in the Protective Gloves Industry

North America Protective Gloves Market also provides you with detailed market analysis for every country growth in installed base of different kind of products for Protective gloves market, impact of technology using life line curves and changes in infant formula regulatory scenarios and their impact on the Protective gloves market. The data is available for historic period 2010 to 2019.

Competitive Landscape and Protective Gloves Market Share Analysis

North America Protective Gloves Market competitive landscape provides details by competitor. Details included are company overview, company financials, revenue generated, market potential, investment in research and development, new market initiatives, global presence, production sites and facilities, company strengths and weaknesses, product launch, clinical trials pipelines, brand analysis, product approvals, patents, product width and breadth, application dominance, technology lifeline curve. The above data points provided are only related to the company’s focus related to North America Protective gloves market.

The major players covered in the report are 3M, KWCC, ANSELL LTD., Top Glove Corporation, Kossan Rubber Industries, Supermax Corporation Berhad, DeltaPlus Group, MCR Safety, Ergodyn, Saf-T-Gard International, Inc., Radians Inc., Protective Industrial Products, Inc., Midas Safety, Superior Gloves, Lakeland Industries, Inc., Honeywell International Inc., Hartalega Holdings Berhad, Comfort Ruber Gloves Industries Sdn Bhd, DuPont, Shamrock Manufacturing Company, Inc., and other players domestic and global. DBMR analysts understand competitive strengths and provide competitive analysis for each competitor separately.

For instance,

  • In March 2019, ANSELL LTD. introduced ICROFLEX MidKnight XTRA, a nitrile based glove that is mainly intended for medical professional who have to deal with drug abuse victims. The product offers extensive protection against drugs such as fentanyl, that being vomited by victims. The company intends to strengthen its product portfolio as well as gain competitive advantages over competitors by the introduction of new products.


SKU-

LIST OF TABLES 

TABLE 1 IMPORT DATA OF ARTICLES OF APPAREL AND CLOTHING ACCESSORIES, INCL. GLOVES, MITTENS AND MITTS, FOR ALL PURPOSES, OF VULCANISED RUBBER (EXCLUDING HARD RUBBER AND FOOTWEAR AND HEAD GEAR AND PARTS THEREOF; HS CODE - 4015 (USD THOUSAND)

TABLE 2 EXPORT DATA OF ARTICLES OF APPAREL AND CLOTHING ACCESSORIES, INCL. GLOVES, MITTENS AND MITTS, FOR ALL PURPOSES, OF VULCANISED RUBBER (EXCLUDING HARD RUBBER AND FOOTWEAR AND HEAD GEAR AND PARTS THEREOF; HS CODE - 4015 (USD THOUSAND)

TABLE 3 NORTH AMERICA PROTECTIVE GLOVES MARKET, BY PRODUCT, 2019-2028 (USD THOUSAND)

TABLE 4 NORTH AMERICA PROTECTIVE GLOVES MARKET, BY PRODUCT, 2019-2028 (THOUSAND UNITS)

TABLE 5 NORTH AMERICA NITRILE GLOVES IN PROTECTIVE GLOVES MARKET, BY REGION, 2019-2028 (USD THOUSAND)

TABLE 6 NORTH AMERICA NITRILE GLOVES IN PROTECTIVE GLOVES MARKET, BY REGION, 2019-2028 (THOUSAND UNITS)

TABLE 7 NORTH AMERICA NITRILE GLOVES IN PROTECTIVE GLOVES MARKET, BY TYPE, 2019-2028 (USD THOUSAND)

TABLE 8 NORTH AMERICA NITRILE GLOVES IN PROTECTIVE GLOVES MARKET, BY APPLICATION, 2019-2028 (USD THOUSAND)

TABLE 9 NORTH AMERICA LATEX GLOVES IN PROTECTIVE GLOVES MARKET, BY REGION, 2019-2028 (USD THOUSAND)

TABLE 10 NORTH AMERICA LATEX GLOVES IN PROTECTIVE GLOVES MARKET, BY REGION, 2019-2028 (THOUSAND UNITS)

TABLE 11 NORTH AMERICA LATEX GLOVES IN PROTECTIVE GLOVES MARKET, BY TYPE, 2019-2028 (USD THOUSAND)

TABLE 12 NORTH AMERICA LATEX GLOVES IN PROTECTIVE GLOVES MARKET, BY APPLICATION, 2019-2028 (USD THOUSAND)

TABLE 13 NORTH AMERICA VINYL GLOVES IN PROTECTIVE GLOVES MARKET, BY REGION, 2019-2028 (USD THOUSAND)

TABLE 14 NORTH AMERICA VINYL GLOVES IN PROTECTIVE GLOVES MARKET, BY REGION, 2019-2028 (THOUSAND UNITS)

TABLE 15 NORTH AMERICA VINYL GLOVES IN PROTECTIVE GLOVES MARKET, BY TYPE, 2019-2028 (USD THOUSAND)

TABLE 16 NORTH AMERICA VINYL GLOVES IN PROTECTIVE GLOVES MARKET, BY APPLICATION, 2019-2028 (USD THOUSAND)

TABLE 17 NORTH AMERICA PUNCTURE RESISTANT GLOVES IN PROTECTIVE GLOVES MARKET, BY REGION, 2019-2028 (USD THOUSAND)

TABLE 18 NORTH AMERICA PUNCTURE RESISTANT GLOVES IN PROTECTIVE GLOVES MARKET, BY REGION, 2019-2028 (THOUSAND UNITS)

TABLE 19 NORTH AMERICA PUNCTURE RESISTANT GLOVES IN PROTECTIVE GLOVES MARKET, BY TYPE, 2019-2028 (USD THOUSAND)

TABLE 20 NORTH AMERICA PUNCTURE RESISTANT GLOVES IN PROTECTIVE GLOVES MARKET, BY APPLICATION, 2019-2028 (USD THOUSAND)

TABLE 21 NORTH AMERICA POLYETHYLENE GLOVES IN PROTECTIVE GLOVES MARKET, BY REGION, 2019-2028 (USD THOUSAND)

TABLE 22 NORTH AMERICA POLYETHYLENE GLOVES IN PROTECTIVE GLOVES MARKET, BY REGION, 2019-2028 (THOUSAND UNITS)

TABLE 23 NORTH AMERICA POLYETHYLENE GLOVES IN PROTECTIVE GLOVES MARKET, BY TYPE, 2019-2028 (USD THOUSAND)

TABLE 24 NORTH AMERICA PUNCTURE RESISTANT GLOVES IN PROTECTIVE GLOVES MARKET, BY APPLICATION, 2019-2028 (USD THOUSAND)

TABLE 25 NORTH AMERICA COTTON FABRIC GLOVES IN PROTECTIVE GLOVES MARKET, BY REGION, 2019-2028 (USD THOUSAND)

TABLE 26 NORTH AMERICA COTTON FABRIC GLOVES IN PROTECTIVE GLOVES MARKET, BY REGION, 2019-2028 (THOUSAND UNITS)

TABLE 27 NORTH AMERICA COTTON FABRIC GLOVES IN PROTECTIVE GLOVES MARKET, BY TYPE, 2019-2028 (USD THOUSAND)

TABLE 28 NORTH AMERICA COTTON FABRIC GLOVES IN PROTECTIVE GLOVES MARKET, BY APPLICATION, 2019-2028 (USD THOUSAND)

TABLE 29 NORTH AMERICA BUTYL GLOVES IN PROTECTIVE GLOVES MARKET, BY REGION, 2019-2028 (USD THOUSAND)

TABLE 30 NORTH AMERICA BUTYL GLOVES IN PROTECTIVE GLOVES MARKET, BY REGION, 2019-2028 (THOUSAND UNITS)

TABLE 31 NORTH AMERICA BUTYL GLOVES IN PROTECTIVE GLOVES MARKET, BY TYPE, 2019-2028 (USD THOUSAND)

TABLE 32 NORTH AMERICA BUTYL GLOVES IN PROTECTIVE GLOVES MARKET, BY APPLICATION, 2019-2028 (USD THOUSAND)

TABLE 33 NORTH AMERICA ALUMINIZED GLOVES IN PROTECTIVE GLOVES MARKET, BY REGION, 2019-2028 (USD THOUSAND)

TABLE 34 NORTH AMERICA ALUMINIZED GLOVES IN PROTECTIVE GLOVES MARKET, BY REGION, 2019-2028 (THOUSAND UNITS)

TABLE 35 NORTH AMERICA ALUMINIZED GLOVES IN PROTECTIVE GLOVES MARKET, BY TYPE, 2019-2028 (USD THOUSAND)

TABLE 36 NORTH AMERICA ALUMINIZED GLOVES IN PROTECTIVE GLOVES MARKET, BY APPLICATION, 2019-2028 (USD THOUSAND)

TABLE 37 NORTH AMERICA NEOPRENE GLOVES IN PROTECTIVE GLOVES MARKET, BY REGION, 2019-2028 (USD THOUSAND)

TABLE 38 NORTH AMERICA NEOPRENE GLOVES IN PROTECTIVE GLOVES MARKET, BY REGION, 2019-2028 (THOUSAND UNITS)

TABLE 39 NORTH AMERICA NEOPRENE GLOVES IN PROTECTIVE GLOVES MARKET, BY TYPE, 2019-2028 (USD THOUSAND)

TABLE 40 NORTH AMERICA NEOPRENE GLOVES IN PROTECTIVE GLOVES MARKET, BY APPLICATION, 2019-2028 (USD THOUSAND)

TABLE 41 NORTH AMERICA KEVLAR GLOVES IN PROTECTIVE GLOVES MARKET, BY REGION, 2019-2028 (USD THOUSAND)

TABLE 42 NORTH AMERICA KEVLAR GLOVES IN PROTECTIVE GLOVES MARKET, BY REGION, 2019-2028 (THOUSAND UNITS)

TABLE 43 NORTH AMERICA KEVLAR GLOVES IN PROTECTIVE GLOVES MARKET, BY TYPE, 2019-2028 (USD THOUSAND)

TABLE 44 NORTH AMERICA KEVLAR GLOVES IN PROTECTIVE GLOVES MARKET, BY APPLICATION, 2019-2028 (USD THOUSAND)

TABLE 45 NORTH AMERICA LEATHER GLOVES IN PROTECTIVE GLOVES MARKET, BY REGION, 2019-2028 (USD THOUSAND)

TABLE 46 NORTH AMERICA LEATHER GLOVES IN PROTECTIVE GLOVES MARKET, BY REGION, 2019-2028 (THOUSAND UNITS)

TABLE 47 NORTH AMERICA LEATHER GLOVES IN PROTECTIVE GLOVES MARKET, BY TYPE, 2019-2028 (USD THOUSAND)

TABLE 48 NORTH AMERICA LEATHER GLOVES IN PROTECTIVE GLOVES MARKET, BY APPLICATION, 2019-2028 (USD THOUSAND)

TABLE 49 NORTH AMERICA OTHERS IN PROTECTIVE GLOVES MARKET, BY REGION, 2019-2028 (USD THOUSAND)

TABLE 50 NORTH AMERICA OTHERS IN PROTECTIVE GLOVES MARKET, BY REGION, 2019-2028 (THOUSAND UNITS)

TABLE 51 NORTH AMERICA OTHERS IN PROTECTIVE GLOVES MARKET, BY TYPE, 2019-2028 (USD THOUSAND)

TABLE 52 NORTH AMERICA OTHERS IN PROTECTIVE GLOVES MARKET, BY APPLICATION, 2019-2028 (USD THOUSAND)

TABLE 53 NORTH AMERICA PROTECTIVE GLOVES MARKET, BY TYPE, 2019-2028 (USD THOUSAND)

TABLE 54 NORTH AMERICA DISPOSABLE IN PROTECTIVE GLOVES MARKET, BY REGION, 2019-2028 (USD THOUSAND)

TABLE 55 NORTH AMERICA REUSABLE IN PROTECTIVE GLOVES MARKET, BY REGION, 2019-2028 (USD THOUSAND)

TABLE 56 NORTH AMERICA PROTECTIVE GLOVES MARKET, BY APPLICATION, 2019-2028 (USD THOUSAND)

TABLE 57 NORTH AMERICA BIOLOGICAL IN PROTECTIVE GLOVES MARKET, BY REGION, 2019-2028 (USD THOUSAND)

TABLE 58 NORTH AMERICA CHEMICAL IN PROTECTIVE GLOVES MARKET, BY REGION, 2019-2028 (USD THOUSAND)

TABLE 59 NORTH AMERICA MECHANICAL IN PROTECTIVE GLOVES MARKET, BY REGION, 2019-2028 (USD THOUSAND)

TABLE 60 NORTH AMERICA MECHANICAL IMPACT PROTECTION IN PROTECTIVE GLOVES MARKET, BY APPLICATION, 2019-2028 (USD THOUSAND)

TABLE 61 NORTH AMERICA THERMAL IN PROTECTIVE GLOVES MARKET, BY REGION, 2019-2028 (USD THOUSAND)

TABLE 62 NORTH AMERICA ANTI-STATIC IN PROTECTIVE GLOVES MARKET, BY REGION, 2019-2028 (USD THOUSAND)

TABLE 63 NORTH AMERICA OTHERS IN PROTECTIVE GLOVES MARKET, BY REGION, 2019-2028 (USD THOUSAND)

TABLE 64 NORTH AMERICA PROTECTIVE GLOVES MARKET, BY DISTRIBUTION CHANNEL, 2019-2028 (USD THOUSAND)

TABLE 65 NORTH AMERICA RETAIL IN PROTECTIVE GLOVES MARKET, BY REGION, 2019-2028 (USD THOUSAND)

TABLE 66 NORTH AMERICA RETAIL IN PROTECTIVE GLOVES MARKET, BY DISTRIBUTION CHANNEL, 2019-2028 (USD THOUSAND)

TABLE 67 NORTH AMERICA DIRECT SALES/B2B IN PROTECTIVE GLOVES MARKET, BY REGION, 2019-2028 (USD THOUSAND)

TABLE 68 NORTH AMERICA PROTECTIVE GLOVES MARKET, BY END-USER, 2019-2028 (USD THOUSAND)

TABLE 69 NORTH AMERICA HEALTHCARE IN PROTECTIVE GLOVES MARKET, BY REGION, 2019-2028 (USD THOUSAND)

TABLE 70 NORTH AMERICA HEALTHCARE IN PROTECTIVE GLOVES MARKET, BY TYPE, 2019-2028 (USD THOUSAND)

TABLE 71 NORTH AMERICA FOOD AND BEVERAGE IN PROTECTIVE GLOVES MARKET, BY REGION, 2019-2028 (USD THOUSAND)

TABLE 72 NORTH AMERICA FOOD AND BEVERAGE IN PROTECTIVE GLOVES MARKET, BY TYPE, 2019-2028 (USD THOUSAND)

TABLE 73 NORTH AMERICA OIL AND GAS IN PROTECTIVE GLOVES MARKET, BY REGION, 2019-2028 (USD THOUSAND)

TABLE 74 NORTH AMERICA OIL AND GAS IN PROTECTIVE GLOVES MARKET, BY TYPE, 2019-2028 (USD THOUSAND)

TABLE 75 NORTH AMERICA TRANSPORTATION IN PROTECTIVE GLOVES MARKET, BY REGION, 2019-2028 (USD THOUSAND)

TABLE 76 NORTH AMERICA TRANSPORTATION IN PROTECTIVE GLOVES MARKET, BY TYPE, 2019-2028 (USD THOUSAND)

TABLE 77 NORTH AMERICA FIRE PROTECTION IN PROTECTIVE GLOVES MARKET, BY REGION, 2019-2028 (USD THOUSAND)

TABLE 78 NORTH AMERICA FIRE PROTECTION IN PROTECTIVE GLOVES MARKET, BY TYPE, 2019-2028 (USD THOUSAND)

TABLE 79 NORTH AMERICA CONSTRUCTION IN PROTECTIVE GLOVES MARKET, BY REGION, 2019-2028 (USD THOUSAND)

TABLE 80 NORTH AMERICA CONSTRUCTION IN PROTECTIVE GLOVES MARKET, BY TYPE, 2019-2028 (USD THOUSAND)

TABLE 81 NORTH AMERICA MANUFACTURING IN PROTECTIVE GLOVES MARKET, BY REGION, 2019-2028 (USD THOUSAND)

TABLE 82 NORTH AMERICA MANUFACTURING IN PROTECTIVE GLOVES MARKET, BY TYPE, 2019-2028 (USD THOUSAND)

TABLE 83 NORTH AMERICA SPORTS IN PROTECTIVE GLOVES MARKET, BY REGION, 2019-2028 (USD THOUSAND)

TABLE 84 NORTH AMERICA SPORTS IN PROTECTIVE GLOVES MARKET, BY TYPE, 2019-2028 (USD THOUSAND)

TABLE 85 NORTH AMERICA MILITARY IN PROTECTIVE GLOVES MARKET, BY REGION, 2019-2028 (USD THOUSAND)

TABLE 86 NORTH AMERICA MILITARY IN PROTECTIVE GLOVES MARKET, BY TYPE, 2019-2028 (USD THOUSAND)

TABLE 87 NORTH AMERICA MINING IN PROTECTIVE GLOVES MARKET, BY REGION, 2019-2028 (USD THOUSAND)

TABLE 88 NORTH AMERICA MINING IN PROTECTIVE GLOVES MARKET, BY TYPE, 2019-2028 (USD THOUSAND)

TABLE 89 NORTH AMERICA OTHERS IN PROTECTIVE GLOVES MARKET, BY REGION, 2019-2028 (USD THOUSAND)

TABLE 90 NORTH AMERICA OTHERS IN PROTECTIVE GLOVES MARKET, BY TYPE, 2019-2028 (USD THOUSAND)

TABLE 91 NORTH AMERICA PROTECTIVE GLOVES MARKET, BY COUNTRY, 2019-2028 (USD THOUSAND)

TABLE 92 NORTH AMERICA PROTECTIVE GLOVES MARKET, BY COUNTRY, 2019-2028 (THOUSAND UNITS)

TABLE 93 NORTH AMERICA PROTECTIVE GLOVES MARKET, BY PRODUCT, 2019-2028 (USD THOUSAND)

TABLE 94 NORTH AMERICA PROTECTIVE GLOVES MARKET, BY PRODUCT, 2019-2028 (THOUSAND UNITS)

TABLE 95 NORTH AMERICA NITRILE GLOVES IN PROTECTIVE GLOVES MARKET, BY TYPE, 2019-2028 (USD THOUSAND)

TABLE 96 NORTH AMERICA NITRILE GLOVES IN PROTECTIVE GLOVES MARKET, BY APPLICATION, 2019-2028 (USD THOUSAND)

TABLE 97 NORTH AMERICA LATEX GLOVES IN PROTECTIVE GLOVES MARKET, BY TYPE, 2019-2028 (USD THOUSAND)

TABLE 98 NORTH AMERICA LATEX GLOVES IN PROTECTIVE GLOVES MARKET, BY APPLICATION, 2019-2028 (USD THOUSAND)

TABLE 99 NORTH AMERICA VINYL GLOVES IN PROTECTIVE GLOVES MARKET, BY TYPE, 2019-2028 (USD THOUSAND)

TABLE 100 NORTH AMERICA VINYL GLOVES IN PROTECTIVE GLOVES MARKET, BY APPLICATION, 2019-2028 (USD THOUSAND)

TABLE 101 NORTH AMERICA PUNCTURE RESISTANT GLOVES IN PROTECTIVE GLOVES MARKET, BY TYPE, 2019-2028 (USD THOUSAND)

TABLE 102 NORTH AMERICA PUNCTURE RESISTANT IN PROTECTIVE GLOVES MARKET, BY APPLICATION, 2019-2028 (USD THOUSAND)

TABLE 103 NORTH AMERICA POLYETHYLENE GLOVES IN PROTECTIVE GLOVES MARKET, BY TYPE, 2019-2028 (USD THOUSAND)

TABLE 104 NORTH AMERICA POLYETHYLENE GLOVES IN PROTECTIVE GLOVES MARKET, BY APPLICATION, 2019-2028 (USD THOUSAND)

TABLE 105 NORTH AMERICA COTTON FABRIC GLOVES IN PROTECTIVE GLOVES MARKET, BY TYPE, 2019-2028 (USD THOUSAND)

TABLE 106 NORTH AMERICA COTTON FABRIC GLOVES IN PROTECTIVE GLOVES MARKET, BY APPLICATION, 2019-2028 (USD THOUSAND)

TABLE 107 NORTH AMERICA BUTYL GLOVES IN PROTECTIVE GLOVES MARKET, BY TYPE, 2019-2028 (USD THOUSAND)

TABLE 108 NORTH AMERICA BUTYL GLOVES IN PROTECTIVE GLOVES MARKET, BY APPLICATION, 2019-2028 (USD THOUSAND)

TABLE 109 NORTH AMERICA ALUMINIZED GLOVES IN PROTECTIVE GLOVES MARKET, BY TYPE, 2019-2028 (USD THOUSAND)

TABLE 110 NORTH AMERICA ALUMINIZED GLOVES IN PROTECTIVE GLOVES MARKET, BY APPLICATION, 2019-2028 (USD THOUSAND)

TABLE 111 NORTH AMERICA NEOPRENE GLOVES IN PROTECTIVE GLOVES MARKET, BY TYPE, 2019-2028 (USD THOUSAND)

TABLE 112 NORTH AMERICA NEOPRENE GLOVES IN PROTECTIVE GLOVES MARKET, BY APPLICATION, 2019-2028 (USD THOUSAND)

TABLE 113 NORTH AMERICA KEVLAR GLOVES IN PROTECTIVE GLOVES MARKET, BY TYPE, 2019-2028 (USD THOUSAND)

TABLE 114 NORTH AMERICA KEVLAR GLOVES IN PROTECTIVE GLOVES MARKET, BY APPLICATION, 2019-2028 (USD THOUSAND)

TABLE 115 NORTH AMERICA LEATHER GLOVES IN PROTECTIVE GLOVES MARKET, BY TYPE, 2019-2028 (USD THOUSAND)

TABLE 116 NORTH AMERICA LEATHER GLOVES IN PROTECTIVE GLOVES MARKET, BY APPLICATION, 2019-2028 (USD THOUSAND)

TABLE 117 NORTH AMERICA OTHERS IN PROTECTIVE GLOVES MARKET, BY TYPE, 2019-2028 (USD THOUSAND)

TABLE 118 NORTH AMERICA OTHERS IN PROTECTIVE GLOVES MARKET, BY APPLICATION, 2019-2028 (USD THOUSAND)

TABLE 119 NORTH AMERICA PROTECTIVE GLOVES MARKET, BY TYPE, 2019-2028 (USD THOUSAND)

TABLE 120 NORTH AMERICA PROTECTIVE GLOVES MARKET, BY APPLICATION, 2019-2028 (USD THOUSAND)

TABLE 121 NORTH AMERICA MECHANICAL IMPACT PROTECTION IN PROTECTIVE GLOVES MARKET, BY APPLICATION, 2019-2028 (USD THOUSAND)

TABLE 122 NORTH AMERICA PROTECTIVE GLOVES MARKET, BY DISTRIBUTION CHANNEL, 2019-2028 (USD THOUSAND)

TABLE 123 NORTH AMERICA RETAIL IN PROTECTIVE GLOVES MARKET, BY DISTRIBUTION CHANNEL, 2019-2028 (USD THOUSAND)

TABLE 124 NORTH AMERICA PROTECTIVE GLOVES MARKET, BY END-USER, 2019-2028 (USD THOUSAND)

TABLE 125 NORTH AMERICA HEALTHCARE IN PROTECTIVE GLOVES MARKET, BY TYPE, 2019-2028 (USD THOUSAND)

TABLE 126 NORTH AMERICA FOOD AND BEVERAGE IN PROTECTIVE GLOVES MARKET, BY TYPE, 2019-2028 (USD THOUSAND)

TABLE 127 NORTH AMERICA OIL & GAS IN PROTECTIVE GLOVES MARKET, BY TYPE, 2019-2028 (USD THOUSAND)

TABLE 128 NORTH AMERICA TRANSPORTATION IN PROTECTIVE GLOVES MARKET, BY TYPE, 2019-2028 (USD THOUSAND)

TABLE 129 NORTH AMERICA FIRE PROTECTION IN PROTECTIVE GLOVES MARKET, BY TYPE, 2019-2028 (USD THOUSAND)

TABLE 130 NORTH AMERICA CONSTRUCTION IN PROTECTIVE GLOVES MARKET, BY TYPE, 2019-2028 (USD THOUSAND)

TABLE 131 NORTH AMERICA MANUFACTURING IN PROTECTIVE GLOVES MARKET, BY TYPE, 2019-2028 (USD THOUSAND)

TABLE 132 NORTH AMERICA SPORTS IN PROTECTIVE GLOVES MARKET, BY TYPE, 2019-2028 (USD THOUSAND)

TABLE 133 NORTH AMERICA MILITARY IN PROTECTIVE GLOVES MARKET, BY TYPE, 2019-2028 (USD THOUSAND)

TABLE 134 NORTH AMERICA MINING IN PROTECTIVE GLOVES MARKET, BY TYPE, 2019-2028 (USD THOUSAND)

TABLE 135 NORTH AMERICA OTHERS IN PROTECTIVE GLOVES MARKET, BY TYPE, 2019-2028 (USD THOUSAND)

TABLE 136 U.S. PROTECTIVE GLOVES MARKET, BY PRODUCT, 2019-2028 (USD THOUSAND)

TABLE 137 U.S. PROTECTIVE GLOVES MARKET, BY PRODUCT, 2019-2028 (THOUSAND UNITS)

TABLE 138 U.S. NITRILE GLOVES IN PROTECTIVE GLOVES MARKET, BY TYPE, 2019-2028 (USD THOUSAND)

TABLE 139 U.S. NITRILE GLOVES IN PROTECTIVE GLOVES MARKET, BY APPLICATION, 2019-2028 (USD THOUSAND)

TABLE 140 U.S. LATEX GLOVES IN PROTECTIVE GLOVES MARKET, BY TYPE, 2019-2028 (USD THOUSAND)

TABLE 141 U.S. LATEX GLOVES IN PROTECTIVE GLOVES MARKET, BY APPLICATION, 2019-2028 (USD THOUSAND)

TABLE 142 U.S. VINYL GLOVES IN PROTECTIVE GLOVES MARKET, BY TYPE, 2019-2028 (USD THOUSAND)

TABLE 143 U.S. VINYL GLOVES IN PROTECTIVE GLOVES MARKET, BY APPLICATION, 2019-2028 (USD THOUSAND)

TABLE 144 U.S. PUNCTURE RESISTANT GLOVES IN PROTECTIVE GLOVES MARKET, BY TYPE, 2019-2028 (USD THOUSAND)

TABLE 145 U.S. PUNCTURE RESISTANT IN PROTECTIVE GLOVES MARKET, BY APPLICATION, 2019-2028 (USD THOUSAND)

TABLE 146 U.S. POLYETHYLENE GLOVES IN PROTECTIVE GLOVES MARKET, BY TYPE, 2019-2028 (USD THOUSAND)

TABLE 147 U.S. POLYETHYLENE GLOVES IN PROTECTIVE GLOVES MARKET, BY APPLICATION, 2019-2028 (USD THOUSAND)

TABLE 148 U.S. COTTON FABRIC GLOVES IN PROTECTIVE GLOVES MARKET, BY TYPE, 2019-2028 (USD THOUSAND)

TABLE 149 U.S. COTTON FABRIC GLOVES IN PROTECTIVE GLOVES MARKET, BY APPLICATION, 2019-2028 (USD THOUSAND)

TABLE 150 U.S. BUTYL GLOVES IN PROTECTIVE GLOVES MARKET, BY TYPE, 2019-2028 (USD THOUSAND)

TABLE 151 U.S. BUTYL GLOVES IN PROTECTIVE GLOVES MARKET, BY APPLICATION, 2019-2028 (USD THOUSAND)

TABLE 152 U.S. ALUMINIZED GLOVES IN PROTECTIVE GLOVES MARKET, BY TYPE, 2019-2028 (USD THOUSAND)

TABLE 153 U.S. ALUMINIZED GLOVES IN PROTECTIVE GLOVES MARKET, BY APPLICATION, 2019-2028 (USD THOUSAND)

TABLE 154 U.S. NEOPRENE GLOVES IN PROTECTIVE GLOVES MARKET, BY TYPE, 2019-2028 (USD THOUSAND)

TABLE 155 U.S. NEOPRENE GLOVES IN PROTECTIVE GLOVES MARKET, BY APPLICATION, 2019-2028 (USD THOUSAND)

TABLE 156 U.S. KEVLAR GLOVES IN PROTECTIVE GLOVES MARKET, BY TYPE, 2019-2028 (USD THOUSAND)

TABLE 157 U.S. KEVLAR GLOVES IN PROTECTIVE GLOVES MARKET, BY APPLICATION, 2019-2028 (USD THOUSAND)

TABLE 158 U.S. LEATHER GLOVES IN PROTECTIVE GLOVES MARKET, BY TYPE, 2019-2028 (USD THOUSAND)

TABLE 159 U.S. LEATHER GLOVES IN PROTECTIVE GLOVES MARKET, BY APPLICATION, 2019-2028 (USD THOUSAND)

TABLE 160 U.S. OTHERS IN PROTECTIVE GLOVES MARKET, BY TYPE, 2019-2028 (USD THOUSAND)

TABLE 161 U.S. OTHERS IN PROTECTIVE GLOVES MARKET, BY APPLICATION, 2019-2028 (USD THOUSAND)

TABLE 162 U.S. PROTECTIVE GLOVES MARKET, BY TYPE, 2019-2028 (USD THOUSAND)

TABLE 163 U.S. PROTECTIVE GLOVES MARKET, BY APPLICATION, 2019-2028 (USD THOUSAND)

TABLE 164 U.S. MECHANICAL IMPACT PROTECTION IN PROTECTIVE GLOVES MARKET, BY APPLICATION, 2019-2028 (USD THOUSAND)

TABLE 165 U.S. PROTECTIVE GLOVES MARKET, BY DISTRIBUTION CHANNEL, 2019-2028 (USD THOUSAND)

TABLE 166 U.S. RETAIL IN PROTECTIVE GLOVES MARKET, BY DISTRIBUTION CHANNEL, 2019-2028 (USD THOUSAND)

TABLE 167 U.S. PROTECTIVE GLOVES MARKET, BY END-USER, 2019-2028 (USD THOUSAND)

TABLE 168 U.S. HEALTHCARE IN PROTECTIVE GLOVES MARKET, BY TYPE, 2019-2028 (USD THOUSAND)

TABLE 169 U.S. FOOD AND BEVERAGE IN PROTECTIVE GLOVES MARKET, BY TYPE, 2019-2028 (USD THOUSAND)

TABLE 170 U.S. OIL & GAS IN PROTECTIVE GLOVES MARKET, BY TYPE, 2019-2028 (USD THOUSAND)

TABLE 171 U.S. TRANSPORTATION IN PROTECTIVE GLOVES MARKET, BY TYPE, 2019-2028 (USD THOUSAND)

TABLE 172 U.S. FIRE PROTECTION IN PROTECTIVE GLOVES MARKET, BY TYPE, 2019-2028 (USD THOUSAND)

TABLE 173 U.S. CONSTRUCTION IN PROTECTIVE GLOVES MARKET, BY TYPE, 2019-2028 (USD THOUSAND)

TABLE 174 U.S. MANUFACTURING IN PROTECTIVE GLOVES MARKET, BY TYPE, 2019-2028 (USD THOUSAND)

TABLE 175 U.S. SPORTS IN PROTECTIVE GLOVES MARKET, BY TYPE, 2019-2028 (USD THOUSAND)

TABLE 176 U.S. MILITARY IN PROTECTIVE GLOVES MARKET, BY TYPE, 2019-2028 (USD THOUSAND)

TABLE 177 U.S. MINING IN PROTECTIVE GLOVES MARKET, BY TYPE, 2019-2028 (USD THOUSAND)

TABLE 178 U.S. OTHERS IN PROTECTIVE GLOVES MARKET, BY TYPE, 2019-2028 (USD THOUSAND)

TABLE 179 CANADA PROTECTIVE GLOVES MARKET, BY PRODUCT, 2019-2028 (USD THOUSAND)

TABLE 180 CANADA PROTECTIVE GLOVES MARKET, BY PRODUCT, 2019-2028 (THOUSAND UNITS)

TABLE 181 CANADA NITRILE GLOVES IN PROTECTIVE GLOVES MARKET, BY TYPE, 2019-2028 (USD THOUSAND)

TABLE 182 CANADA NITRILE GLOVES IN PROTECTIVE GLOVES MARKET, BY APPLICATION, 2019-2028 (USD THOUSAND)

TABLE 183 CANADA LATEX GLOVES IN PROTECTIVE GLOVES MARKET, BY TYPE, 2019-2028 (USD THOUSAND)

TABLE 184 CANADA LATEX GLOVES IN PROTECTIVE GLOVES MARKET, BY APPLICATION, 2019-2028 (USD THOUSAND)

TABLE 185 ANADA VINYL GLOVES IN PROTECTIVE GLOVES MARKET, BY TYPE, 2019-2028 (USD THOUSAND)

TABLE 186 CANADA VINYL GLOVES IN PROTECTIVE GLOVES MARKET, BY APPLICATION, 2019-2028 (USD THOUSAND)

TABLE 187 CANADA PUNCTURE RESISTANT GLOVES IN PROTECTIVE GLOVES MARKET, BY TYPE, 2019-2028 (USD THOUSAND)

TABLE 188 CANADA PUNCTURE RESISTANT IN PROTECTIVE GLOVES MARKET, BY APPLICATION, 2019-2028 (USD THOUSAND)

TABLE 189 CANADA POLYETHYLENE GLOVES IN PROTECTIVE GLOVES MARKET, BY TYPE, 2019-2028 (USD THOUSAND)

TABLE 190 CANADA POLYETHYLENE GLOVES IN PROTECTIVE GLOVES MARKET, BY APPLICATION, 2019-2028 (USD THOUSAND)

TABLE 191 CANADA COTTON FABRIC GLOVES IN PROTECTIVE GLOVES MARKET, BY TYPE, 2019-2028 (USD THOUSAND)

TABLE 192 CANADA COTTON FABRIC GLOVES IN PROTECTIVE GLOVES MARKET, BY APPLICATION, 2019-2028 (USD THOUSAND)

TABLE 193 CANADA BUTYL GLOVES IN PROTECTIVE GLOVES MARKET, BY TYPE, 2019-2028 (USD THOUSAND)

TABLE 194 CANADA BUTYL GLOVES IN PROTECTIVE GLOVES MARKET, BY APPLICATION, 2019-2028 (USD THOUSAND)

TABLE 195 CANADA ALUMINIZED GLOVES IN PROTECTIVE GLOVES MARKET, BY TYPE, 2019-2028 (USD THOUSAND)

TABLE 196 CANADA ALUMINIZED GLOVES IN PROTECTIVE GLOVES MARKET, BY APPLICATION, 2019-2028 (USD THOUSAND)

TABLE 197 CANADA NEOPRENE GLOVES IN PROTECTIVE GLOVES MARKET, BY TYPE, 2019-2028 (USD THOUSAND)

TABLE 198 CANADA NEOPRENE GLOVES IN PROTECTIVE GLOVES MARKET, BY APPLICATION, 2019-2028 (USD THOUSAND)

TABLE 199 CANADA KEVLAR GLOVES IN PROTECTIVE GLOVES MARKET, BY TYPE, 2019-2028 (USD THOUSAND)

TABLE 200 CANADA KEVLAR GLOVES IN PROTECTIVE GLOVES MARKET, BY APPLICATION, 2019-2028 (USD THOUSAND)

TABLE 201 CANADA LEATHER GLOVES IN PROTECTIVE GLOVES MARKET, BY TYPE, 2019-2028 (USD THOUSAND)

TABLE 202 CANADA LEATHER GLOVES IN PROTECTIVE GLOVES MARKET, BY APPLICATION, 2019-2028 (USD THOUSAND)

TABLE 203 CANADA OTHERS IN PROTECTIVE GLOVES MARKET, BY TYPE, 2019-2028 (USD THOUSAND)

TABLE 204 CANADA OTHERS IN PROTECTIVE GLOVES MARKET, BY APPLICATION, 2019-2028 (USD THOUSAND)

TABLE 205 CANADA PROTECTIVE GLOVES MARKET, BY TYPE, 2019-2028 (USD THOUSAND)

TABLE 206 CANADA PROTECTIVE GLOVES MARKET, BY APPLICATION, 2019-2028 (USD THOUSAND)

TABLE 207 CANADA MECHANICAL IMPACT PROTECTION IN PROTECTIVE GLOVES MARKET, BY APPLICATION, 2019-2028 (USD THOUSAND)

TABLE 208 CANADA PROTECTIVE GLOVES MARKET, BY DISTRIBUTION CHANNEL, 2019-2028 (USD THOUSAND)

TABLE 209 CANADA RETAIL IN PROTECTIVE GLOVES MARKET, BY DISTRIBUTION CHANNEL, 2019-2028 (USD THOUSAND)

TABLE 210 CANADA PROTECTIVE GLOVES MARKET, BY END-USER, 2019-2028 (USD THOUSAND)

TABLE 211 CANADA HEALTHCARE IN PROTECTIVE GLOVES MARKET, BY TYPE, 2019-2028 (USD THOUSAND)

TABLE 212 CANADA FOOD AND BEVERAGE IN PROTECTIVE GLOVES MARKET, BY TYPE, 2019-2028 (USD THOUSAND)

TABLE 213 CANADA OIL & GAS IN PROTECTIVE GLOVES MARKET, BY TYPE, 2019-2028 (USD THOUSAND)

TABLE 214 CANADA TRANSPORTATION IN PROTECTIVE GLOVES MARKET, BY TYPE, 2019-2028 (USD THOUSAND)

TABLE 215 CANADA FIRE PROTECTION IN PROTECTIVE GLOVES MARKET, BY TYPE, 2019-2028 (USD THOUSAND)

TABLE 216 CANADA CONSTRUCTION IN PROTECTIVE GLOVES MARKET, BY TYPE, 2019-2028 (USD THOUSAND)

TABLE 217 CANADA MANUFACTURING IN PROTECTIVE GLOVES MARKET, BY TYPE, 2019-2028 (USD THOUSAND)

TABLE 218 CANADA SPORTS IN PROTECTIVE GLOVES MARKET, BY TYPE, 2019-2028 (USD THOUSAND)

TABLE 219 CANADA MILITARY IN PROTECTIVE GLOVES MARKET, BY TYPE, 2019-2028 (USD THOUSAND)

TABLE 220 CANADA MINING IN PROTECTIVE GLOVES MARKET, BY TYPE, 2019-2028 (USD THOUSAND)

TABLE 221 CANADA OTHERS IN PROTECTIVE GLOVES MARKET, BY TYPE, 2019-2028 (USD THOUSAND)

TABLE 222 MEXICO PROTECTIVE GLOVES MARKET, BY PRODUCT, 2019-2028 (USD THOUSAND)

TABLE 223 MEXICO PROTECTIVE GLOVES MARKET, BY PRODUCT, 2019-2028 (THOUSAND UNITS)

TABLE 224 MEXICO NITRILE GLOVES IN PROTECTIVE GLOVES MARKET, BY TYPE, 2019-2028 (USD THOUSAND)

TABLE 225 MEXICO NITRILE GLOVES IN PROTECTIVE GLOVES MARKET, BY APPLICATION, 2019-2028 (USD THOUSAND)

TABLE 226 MEXICO LATEX GLOVES IN PROTECTIVE GLOVES MARKET, BY TYPE, 2019-2028 (USD THOUSAND)

TABLE 227 MEXICO LATEX GLOVES IN PROTECTIVE GLOVES MARKET, BY APPLICATION, 2019-2028 (USD THOUSAND)

TABLE 228 MEXICO VINYL GLOVES IN PROTECTIVE GLOVES MARKET, BY TYPE, 2019-2028 (USD THOUSAND)

TABLE 229 MEXICO VINYL GLOVES IN PROTECTIVE GLOVES MARKET, BY APPLICATION, 2019-2028 (USD THOUSAND)

TABLE 230 MEXICO PUNCTURE RESISTANT GLOVES IN PROTECTIVE GLOVES MARKET, BY TYPE, 2019-2028 (USD THOUSAND)

TABLE 231 MEXICO PUNCTURE RESISTANT IN PROTECTIVE GLOVES MARKET, BY APPLICATION, 2019-2028 (USD THOUSAND)

TABLE 232 MEXICO POLYETHYLENE GLOVES IN PROTECTIVE GLOVES MARKET, BY TYPE, 2019-2028 (USD THOUSAND)

TABLE 233 MEXICO POLYETHYLENE GLOVES IN PROTECTIVE GLOVES MARKET, BY APPLICATION, 2019-2028 (USD THOUSAND)

TABLE 234 MEXICO COTTON FABRIC GLOVES IN PROTECTIVE GLOVES MARKET, BY TYPE, 2019-2028 (USD THOUSAND)

TABLE 235 MEXICO COTTON FABRIC GLOVES IN PROTECTIVE GLOVES MARKET, BY APPLICATION, 2019-2028 (USD THOUSAND)

TABLE 236 MEXICO BUTYL GLOVES IN PROTECTIVE GLOVES MARKET, BY TYPE, 2019-2028 (USD THOUSAND)

TABLE 237 MEXICO BUTYL GLOVES IN PROTECTIVE GLOVES MARKET, BY APPLICATION, 2019-2028 (USD THOUSAND)

TABLE 238 MEXICO ALUMINIZED GLOVES IN PROTECTIVE GLOVES MARKET, BY TYPE, 2019-2028 (USD THOUSAND)

TABLE 239 MEXICO ALUMINIZED GLOVES IN PROTECTIVE GLOVES MARKET, BY APPLICATION, 2019-2028 (USD THOUSAND)

TABLE 240 MEXICO NEOPRENE GLOVES IN PROTECTIVE GLOVES MARKET, BY TYPE, 2019-2028 (USD THOUSAND)

TABLE 241 MEXICO NEOPRENE GLOVES IN PROTECTIVE GLOVES MARKET, BY APPLICATION, 2019-2028 (USD THOUSAND)

TABLE 242 MEXICO KEVLAR GLOVES IN PROTECTIVE GLOVES MARKET, BY TYPE, 2019-2028 (USD THOUSAND)

TABLE 243 MEXICO KEVLAR GLOVES IN PROTECTIVE GLOVES MARKET, BY APPLICATION, 2019-2028 (USD THOUSAND)

TABLE 244 MEXICO LEATHER GLOVES IN PROTECTIVE GLOVES MARKET, BY TYPE, 2019-2028 (USD THOUSAND)

TABLE 245 MEXICO LEATHER GLOVES IN PROTECTIVE GLOVES MARKET, BY APPLICATION, 2019-2028 (USD THOUSAND)

TABLE 246 MEXICO OTHERS IN PROTECTIVE GLOVES MARKET, BY TYPE, 2019-2028 (USD THOUSAND)

TABLE 247 MEXICO OTHERS IN PROTECTIVE GLOVES MARKET, BY APPLICATION, 2019-2028 (USD THOUSAND)

TABLE 248 MEXICO PROTECTIVE GLOVES MARKET, BY TYPE, 2019-2028 (USD THOUSAND)

TABLE 249 MEXICO PROTECTIVE GLOVES MARKET, BY APPLICATION, 2019-2028 (USD THOUSAND)

TABLE 250 MEXICO MECHANICAL IMPACT PROTECTION IN PROTECTIVE GLOVES MARKET, BY APPLICATION, 2019-2028 (USD THOUSAND)

TABLE 251 MEXICO PROTECTIVE GLOVES MARKET, BY DISTRIBUTION CHANNEL, 2019-2028 (USD THOUSAND)

TABLE 252 MEXICO RETAIL IN PROTECTIVE GLOVES MARKET, BY DISTRIBUTION CHANNEL, 2019-2028 (USD THOUSAND)

TABLE 253 MEXICO PROTECTIVE GLOVES MARKET, BY END-USER, 2019-2028 (USD THOUSAND)

TABLE 254 MEXICO HEALTHCARE IN PROTECTIVE GLOVES MARKET, BY TYPE, 2019-2028 (USD THOUSAND)

TABLE 255 MEXICO FOOD AND BEVERAGE IN PROTECTIVE GLOVES MARKET, BY TYPE, 2019-2028 (USD THOUSAND)

TABLE 256 MEXICO OIL & GAS IN PROTECTIVE GLOVES MARKET, BY TYPE, 2019-2028 (USD THOUSAND)

TABLE 257 MEXICO TRANSPORTATION IN PROTECTIVE GLOVES MARKET, BY TYPE, 2019-2028 (USD THOUSAND)

TABLE 258 MEXICO FIRE PROTECTION IN PROTECTIVE GLOVES MARKET, BY TYPE, 2019-2028 (USD THOUSAND)

TABLE 259 MEXICO CONSTRUCTION IN PROTECTIVE GLOVES MARKET, BY TYPE, 2019-2028 (USD THOUSAND)

TABLE 260 MEXICO MANUFACTURING IN PROTECTIVE GLOVES MARKET, BY TYPE, 2019-2028 (USD THOUSAND)

TABLE 261 MEXICO SPORTS IN PROTECTIVE GLOVES MARKET, BY TYPE, 2019-2028 (USD THOUSAND)

TABLE 262 MEXICO MILITARY IN PROTECTIVE GLOVES MARKET, BY TYPE, 2019-2028 (USD THOUSAND)

TABLE 263 MEXICO MINING IN PROTECTIVE GLOVES MARKET, BY TYPE, 2019-2028 (USD THOUSAND)

TABLE 264 MEXICO OTHERS IN PROTECTIVE GLOVES MARKET, BY TYPE, 2019-2028 (USD THOUSAND)


Please fill in the below form for Infographics

By clicking the "Submit" button, you are agreeing to the Data Bridge Market Research Privacy Policy and Terms and Conditions

Research Methodology:

Data collection and base year analysis are done using data collection modules with large sample sizes. The stage includes obtaining market information or related data through various sources and strategies. It includes examining and planning all the data acquired from the past in advance. It likewise envelops the examination of information inconsistencies seen across different information sources. The market data is analysed and estimated using market statistical and coherent models. Also, market share analysis and key trend analysis are the major success factors in the market report. To know more, please request an analyst call or drop down your inquiry.

The key research methodology used by DBMR research team is data triangulation which involves data mining, analysis of the impact of data variables on the market and primary (industry expert) validation. Data models include Vendor Positioning Grid, Market Time Line Analysis, Market Overview and Guide, Company Positioning Grid, Patent Analysis, Pricing Analysis, Company Market Share Analysis, Standards of Measurement, Global versus Regional and Vendor Share Analysis. To know more about the research methodology, drop in an inquiry to speak to our industry experts.

Please fill in the below form for Research Methodology

By clicking the "Submit" button, you are agreeing to the Data Bridge Market Research Privacy Policy and Terms and Conditions

Customization Available:

Data Bridge Market Research is a leader in advanced formative research. We take pride in servicing our existing and new customers with data and analysis that match and suits their goal. The report can be customized to include price trend analysis of target brands understanding the market for additional countries (ask for the list of countries), clinical trial results data, literature review, refurbished market and product base analysis. Market analysis of target competitors can be analyzed from technology-based analysis to market portfolio strategies. We can add as many competitors that you require data about in the format and data style you are looking for. Our team of analysts can also provide you data in crude raw excel files pivot tables (Fact book) or can assist you in creating presentations from the data sets available in the report.

Please fill in the below form for Available Customization

By clicking the "Submit" button, you are agreeing to the Data Bridge Market Research Privacy Policy and Terms and Conditions

Free Sample Report

CHOOSE LICENCE TYPE

  • 4200.00
  • 3500.00
  • 2000.00
  • 5500.00
  • 7500.00

Why Choose Us

Industry Coverage

DBMR works across the globe in multiple industries which equip us with knowledge across verticals and provide our clients with insights not only from their industry but how other industries will impact their ecosystem.

Regional Coverage

Coverage of Data Bridge is not restricted to developed or emerging economies. We work across the globe covering the largest array of countries where no other market research or business consulting firm has ever conducted research; creating growth opportunities for our clients in areas which are still unknown.

Technology Coverage

In today’s world, technology drives the market sentiment, so our vision is to provide our clients insights not only for developed technologies but upcoming and disrupting technological changes throughout the product lifecycle by enabling them with unforeseen opportunities in the market which will create disruption in their industry. This leads to innovation and our clients to come out as winners.

Goal Oriented Solutions

DBMR goal is to help our clients achieve their goals through our solutions; hence we formatively create the most appropriate solutions for our client needs, saving time and efforts for them to drive their grand strategies.

Unparallel Analyst Support

Our analysts take pride in our clients’ success. Unlike others, we believe in working along our clients to achieve their goals with 24 hours analyst support determining the correct needs and inspire innovation through service.

Banner

Client Testimonials