
North America Proximity Sensor Market
Market Size in USD Billion
 USD
1.33 Billion
USD
2.46 Billion
2025
2033
USD
1.33 Billion
USD
2.46 Billion
2025
2033
| 2026 - 2033 | |
| USD 1.33 Billion | |
| USD 2.46 Billion | |
| % | |
|
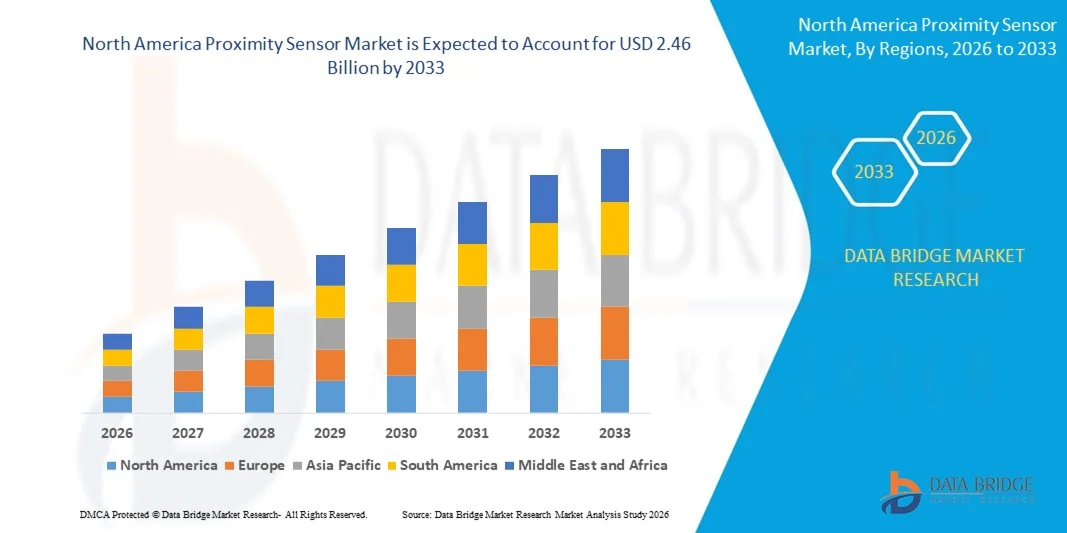
What is the North America Proximity Sensor Market Size and Growth Rate?
- The North America proximity sensor market size was valued at USD 1.33 billion in 2025 and is expected to reach USD 2.46 billion by 2033, at a CAGR of 8.00% during the forecast period
- Increasing adoption of the proximity sensors for automobile industry is acting as a driving factor for the growth of the proximity sensor market
- Proximity sensor has certain limitation in the sensing capabilities which restricts the adoption of sensors and acts as a restraining factor for the growth of the proximity sensor market
What are the Major Takeaways of Proximity Sensor Market?
- Increasing use of automation across various industries such as manufacturing, power and others were also increasing the need to adopt proximity sensors and creating a window of opportunity for the growth of the proximity sensor market
- Designing miniaturized sensors without compromising on quality acts as a challenge for the proximity sensor market growth
- The U.S. dominated the North America proximity sensor market with the largest revenue share of 52.8% in 2024, driven by strong industrial automation adoption, advanced manufacturing infrastructure, and high deployment of proximity sensors across automotive, food processing, consumer electronics, and industrial automation sectors
- The Canada proximity sensor market is witnessing fastest growth rate of 9.32%, supported by increasing automation in food processing, packaging, mining, and energy sectors
- The Inductive proximity sensor segment dominated the market with an estimated 34.6% share in 2024, owing to its extensive use in industrial automation, automotive manufacturing, and metal object detection applications
Report Scope and Proximity Sensor Market Segmentation
|
Attributes |
Proximity Sensor Key Market Insights |
|
Segments Covered |
|
|
Countries Covered |
North America
|
|
Key Market Players |
|
|
Market Opportunities |
|
|
Value Added Data Infosets |
In addition to the insights on market scenarios such as market value, growth rate, segmentation, geographical coverage, and major players, the market reports curated by the Data Bridge Market Research also include in-depth expert analysis, pricing analysis, brand share analysis, consumer survey, demography analysis, supply chain analysis, value chain analysis, raw material/consumables overview, vendor selection criteria, PESTLE Analysis, Porter Analysis, and regulatory framework. |
What is the Key Trend in the Proximity Sensor Market?
Increasing Integration of Proximity Sensors with IoT, Automation, and Smart Systems
- The global proximity sensor market is witnessing a strong trend toward integration with IoT-enabled, automated, and smart manufacturing systems across industrial, automotive, and consumer electronics sectors
- Connected proximity sensors enable real-time object detection, position monitoring, and process automation, improving system intelligence, safety, and operational efficiency
- IoT-enabled proximity sensors support predictive maintenance by detecting abnormal vibrations, misalignment, or component wear before equipment failure occurs, reducing downtime and maintenance costs
- For instance, manufacturers are deploying smart proximity sensors in automated assembly lines, robotics, and conveyor systems to enable adaptive control, real-time diagnostics, and remote monitoring
- This trend enhances production accuracy, energy efficiency, and system reliability, making proximity sensors more valuable in Industry 4.0 environments
- Advanced automation platforms analyze sensor data related to distance, speed, presence detection, and motion, enabling consistent quality control and safer machine operation
What are the Key Drivers of Proximity Sensor Market?
- Rising adoption of industrial automation, robotics, and smart manufacturing is a key driver boosting global demand for proximity sensors
- Increasing use of proximity sensors in automotive applications, including ADAS, parking assistance, collision avoidance, and electric vehicle systems, is accelerating market growth
- Growing deployment of consumer electronics, smartphones, wearables, and smart home devices is driving demand for compact and high-precision proximity sensors
- Technological advancements in inductive, capacitive, ultrasonic, and optical sensing technologies are improving detection accuracy, durability, and response time
- Expanding investments in IoT infrastructure, smart factories, and digital transformation initiatives across the U.S., Europe, and Asia-Pacific are further supporting long-term market expansion
Which Factor is Challenging the Growth of the Proximity Sensor Market?
- High initial costs associated with advanced, high-precision, and IoT-enabled proximity sensors can limit adoption among small and medium-sized enterprises
- Integration challenges related to sensor calibration, system compatibility, and signal interference increase deployment complexity in existing industrial setups
- Data security and reliability concerns arise as connected proximity sensors transmit operational data across industrial networks, increasing exposure to cyber risks
- Performance limitations in harsh environments, including extreme temperatures, dust, moisture, and electromagnetic interference, can affect sensor accuracy and lifespan
- To overcome these challenges, manufacturers are focusing on ruggedized designs, cost optimization, enhanced cybersecurity features, and improved sensor miniaturization to expand global adoption of proximity sensors
How is the Proximity Sensor Market Segmented?
The market is segmented on the basis of technology, product, sensing range, channel type, application, type, and end-user.
- By Technology
On the basis of technology, the global proximity sensor market is segmented into Inductive, Capacitive, Photoelectric, Magnetic, Ultrasonic, and Others. The Inductive proximity sensor segment dominated the market with an estimated 34.6% share in 2024, owing to its extensive use in industrial automation, automotive manufacturing, and metal object detection applications. Inductive sensors are highly preferred due to their robustness, reliability in harsh environments, resistance to dust and moisture, and long operational life. Their widespread adoption across conveyor systems, machine tools, and robotics continues to support market leadership.
The Photoelectric proximity sensor segment is expected to register the fastest CAGR from 2025 to 2032, driven by rising demand for long sensing ranges, high precision, and non-contact detection capabilities. Increasing deployment in smart factories, packaging lines, warehouse automation, and safety systems further accelerates growth, making photoelectric sensors a key focus area for manufacturers.
- By Product
On the basis of product, the proximity sensor market is segmented into Fixed Distance and Adjustable Distance sensors. The Fixed Distance segment dominated the market with a revenue share of approximately 57.2% in 2024, supported by its simplicity, cost-effectiveness, and wide usage in standardized industrial and automotive applications. Fixed distance sensors are commonly integrated into assembly lines, conveyor belts, and machine safety systems where detection parameters remain constant.
The Adjustable Distance segment is projected to grow at the fastest CAGR during the forecast period, driven by increasing demand for flexibility, customization, and multi-application usage. Adjustable sensors enable users to modify detection ranges based on operational needs, making them ideal for advanced automation systems, robotics, and smart manufacturing environments. Growing adoption in Industry 4.0 applications further supports this segment’s rapid expansion.
- By Sensing Range
On the basis of sensing range, the global proximity sensor market is segmented into 0mm–10mm, 10mm–40mm, 40mm–60mm, 60mm–80mm, and Greater than 80mm. The 10mm–40mm range segment held the largest market share of around 38.9% in 2024, as it offers an optimal balance between detection accuracy, reliability, and versatility. This range is widely used in automotive systems, industrial automation, consumer electronics, and conveyor-based applications.
The Greater than 80mm sensing range segment is anticipated to grow at the fastest rate from 2025 to 2032, driven by increasing demand in logistics automation, material handling, large machinery, and safety monitoring systems. Long-range sensing enables improved operational efficiency, reduced installation complexity, and enhanced detection in high-speed and large-scale industrial environments.
- By Channel Type
On the basis of channel type, the proximity sensor market is segmented into Single Channel and Multi-Channel sensors. The Single Channel segment dominated the market with a share of approximately 61.5% in 2024, due to its widespread use in conventional detection applications requiring simple on/off signals. Single-channel sensors are cost-effective, easy to integrate, and commonly deployed in manufacturing equipment, elevators, and packaging systems.
The Multi-Channel segment is expected to witness the fastest CAGR over the forecast period, driven by increasing complexity in automation systems and the need for simultaneous multi-point detection. Multi-channel sensors enable advanced monitoring, redundancy, and improved system intelligence, making them increasingly attractive for robotics, smart factories, and automotive electronics applications.
- By Application
On the basis of application, the proximity sensor market is segmented into Ground Proximity Warning Systems, Parking Sensor Systems, Assembly Line Automation, Anti-Aircraft Warfare, Roller Coasters, Vibration Monitoring Systems, Mobile Devices, Conveyor Systems, Detection of Object, Position, Inspection and Counting, and Others. The Assembly Line Automation segment dominated the market with a revenue share of nearly 29.7% in 2024, driven by widespread adoption across manufacturing industries to improve efficiency, accuracy, and safety.
The Parking Sensor Systems segment is projected to grow at the fastest CAGR from 2025 to 2032, fueled by rising vehicle production, increasing penetration of ADAS technologies, and growing consumer demand for enhanced safety features. Expanding electric vehicle adoption further supports strong growth in automotive proximity sensing applications.
- By Type
On the basis of type, the global proximity sensor market is segmented into Rectangular Inductive Sensors, Cylindrical Inductive Sensors, Ring Inductive Sensors, and Slot Inductive Sensors. The Cylindrical Inductive Sensor segment dominated the market with an estimated 41.3% share in 2024, owing to its compact design, easy installation, and wide usage in industrial machinery and automation systems.
The Rectangular Inductive Sensor segment is expected to grow at the fastest CAGR during the forecast period, driven by increasing use in space-constrained applications and customized industrial setups. Their larger sensing face and higher stability make them suitable for demanding detection tasks in smart manufacturing and heavy machinery environments.
- By End User
On the basis of end user, the proximity sensor market is segmented into Aerospace and Defense, Automotive, Building Automation, Industrial, Consumer Electronics, Food and Beverage, Pharmaceutical, Construction, Energy, and Others. The Industrial segment dominated the market with a 35.8% share in 2024, supported by extensive use in factory automation, machine tools, robotics, and material handling systems.
The Automotive segment is expected to grow at the fastest CAGR from 2025 to 2032, driven by rising adoption of proximity sensors in ADAS, parking assistance, collision avoidance, and electric vehicle systems. Increasing safety regulations and vehicle electrification trends continue to accelerate demand across global automotive markets.
Which Region Holds the Largest Share of the Proximity Sensor Market?
- The U.S. dominated the North America proximity sensor market with the largest revenue share of 52.8% in 2024, driven by strong industrial automation adoption, advanced manufacturing infrastructure, and high deployment of proximity sensors across automotive, food processing, consumer electronics, and industrial automation sectors
- U.S. benefits from early adoption of smart factories, robotics, conveyor systems, and IoT-enabled production lines, which significantly boosts sensor demand across manufacturing and material handling applications
- Widespread integration of automation, robotics, safety systems, and sensor-based quality control across large-scale manufacturing facilities. High penetration of proximity sensors in automotive safety systems, warehouse automation, and packaging equipment further supports sustained demand
Canada Proximity Sensor Market Insight
The Canada proximity sensor market is witnessing fastest growth rate of 9.32%, supported by increasing automation in food processing, packaging, mining, and energy sectors. Rising adoption of robotic systems, conveyor automation, and smart material handling solutions is improving operational efficiency. Government-backed innovation programs, emphasis on workplace safety, and investments in sustainable manufacturing technologies continue to support sensor adoption across industrial and commercial applications.
Mexico Proximity Sensor Market Insight
The Mexico proximity sensor market is expanding at a healthy pace, driven by growth in automotive manufacturing, electronics assembly, and export-oriented industrial facilities. Increasing foreign direct investment, rising deployment of automated production lines, and expansion of logistics and warehousing infrastructure are boosting proximity sensor demand. Cost-effective manufacturing capabilities, favorable trade agreements, and growing industrial automation adoption position Mexico as an emerging growth market within North America.
Which are the Top Companies in Proximity Sensor Market?
The proximity sensor industry is primarily led by well-established companies, including:
- STMicroelectronics (Switzerland)
- TE Connectivity (Switzerland)
- Qualcomm Technologies, Inc. (U.S.)
- NXP Semiconductors (Netherlands)
- Infineon Technologies AG (Germany)
- Texas Instruments Incorporated (U.S.)
- Robert Bosch GmbH (Germany)
- Microchip Technology Inc. (U.S.)
- Honeywell International Inc. (U.S.)
- ROHM Co. Ltd. (Japan)
- Taiwan Semiconductor Manufacturing Company Limited (Taiwan)
- TDK Corporation (Japan)
- KIONIX, Inc. (U.S.)
- Murata Manufacturing Co., Ltd. (Japan)
- Northrop Grumman LITEF GmbH (Germany)
- Sensonor (Norway)
What are the Recent Developments in Global Proximity Sensor Market?
- In April 2024, Rockwell Automation (U.S.) announced the establishment of a new 98,000-square-foot manufacturing facility in Chennai, India, aimed at strengthening supply chain resilience across Asia-Pacific and improving operational efficiency at its existing industrial park location, reinforcing the company’s long-term manufacturing and regional expansion strategy
- In April 2024, Delta Electronics, Inc. (Taiwan) received its 9th consecutive ENERGY STAR Partner of the Year recognition along with its 7th Sustained Excellence award, highlighting its energy-efficient innovations that helped U.S. customers save 29 million kilowatt hours in 2023 through advanced DC brushless motor ventilation fans, underscoring its leadership in energy conservation and sustainable technologies
- In February 2024, SICK AG (Germany) introduced the W10 photoelectric proximity sensor featuring a Class 1 laser, touchscreen interface, IP69K stainless steel housing, and IO-Link functionality, designed to simplify automation tasks while delivering precise detection and high repeatability, strengthening SICK’s portfolio in industrial sensing and automation solutions
- In January 2024, STMicroelectronics (Switzerland) partnered with Mobile Physics (Israel) to launch EnviroMeter, the world’s first accurate personal air quality monitor and smartphone smoke detector using multizone ranging sensors, enabling continuous and energy-efficient particulate monitoring, advancing innovation in health, safety, and sensor-based environmental monitoring
- In November 2023, Rockwell Automation (U.S.) completed the acquisition of Verve Industrial Protection (U.S.), integrating OT/ICS endpoint security, asset inventory, and vulnerability management capabilities into its offerings, enhancing cybersecurity strength and reinforcing trust in industrial digital transformation initiatives
SKU-

- Interactive Data Analysis Dashboard
- Company Analysis Dashboard for high growth potential opportunities
- Research Analyst Access for customization & queries
- Competitor Analysis with Interactive dashboard
- Latest News, Updates & Trend analysis
- Harness the Power of Benchmark Analysis for Comprehensive Competitor Tracking
North America Proximity Sensor Market, Supply Chain Analysis and Ecosystem Framework
To support market growth and help clients navigate the impact of geopolitical shifts, DBMR has integrated in-depth supply chain analysis into its North America Proximity Sensor Market research reports. This addition empowers clients to respond effectively to global changes affecting their industries. The supply chain analysis section includes detailed insights such as North America Proximity Sensor Market consumption and production by country, price trend analysis, the impact of tariffs and geopolitical developments, and import and export trends by country and HSN code. It also highlights major suppliers with data on production capacity and company profiles, as well as key importers and exporters. In addition to research, DBMR offers specialized supply chain consulting services backed by over a decade of experience, providing solutions like supplier discovery, supplier risk assessment, price trend analysis, impact evaluation of inflation and trade route changes, and comprehensive market trend analysis.
Data collection and base year analysis are done using data collection modules with large sample sizes. The stage includes obtaining market information or related data through various sources and strategies. It includes examining and planning all the data acquired from the past in advance. It likewise envelops the examination of information inconsistencies seen across different information sources. The market data is analysed and estimated using market statistical and coherent models. Also, market share analysis and key trend analysis are the major success factors in the market report. To know more, please request an analyst call or drop down your inquiry.
The key research methodology used by DBMR research team is data triangulation which involves data mining, analysis of the impact of data variables on the market and primary (industry expert) validation. Data models include Vendor Positioning Grid, Market Time Line Analysis, Market Overview and Guide, Company Positioning Grid, Patent Analysis, Pricing Analysis, Company Market Share Analysis, Standards of Measurement, Global versus Regional and Vendor Share Analysis. To know more about the research methodology, drop in an inquiry to speak to our industry experts.
Data Bridge Market Research is a leader in advanced formative research. We take pride in servicing our existing and new customers with data and analysis that match and suits their goal. The report can be customized to include price trend analysis of target brands understanding the market for additional countries (ask for the list of countries), clinical trial results data, literature review, refurbished market and product base analysis. Market analysis of target competitors can be analyzed from technology-based analysis to market portfolio strategies. We can add as many competitors that you require data about in the format and data style you are looking for. Our team of analysts can also provide you data in crude raw excel files pivot tables (Fact book) or can assist you in creating presentations from the data sets available in the report.


