
North America Quinoa Market
Market Size in USD Million
 USD
382.75 Million
USD
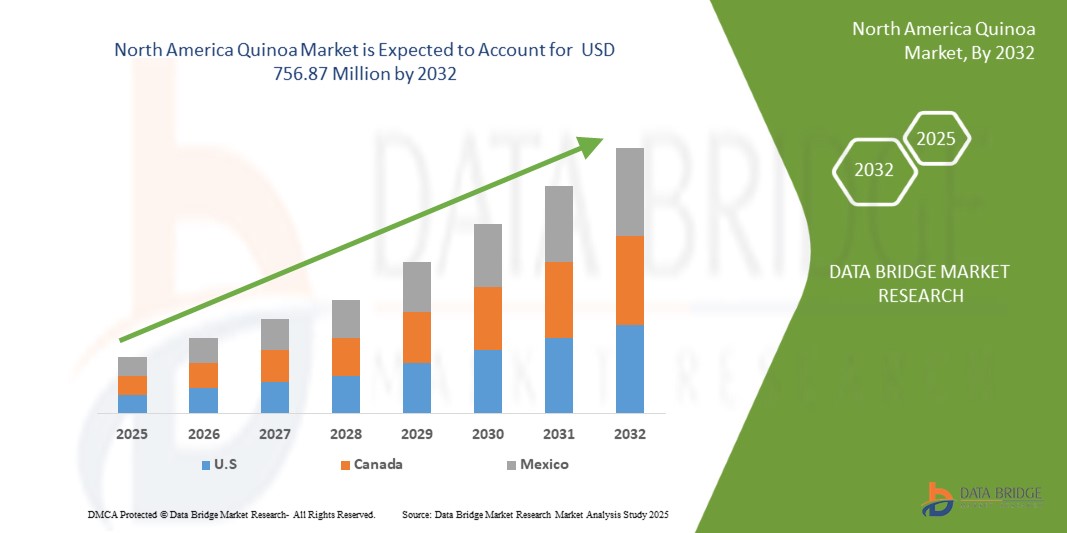
756.87 Million
2024
2032
USD
382.75 Million
USD
756.87 Million
2024
2032
| 2025 - 2032 | |
| USD 382.75 Million | |
| USD 756.87 Million | |
| % | |
|
Quinoa Market Size
- The North America Quinoa Market was valued at USD 382.75 million in 2024 and is expected to reach USD 756.87 million by 2032
- During the forecast period of 2025 to 2032 the market is likely to grow at a CAGR of 8.1%, primarily driven by the rising popularity of locally sourced and organic quinoa varieties, fuelled by consumer demand for clean-label, sustainable, and traceable superfoods.
- This growth is driven by factors such as growing shift toward plant-based and gluten-free diets across the region.
Quinoa Market Analysis
- The North America Quinoa Market is witnessing consistent growth, driven by the rising adoption of plant-based and gluten-free diets, particularly among health-conscious and environmentally aware consumers. Quinoa’s reputation as a complete protein, rich in fiber, essential amino acids, and micronutrients, makes it a sought-after alternative to traditional grains. Countries such as U.S, Canada and Mexico are at the forefront of this shift, with strong retail availability and product innovation in categories such as breakfast cereals, functional snacks, and ready-to-eat meals enhancing market visibility and consumption
- Quinoa is being widely incorporated across various segments including seeds, flour, flakes, and puffs, offering versatility for both household and industrial food applications. Its functional benefits—such as low glycaemic index, satiety support, and digestive health—are driving its use in bakery, baby food, sports nutrition, and dietary supplements. European food manufacturers are capitalizing on its nutritional profile and clean-label appeal to target flexitarian, vegan, and allergen-sensitive consumer bases
- The market is evolving alongside rising demand for organic, non-GMO, and ethically sourced quinoa, with increasing interest in locally grown North American varieties to reduce reliance on imports from South America. Efforts to scale sustainable cultivation in regions like Colorado, California, and parts of Canada are gaining momentum, supported by agri-tech innovation and government-backed agricultural development programs. Additionally, branding around superfoods, plant-based nutrition, and clean-label sourcing is reinforcing quinoa’s premium positioning in the North American food ecosystem, suggesting sustained market expansion anchored in wellness and sustainability trends
Report Scope and Quinoa Market Segmentation
|
Attributes |
Quinoa Key Market Insights |
|
Segments Covered |
|
|
Countries Covered |
NA
|
|
Key Market Players |
|
|
Market Opportunities |
|
|
Value Added Data Infosets |
In addition to the insights on market scenarios such as market value, growth rate, segmentation, geographical coverage, and major players, the market reports curated by the Data Bridge Market Research also include import export analysis, production capacity overview, production consumption analysis, price trend analysis, climate change scenario, supply chain analysis, value chain analysis, raw material/consumables overview, vendor selection criteria, PESTLE Analysis, Porter Analysis, and regulatory framework. |
Quinoa Market Trends
“GROWING CONSUMER SHIFT TOWARD GLUTEN-FREE AND PLANT-BASED NUTRITION”
- As consumer dietary habits shift toward gluten-free and plant-based options, quinoa is gaining popularity as a naturally gluten-free pseudo cereal rich in complete protein, appealing to individuals with gluten intolerance, vegetarians, vegans, and flexitarians seeking nutritionally balanced alternatives.
- Quinoa’s high fiber content, essential vitamins, minerals, and antioxidants align well with growing global health awareness and demand for transparent, clean-label foods, positioning it as a go-to ingredient for wellness-driven consumers.
- The increasing use of quinoa in plant-based product innovation—such as meat substitutes, dairy alternatives, and functional snacks—has boosted its mainstream acceptance and market penetration across health food and specialty categories.
- Food manufacturers and retailers are actively introducing quinoa-enriched offerings to tap into rising demand from niche consumer groups focused on allergen-free and nutrient-dense diets, thereby expanding quinoa's application across multiple product lines.
- Supported by favorable regulatory reforms and endorsements from health organizations, quinoa is solidifying its role as a strategic ingredient in the evolving global food ecosystem focused on sustainability, allergen-conscious consumption, and nutritional excellence.
Quinoa Market Dynamics
Driver
“RISING HEALTH CONSCIOUSNESS AMONG URBAN POPULATIONS”
- Growing health awareness among global urban consumers is playing a pivotal role in driving demand for quinoa, as individuals increasingly seek nutrient-rich, whole-food options to manage or prevent chronic conditions like obesity, diabetes, and cardiovascular diseases.
- Quinoa’s high concentration of complete proteins, fiber, vitamins, and essential minerals makes it particularly attractive to health-conscious populations in urban areas, where sedentary lifestyles and processed food consumption are common.
- The grain’s low glycemic index, cholesterol-free nature, and digestive health benefits position it as a functional food for those aiming to improve metabolic health, manage weight, and pursue long-term wellness goals.
- Consumer interest in superfoods, clean-label ingredients, and plant-based nutrition continues to grow in cities, and quinoa’s versatility in salads, bowls, snacks, and beverages supports its widespread adoption across both household kitchens and foodservice menus.
- Influences from health advocacy campaigns, social media, and nutrition education are further solidifying quinoa’s reputation as a premium health food, making it a staple among urban consumers who prioritize balanced, preventive nutrition.
Restraint/Challenge
“ELEVATED PRODUCTION COSTS HINDER COMMERCIAL SCALABILITY”
- The quinoa market faces a significant restraint in the form of high production costs, which limit the feasibility of large-scale commercialization. Cultivation is labor-intensive and demands careful attention at every stage—from sowing to harvesting and post-harvest handling—to maintain grain quality and nutritional value.
- In traditional producing countries like Peru and Bolivia, low levels of mechanization contribute to inefficiencies, while manual labor requirements increase operational expenses. These structural limitations reduce cost competitiveness in global markets.
- Quinoa’s sensitivity to environmental conditions, such as temperature, soil quality, and salinity, further necessitates precision farming techniques and supplementary inputs like irrigation and pest control, all of which escalate production costs.
- For non-native growing regions attempting to scale up quinoa farming, challenges such as inadequate seed varieties, limited agronomic expertise, and underdeveloped supply chain infrastructure add to resource intensity and constrain yield potential.
- Despite its growing international demand and nutritional advantages, persistent price volatility, export restrictions, and high processing costs continue to hinder quinoa’s mainstream adoption—particularly in developing economies and among cost-sensitive consumers and food manufacturers.
Quinoa Market Scope
The market is segmented on the basis of type, product, packaging type, and distribution channel
- By Type
The quinoa market is segmented into Single and Tricolor varieties. In 2025, the Single type is expected to dominate the market owing to its greater availability, cost efficiency, and broad consumer acceptance. It is widely used in both retail and foodservice applications. The Tricolor segment is anticipated to grow at the fastest CAGR from 2025 to 2032, supported by rising consumer interest in premium and visually distinct products that offer a balanced nutritional profile.
- By Product
On the basis of product, the market is categorized into Seeds, Flour, Flakes, and Puffs. Seeds held the largest share in 2024, driven by their versatility in salads, grain bowls, and side dishes. The Flour segment is projected to grow at the fastest rate, fueled by increasing demand for gluten-free baking ingredients and protein-rich alternatives in breads, pastas, and snacks.
- By Packaging Type
The market is segmented into Bags, Pouches, Box, Jar, and Others. Bags accounted for the highest revenue share in 2024 due to consumer preference for resealable and portable packaging solutions. The Jar segment is projected to expand rapidly through 2032, attributed to premium positioning and rising popularity of sustainable and reusable packaging formats.
- By Distribution Channel
The market is divided into Offline and Online channels. Offline distribution, including supermarkets, hypermarkets, and health food stores, dominated the market in 2024 due to high consumer trust and established supply chains. However, the Online segment is expected to grow at the fastest CAGR through 2032, driven by increasing e-commerce penetration, convenience, and rising demand for organic and specialty quinoa products via digital platforms.
Quinoa Market Regional Analysis
- North America accounts for a substantial revenue share in the global quinoa market in 2024, driven by rising demand for organic, high-protein, and gluten-free food products. The region's growing interest in plant-based diets, clean-label foods, and sustainable agriculture is propelling quinoa's popularity across consumer segments. The United States and Canada are leading in quinoa adoption, supported by advanced food innovation ecosystems, widespread retail availability, and increasing consumer awareness around functional nutrition and superfoods
- The region benefits from the growing penetration of health-conscious retail formats, plant-based foodservice outlets, and natural/organic grocery chains that are actively marketing quinoa-based cereals, salads, snacks, and meal kits. In parallel, North American food brands are incorporating quinoa into a range of product formats—such as flour, crisps, pasta, and energy bars—to meet the evolving preferences of vegan, vegetarian, and flexitarian consumers
- Domestic cultivation in states like Colorado, California, and parts of the Canadian Prairie provinces is expanding steadily to enhance regional supply security and reduce reliance on Andean imports. Supported by agricultural research institutions and USDA/CFIA initiatives, these efforts focus on improving climate-resilient quinoa varietals suited to North American growing conditions. Overall, the region’s alignment with wellness trends, local sourcing, and premium nutrition is driving sustained quinoa market growth
North America Quinoa Market Insight
The North American quinoa market is expected to witness consistent and robust growth, anchored in the convergence of clean eating, sustainability, and functional food demand. With increasing consumer inclination toward high-fiber, allergen-free, and protein-rich foods, quinoa fits seamlessly into various modern dietary frameworks. Continued expansion of plant-based diets, combined with growing investments in health-forward product innovation, supports quinoa's growing footprint across retail, foodservice, and meal delivery platforms
United States Quinoa Market Insight
The U.S. quinoa market is a major contributor to regional and global growth, fueled by rising health awareness, fitness-oriented lifestyles, and the popularity of ancient grains in mainstream diets. U.S. food manufacturers are incorporating quinoa into a wide spectrum of applications—from baby foods and ready meals to protein snacks and gluten-free baked goods. Domestic production, especially in Colorado and California, is receiving support from USDA-backed initiatives and private agri-tech investments, which aim to improve yield, reduce import dependency, and ensure year-round availability. In addition, quinoa's image as a sustainable and ethical crop enhances its appeal among conscious consumers
Canada Quinoa Market Insight
The Canadian quinoa market is gaining momentum, with increasing emphasis on organic and local sourcing. Consumer demand for clean-label, nutrient-dense foods is driving quinoa’s incorporation into cereals, soups, energy bites, and functional beverages. Canada’s diverse health-conscious population—along with a strong retail landscape for natural and organic products—is boosting quinoa’s visibility and sales. Moreover, agricultural research bodies in provinces like Saskatchewan and Alberta are working on quinoa varietal development and expanding cultivation zones to improve regional supply. The alignment with national health goals and consumer trends positions Canada as a key market for quinoa growth in North America
The Major Market Leaders Operating in the Market Are:
- QUINOA FOODS COMPANY SRL (Bolivia)
- NORTHERN QUINOA PRODUCTION CORPORATION (Canada)
- Quinoa Corporation (U.S)
- The British Quinoa Company (U.K)
- Nourish You (U.K)
- Organic Tattva (India)
- Adinath Agro Industries (India)
- SARCHIO SPA (Italy)
- AARY'S FOOD (India)
- ARDENT MILLS (U.S)
- Appkin Agro Private Limited (India)
- Elworld Organic (India)
- Apex International (India)
- SHANTILAL AND SONS HUF (India)
- Vedaliya Industries LLP. (India)
- Shiloh Farms (India)
- ROYAL NUT COMPANY (India)
- MAATITATVA AGRO INDUSTRIES PRIVATE LIMITED (India)
- Dev Agro Industries (India)
- pureproducts (U.K)
- Alter Eco Foods (U.S)
- Irupana (Bolivia)
Latest Developments in North America Quinoa Market
- In April 2025, U.S.-based food tech startup Grain Wise Naturals launched a new line of plant-based quinoa protein crisps targeting fitness-focused consumers. The products, marketed as gluten-free, high-protein, and allergen-friendly, are distributed through Whole Foods and other natural grocery chains across the U.S. and Canada, reinforcing quinoa’s role in functional snacking trends
- In November 2024, Manitoba Quinoa Producers Association (MQPA) in Canada announced a new public-private research collaboration with the University of Manitoba to develop climate-resilient quinoa cultivars for the Canadian Prairies. This initiative aims to strengthen domestic supply chains, reduce reliance on South American imports, and improve yields under variable climate conditions
- In August 2024, U.S.-based natural foods giant Nature's Path expanded its ready-to-eat breakfast segment with the introduction of organic quinoa-based cereals and hot porridges, tapping into demand for clean-label and plant-powered breakfast alternatives. The product line emphasizes whole grains, fiber content, and traceable sourcing
- In January 2024, California-based Andean Naturals, one of the largest importers and processors of quinoa in North America, partnered with Latin American farming cooperatives to expand fair-trade quinoa sourcing. The initiative includes enhanced traceability systems and joint sustainability audits, appealing to ethically minded U.S. consumers and retail buyers
SKU-

- Interactive Data Analysis Dashboard
- Company Analysis Dashboard for high growth potential opportunities
- Research Analyst Access for customization & queries
- Competitor Analysis with Interactive dashboard
- Latest News, Updates & Trend analysis
- Harness the Power of Benchmark Analysis for Comprehensive Competitor Tracking
Table of Content
1 INTRODUCTION
1.1 OBJECTIVES OF THE STUDY
1.2 MARKET DEFINITION
1.3 OVERVIEW
1.4 LIMITATIONS
1.5 MARKETS COVERED
2 MARKET SEGMENTATION
2.1 MARKETS COVERED
2.2 GEOGRAPHICAL SCOPE
2.3 YEARS CONSIDERED FOR THE STUDY
2.4 CURRENCY AND PRICING
2.5 DBMR TRIPOD DATA VALIDATION MODEL
2.6 MULTIVARIATE MODELING
2.7 PRIMARY INTERVIEWS WITH KEY OPINION LEADERS
2.8 DBMR MARKET POSITION GRID
2.9 VENDOR SHARE ANALYSIS
2.1 SECONDARY SOURCES
2.11 ASSUMPTIONS
3 EXECUTIVE SUMMARY
4 PREMIUM INSIGHTS
4.1 PRICING ANALYSIS
4.2 COST ANALYSIS BREAKDOWN OF THE NORTH AMERICA QUINOA MARKET
4.3 FACTORS AFFECTING BUYING DECISION
4.3.1 PRICE
4.3.2 PRODUCT QUALITY
4.3.3 BRAND REPUTATION
4.3.4 ADVERTISEMENT AND PROMOTIONS
4.3.5 PRODUCT AVAILABILITY
4.3.6 FINANCIAL ACCESSIBILITY
4.3.7 PEER AND EXPERT RECOMMENDATIONS
4.4 IMPACT OF ECONOMIC SLOWDOWN ON NORTH AMERICA QUINOA MARKET
4.4.1 IMPACT OF PRICE
4.4.2 IMPACT ON SUPPLY CHAIN
4.4.3 IMPACT ON SHIPMENT
4.4.4 IMPACT ON DEMAND
4.4.5 IMPACT ON STRATEGIC DECISIONS
4.5 INDUSTRY ECO-SYSTEM ANALYSIS
4.5.1 PROMINENT COMPANIES
4.5.2 SMALL & MEDIUM SIZE COMPANIES
4.5.3 END USERS
4.6 INNOVATION TRACKER AND STRATEGIC ANALYSIS
4.6.1 MAJOR DEALS AND STRATEGIC ALLIANCES ANALYSIS
4.6.1.1 JOINT VENTURES
4.6.1.2 MERGERS AND ACQUISITIONS
4.6.1.3 LICENSING AND PARTNERSHIP
4.6.1.4 TECHNOLOGY COLLABORATIONS
4.6.1.5 STRATEGIC DIVESTMENTS
4.6.2 NUMBER OF PRODUCTS IN DEVELOPMENT
4.6.3 STAGE OF DEVELOPMENT
4.6.4 TIMELINES AND MILESTONES
4.6.5 INNOVATION STRATEGIES AND METHODOLOGIES
4.6.6 RISK ASSESSMENT AND MITIGATION
4.6.7 FUTURE OUTLOOK
4.7 PATENT QUALITY AND STRENGTH
4.8 PATENT FAMILIES
4.8.1 LICENSING AND COLLABORATIONS
4.8.1.1 COMPANY PATENT LANDSCAPE
4.8.1.2 REGION PATENT LANDSCAPE
4.8.1.3 IP STRATEGY AND MANAGEMENT
4.8.2 PATENT ANALYSIS
4.8.3 CONSUMER BUYING BEHAVIOUR
4.9 PRODUCT ADOPTION SCENARIO
4.9.1 CONSUMER SEGMENT PENETRATION
4.9.2 INDUSTRIAL AND FOOD SERVICE ADOPTION
4.9.3 GEOGRAPHICAL EXPANSION
4.9.4 BARRIERS TO ADOPTION
4.1 RAW MATERIAL SOURCING ANALYSIS
4.10.1 KEY RAW MATERIAL: QUINOA SEEDS
4.10.2 MAJOR QUINOA-PRODUCING COUNTRIES
4.10.3 SOURCING CHANNELS
4.10.4 CERTIFICATIONS & QUALITY STANDARDS
4.10.5 CHALLENGES IN RAW MATERIAL SOURCING
4.10.6 TRENDS IN SOURCING STRATEGY
4.11 SUPPLY CHAIN ANALYSIS
4.11.1 OVERVIEW
4.11.2 LOGISTIC COST SCENARIO
4.11.3 IMPORTANCE OF LOGISTICS SERVICE PROVIDERS
5 TARIFFS AND THEIR IMPACT ON MARKET
5.1 CURRENT TARIFF RATES IN TOP-5 COUNTRY MARKETS
5.2 OUTLOOK: LOCAL PRODUCTION VS IMPORT RELIANCE
5.3 VENDOR SELECTION CRITERIA DYNAMICS
5.4 IMPACT ON SUPPLY CHAIN
5.4.1 RAW MATERIAL PROCUREMENT
5.4.2 MANUFACTURING AND PRODUCTION
5.4.3 LOGISTICS AND DISTRIBUTION
5.4.4 PRICE PITCHING AND POSITION OF MARKET
5.5 INDUSTRY PARTICIPANTS: PROACTIVE MOVES
5.5.1 SUPPLY CHAIN OPTIMIZATION
5.5.2 JOINT VENTURE ESTABLISHMENTS
5.6 IMPACT ON PRICES
5.7 REGULATORY INCLINATION
5.7.1 GEOPOLITICAL SITUATION
5.7.2 TRADE PARTNERSHIPS BETWEEN COUNTRIES
5.7.2.1 FREE TRADE AGREEMENTS
5.7.2.2 ALLIANCE ESTABLISHMENTS
5.7.3 STATUS ACCREDITATION (INCLUDING MFN)
5.7.4 DOMESTIC COURSE OF CORRECTION
5.7.4.1 INCENTIVE SCHEMES TO BOOST PRODUCTION OUTPUTS
5.7.4.2 ESTABLISHMENT OF SPECIAL ECONOMIC ZONES / INDUSTRIAL PARKS
6 REGULATION COVERAGE
7 MARKET OVERVIEW
7.1 DRIVER
7.1.1 RISING DEMAND FOR GLUTEN-FREE AND PLANT-BASED FOODS
7.1.2 INCREASING HEALTH AWARENESS AMONG NORTH AMERICA URBAN CONSUMERS
7.1.3 FAST EXPANDING VEGAN AND VEGETARIAN DIETARY LIFESTYLE TRENDS
7.1.4 GROWING APPLICATION OF QUINOA IN FUNCTIONAL AND FORTIFIED FOOD PRODUCTS
7.2 RESTRAINTS
7.2.1 HIGH PRODUCTION COSTS LIMIT LARGE-SCALE COMMERCIAL EXPANSION
7.2.2 EXPANSION OF SINGLE-CROP QUINOA LEADING TO SOIL DEGRADATION, BIODIVERSITY LOSS, AND SUSCEPTIBILITY TO CLIMATE STRESS
7.3 OPPORTUNITIES
7.3.1 EXPANDING QUINOA FARMING IN ASIA, AFRICA, NORTH AMERICA, AND EUROPE COUNTRIES
7.3.2 GOVERNMENT SUPPORT & POLICY INCENTIVES PROMOTING FARMERS TO ADOPT QUINOA AS A CLIMATE-RESILIENT CROP
7.3.3 RISING POPULARITY OF ORGANIC AND SUSTAINABLE AGRICULTURE PRACTICES
7.4 CHALLENGES
7.4.1 REGULATORY & TRADE UNCERTAINTIES
7.4.2 QUALITY INCONSISTENCIES ACROSS INTERNATIONAL QUINOA SUPPLY CHAINS
8 NORTH AMERICA QUINOA MARKET, BY TYPE
8.1 OVERVIEW
8.2 SINGLE
8.3 TRICOLOR
9 NORTH AMERICA QUINOA MARKET, BY PRODUCT
9.1 OVERVIEW
9.2 SEEDS
9.3 FLOUR
9.4 FLAKES
9.5 PUFFS
10 NORTH AMERICA QUINOA MARKET, BY PACKAGING TYPE
10.1 OVERVIEW
10.2 BAGS
10.3 POUCHES
10.4 BOX
10.5 JAR
10.6 OTHERS
11 NORTH AMERICA QUINOA MARKET, BY NATURE
11.1 OVERVIEW
11.2 CONVENTIONAL QUINOA
11.3 ORGANIC QUINOA
12 NORTH AMERICA QUINOA MARKET, BY DISTRIBUTION CHANNEL
12.1 OVERVIEW
12.2 OFFLINE
12.3 ONLINE
13 NORTH AMERICA QUINOA MARKET, BY REGION
13.1 NORTH AMERICA
13.1.1 U.S
13.1.2 CANADA
13.1.3 MEXICO
14 NORTH AMERICA QUINOA MARKET COMPANY LANDSCAPE
14.1 COMPANY SHARE ANALYSIS: GLOBAL
15 SWOT ANALYSIS
16 COMPANY PROFILE
16.1 ARDENT MILLS
16.1.1 COMPANY SNAPSHOT
16.1.2 COMPANY SHARE ANALYSIS
16.1.3 PRODUCT PORTFOLIO
16.1.4 RECENT DEVELOPMENT
16.2 ADINATH AGRO INDUSTRIES
16.2.1 COMPANY SNAPSHOT
16.2.2 COMPANY SHARE ANALYSIS
16.2.3 PRODUCT PORTFOLIO
16.2.4 RECENT DEVELOPMENT
16.3 NOURISH YOU
16.3.1 COMPANY SNAPSHOT
16.3.2 COMPANY SHARE ANALYSIS
16.3.3 PRODUCT PORTFOLIO
16.3.4 RECENT DEVELOPMENTS
16.4 APEX INTERNATIONAL
16.4.1 COMPANY SNAPSHOT
16.4.2 COMPANY SHARE ANALYSIS
16.4.3 PRODUCT PORTFOLIO
16.4.4 RECENT DEVELOPMENT
16.5 AARY'S FOOD
16.5.1 COMPANY SNAPSHOT
16.5.2 COMPANY SHARE ANALYSIS
16.5.3 PRODUCT PORTFOLIO
16.5.4 RECENT DEVELOPMENT
16.6 ALTER ECO FOODS
16.6.1 COMPANY SNAPSHOT
16.6.2 PRODUCT PORTFOLIO
16.6.3 RECENT DEVELOPMENT
16.7 APPKIN AGRO PRIVATE LIMITED
16.7.1 COMPANY SNAPSHOT
16.7.2 PRODUCT PORTFOLIO
16.7.3 RECENT DEVELOPMENT
16.8 DEV AGRO INDUSTRIES
16.8.1 COMPANY SNAPSHOT
16.8.2 PRODUCT PORTFOLIO
16.8.3 RECENT DEVELOPMENT
16.9 ELWORLD ORGANIC
16.9.1 COMPANY SNAPSHOT
16.9.2 PRODUCT PORTFOLIO
16.9.3 RECENT DEVELOPMENT
16.1 IRUPANA ANDEN ORGANIC FOOD S.A.
16.10.1 COMPANY SNAPSHOT
16.10.2 PRODUCT PORTFOLIO
16.10.3 RECENT DEVELOPMENT
16.11 MAATITATVA AGRO INDUSTRIES PRIVATE LIMITED
16.11.1 COMPANY SNAPSHOT
16.11.2 PRODUCT PORTFOLIO
16.11.3 RECENT DEVELOPMENT
16.12 NORTHERN QUINOA PRODUCTION CORPORATION
16.12.1 COMPANY SNAPSHOT
16.12.2 PRODUCT PORTFOLIO
16.12.3 RECENT DEVELOPMENTS
16.13 ORGANIC TATTVA
16.13.1 COMPANY SNAPSHOT
16.13.2 PRODUCT PORTFOLIO
16.13.3 RECENT DEVELOPMENT/NEWS
16.14 PURE PRODUCTS
16.14.1 COMPANY SNAPSHOT
16.14.2 PRODUCT PORTFOLIO
16.14.3 RECENT DEVELOPMENT
16.15 QUINOA CORPORATION
16.15.1 COMPANY SNAPSHOT
16.15.2 PRODUCT PORTFOLIO
16.15.3 RECENT DEVELOPMENTS
16.16 QUINOA FOODS COMPANY SRL
16.16.1 COMPANY SNAPSHOT
16.16.2 PRODUCT PORTFOLIO
16.16.3 RECENT DEVELOPMENTS
16.17 ROYAL NUT COMPANY.
16.17.1 COMPANY SNAPSHOT
16.17.2 PRODUCT PORTFOLIO
16.17.3 RECENT DEVELOPMENT
16.18 SARCHIO SPA
16.18.1 COMPANY SNAPSHOT
16.18.2 PRODUCT PORTFOLIO
16.18.3 RECENT DEVELOPMENT
16.19 SHANTILAL & SONS HUF
16.19.1 COMPANY SNAPSHOT
16.19.2 PRODUCT PORTFOLIO
16.19.3 RECENT DEVELOPMENT
16.2 SHILOH FARMS
16.20.1 COMPANY SNAPSHOT
16.20.2 PRODUCT PORTFOLIO
16.20.3 RECENT DEVELOPMENTS
16.21 THE BRITISH QUINOA COMPANY
16.21.1 COMPANY SNAPSHOT
16.21.2 PRODUCT PORTFOLIO
16.21.3 RECENT DEVELOPMENTS
16.22 VEDALIYA INDUSTRIES LLP.
16.22.1 COMPANY SNAPSHOT
16.22.2 PRODUCT PORTFOLIO
16.22.3 RECENT DEVELOPMENT
17 QUESTIONNAIRE
18 RELATED REPORTS
List of Table
TABLE 1 REGULATORY COVERAGE
TABLE 2 NORTH AMERICA QUINOA MARKET, BY TYPE, 2018-2032 (USD THOUSAND)
TABLE 3 NORTH AMERICA QUINOA MARKET, BY TYPE, 2018-2032 (KILO TONS)
TABLE 4 NORTH AMERICA SINGLE IN QUINOA MARKET, BY TYPE, 2018-2032 (USD THOUSAND)
TABLE 5 NORTH AMERICA SINGLE IN QUINOA MARKET, BY REGION, 2018-2032 (USD THOUSAND)
TABLE 6 NORTH AMERICA TRICOLOR IN QUINOA MARKET, BY REGION, 2018-2032 (USD THOUSAND)
TABLE 7 NORTH AMERICA QUINOA MARKET, BY PRODUCT, 2018-2032 (USD THOUSAND)
TABLE 8 NORTH AMERICA SEEDS IN QUINOA MARKET, BY REGION, 2018-2032 (USD THOUSAND)
TABLE 9 NORTH AMERICA FLOUR IN QUINOA MARKET, BY REGION, 2018-2032 (USD THOUSAND)
TABLE 10 NORTH AMERICA FLAKES IN QUINOA MARKET, BY REGION, 2018-2032 (USD THOUSAND)
TABLE 11 NORTH AMERICA PUFFS IN QUINOA MARKET, BY REGION, 2018-2032 (USD THOUSAND)
TABLE 12 NORTH AMERICA QUINOA MARKET, BY PACKAGING TYPE, 2018-2032 (USD THOUSAND)
TABLE 13 NORTH AMERICA BAGS IN QUINOA MARKET, BY REGION, 2018-2032 (USD THOUSAND)
TABLE 14 NORTH AMERICA POUCHES IN QUINOA MARKET, BY REGION, 2018-2032 (USD THOUSAND)
TABLE 15 NORTH AMERICA BOX IN QUINOA MARKET, BY REGION, 2018-2032 (USD THOUSAND)
TABLE 16 NORTH AMERICA JAR IN QUINOA MARKET, BY REGION, 2018-2032 (USD THOUSAND)
TABLE 17 NORTH AMERICA OTHERS IN QUINOA MARKET, BY REGION, 2018-2032 (USD THOUSAND)
TABLE 18 NORTH AMERICA QUINOA MARKET, BY NATURE, 2018-2032 (USD THOUSAND)
TABLE 19 NORTH AMERICA CONVENTIONAL QUINOA IN QUINOA MARKET, BY REGION, 2018-2032 (USD THOUSAND)
TABLE 20 NORTH AMERICA ORGANIC QUINOA IN QUINOA MARKET, BY REGION, 2018-2032 (USD THOUSAND)
TABLE 21 NORTH AMERICA QUINOA MARKET, BY DISTRIBUTION CHANNEL, 2018-2032 (USD THOUSAND)
TABLE 22 NORTH AMERICA OFFLINE IN QUINOA MARKET, BY DISTRIBUTION CHANNEL, 2018-2032 (USD THOUSAND)
TABLE 23 NORTH AMERICA OFFLINE IN QUINOA MARKET, BY REGION, 2018-2032 (USD THOUSAND)
TABLE 24 NORTH AMERICA ONLINE IN QUINOA MARKET, BY DISTRIBUTION CHANNEL, 2018-2032 (USD THOUSAND)
TABLE 25 NORTH AMERICA ONLINE IN QUINOA MARKET, BY REGION, 2018-2032 (USD THOUSAND)
TABLE 26 NORTH AMERICA QUINOA MARKET, BY COUNTRY, 2018-2032 (USD THOUSAND)
TABLE 27 NORTH AMERICA QUINOA MARKET, BY TYPE, 2018-2032 (USD THOUSAND)
TABLE 28 NORTH AMERICA QUINOA MARKET, BY TYPE, 2018-2032 (USD THOUSAND) (KILO TONS)
TABLE 29 NORTH AMERICA SINGLE IN QUINOA MARKET, BY TYPE, 2018-2032 (USD THOUSAND)
TABLE 30 NORTH AMERICA QUINOA MARKET, BY NATURE, 2018-2032 (USD THOUSAND)
TABLE 31 NORTH AMERICA QUINOA MARKET, BY PRODUCT, 2018-2032 (USD THOUSAND)
TABLE 32 NORTH AMERICA QUINOA MARKET, BY PACKAGING TYPE, 2018-2032 (USD THOUSAND)
TABLE 33 NORTH AMERICA QUINOA MARKET, BY DISTRIBUTION CHANNEL 2018-2032 (USD THOUSAND)
TABLE 34 NORTH AMERICA OFFLINE IN QUINOA MARKET, BY DISTRIBUTION CHANNEL 2018-2032 (USD THOUSAND)
TABLE 35 NORTH AMERICA ONLINE IN QUINOA MARKET, BY DISTRIBUTION CHANNEL 2018-2032 (USD THOUSAND)
TABLE 36 U.S. QUINOA MARKET, BY TYPE, 2018-2032 (USD THOUSAND)
TABLE 37 U.S. QUINOA MARKET, BY TYPE, 2018-2032 (USD THOUSAND) (KILO TONS)
TABLE 38 U.S. SINGLE IN QUINOA MARKET, BY TYPE, 2018-2032 (USD THOUSAND)
TABLE 39 U.S. QUINOA MARKET, BY NATURE, 2018-2032 (USD THOUSAND)
TABLE 40 U.S. QUINOA MARKET, BY PRODUCT, 2018-2032 (USD THOUSAND)
TABLE 41 U.S. QUINOA MARKET, BY PACKAGING TYPE, 2018-2032 (USD THOUSAND)
TABLE 42 U.S. QUINOA MARKET, BY DISTRIBUTION CHANNEL, 2018-2032 (USD THOUSAND)
TABLE 43 U.S. OFFLINE IN QUINOA MARKET, BY DISTRIBUTION CHANNEL, 2018-2032 (USD THOUSAND)
TABLE 44 U.S. ONLINE IN QUINOA MARKET, BY DISTRIBUTION CHANNEL, 2018-2032 (USD THOUSAND)
TABLE 45 CANADA QUINOA MARKET, BY TYPE, 2018-2032 (USD THOUSAND)
TABLE 46 CANADA QUINOA MARKET, BY TYPE, 2018-2032 (USD THOUSAND) (KILO TONS)
TABLE 47 CANADA SINGLE IN QUINOA MARKET, BY TYPE, 2018-2032 (USD THOUSAND)
TABLE 48 CANADA QUINOA MARKET, BY NATURE, 2018-2032 (USD THOUSAND)
TABLE 49 CANADA QUINOA MARKET, BY PRODUCT, 2018-2032 (USD THOUSAND)
TABLE 50 CANADA QUINOA MARKET, BY PACKAGING TYPE, 2018-2032 (USD THOUSAND)
TABLE 51 CANADA QUINOA MARKET, BY DISTRIBUTION CHANNEL, 2018-2032 (USD THOUSAND)
TABLE 52 CANADA OFFLINE IN QUINOA MARKET, BY DISTRIBUTION CHANNEL, 2018-2032 (USD THOUSAND)
TABLE 53 CANADA ONLINE IN QUINOA MARKET, BY DISTRIBUTION CHANNEL, 2018-2032 (USD THOUSAND)
TABLE 54 MEXICO QUINOA MARKET, BY TYPE, 2018-2032 (USD THOUSAND)
TABLE 55 MEXICO QUINOA MARKET, BY TYPE, 2018-2032 (USD THOUSAND) (KILO TONS)
TABLE 56 MEXICO SINGLE IN QUINOA MARKET, BY TYPE, 2018-2032 (USD THOUSAND)
TABLE 57 MEXICO QUINOA MARKET, BY NATURE, 2018-2032 (USD THOUSAND)
TABLE 58 MEXICO QUINOA MARKET, BY PRODUCT, 2018-2032 (USD THOUSAND)
TABLE 59 MEXICO QUINOA MARKET, BY PACKAGING TYPE, 2018-2032 (USD THOUSAND)
TABLE 60 MEXICO QUINOA MARKET, BY DISTRIBUTION CHANNEL, 2018-2032 (USD THOUSAND)
TABLE 61 MEXICO OFFLINE IN QUINOA MARKET, BY DISTRIBUTION CHANNEL, 2018-2032 (USD THOUSAND)
TABLE 62 MEXICO ONLINE IN QUINOA MARKET, BY DISTRIBUTION CHANNEL, 2018-2032 (USD THOUSAND)
List of Figure
FIGURE 1 NORTH AMERICA QUINOA MARKET
FIGURE 2 NORTH AMERICA QUINOA MARKET: DATA TRIANGULATION
FIGURE 3 NORTH AMERICA QUINOA MARKET: DROC ANALYSIS
FIGURE 4 NORTH AMERICA QUINOA MARKET: NORTH AMERICA VS REGIONAL MARKET ANALYSIS
FIGURE 5 NORTH AMERICA QUINOA MARKET: COMPANY RESEARCH ANALYSIS
FIGURE 6 NORTH AMERICA QUINOA MARKET: MULTIVARIATE MODELLING
FIGURE 7 NORTH AMERICA QUINOA MARKET: INTERVIEW DEMOGRAPHICS
FIGURE 8 NORTH AMERICA QUINOA MARKET: DBMR MARKET POSITION GRID
FIGURE 9 VENDOR SHARE ANALYSIS
FIGURE 10 NORTH AMERICA QUINOA MARKET: EXECUTIVE SUMMARY
FIGURE 11 NORTH AMERICA QUINOA MARKET: SEGMENTATION
FIGURE 12 TWO SEGMENTS COMPRISE THE NORTH AMERICA QUINOA MARKET, BY TYPE
FIGURE 13 STRATEGIC DECISIONS
FIGURE 14 RISING DEMAND FOR GLUTEN-FREE AND PLANT-BASED FOODS IS EXPECTED TO DRIVE THE NORTH AMERICA QUINOA MARKET IN THE FORECAST PERIOD
FIGURE 15 THE SINGLE SEGMENT IS EXPECTED TO ACCOUNT FOR THE LARGEST SHARE OF THE NORTH AMERICA QUINOA MARKET IN 2025 AND 2032
FIGURE 16 NORTH AMERICA LONG CHAIN POLYAMIDE MARKET, 2024-2032, AVERAGE SELLING PRICE (USD/KG)
FIGURE 17 PATENT FAMILIES
FIGURE 18 NUMBER OF INTERNATIONAL PATENT FAMILIES BY PUBLICATION YEAR
FIGURE 19 DRIVERS, RESTRAINTS, OPPORTUNITIES AND CHALLENGES OF INDONESIA ZEOLITE MARKET
FIGURE 20 NORTH AMERICA QUINOA MARKET, BY TYPE, 2018-2032 (USD THOUSAND)
FIGURE 21 NORTH AMERICA QUINOA MARKET, BY PRODUCT, 2018-2032 (USD THOUSAND)
FIGURE 22 NORTH AMERICA QUINOA MARKET, BY PACKAGING TYPE, 2018-2032 (USD THOUSAND)
FIGURE 23 NORTH AMERICA QUINOA MARKET, BY NATURE, 2018-2032 (USD THOUSAND)
FIGURE 24 NORTH AMERICA QUINOA MARKET, BY DISTRIBUTION CHANNEL, 2018-2032 (USD THOUSAND)
FIGURE 25 NORTH AMERICA QUINOA MARKET: SNAPSHOT (2023)
FIGURE 26 NORTH AMERICA QUINOA MARKET: COMPANY SHARE 2024 (%)
North America Quinoa Market, Supply Chain Analysis and Ecosystem Framework
To support market growth and help clients navigate the impact of geopolitical shifts, DBMR has integrated in-depth supply chain analysis into its North America Quinoa Market research reports. This addition empowers clients to respond effectively to global changes affecting their industries. The supply chain analysis section includes detailed insights such as North America Quinoa Market consumption and production by country, price trend analysis, the impact of tariffs and geopolitical developments, and import and export trends by country and HSN code. It also highlights major suppliers with data on production capacity and company profiles, as well as key importers and exporters. In addition to research, DBMR offers specialized supply chain consulting services backed by over a decade of experience, providing solutions like supplier discovery, supplier risk assessment, price trend analysis, impact evaluation of inflation and trade route changes, and comprehensive market trend analysis.
Data collection and base year analysis are done using data collection modules with large sample sizes. The stage includes obtaining market information or related data through various sources and strategies. It includes examining and planning all the data acquired from the past in advance. It likewise envelops the examination of information inconsistencies seen across different information sources. The market data is analysed and estimated using market statistical and coherent models. Also, market share analysis and key trend analysis are the major success factors in the market report. To know more, please request an analyst call or drop down your inquiry.
The key research methodology used by DBMR research team is data triangulation which involves data mining, analysis of the impact of data variables on the market and primary (industry expert) validation. Data models include Vendor Positioning Grid, Market Time Line Analysis, Market Overview and Guide, Company Positioning Grid, Patent Analysis, Pricing Analysis, Company Market Share Analysis, Standards of Measurement, Global versus Regional and Vendor Share Analysis. To know more about the research methodology, drop in an inquiry to speak to our industry experts.
Data Bridge Market Research is a leader in advanced formative research. We take pride in servicing our existing and new customers with data and analysis that match and suits their goal. The report can be customized to include price trend analysis of target brands understanding the market for additional countries (ask for the list of countries), clinical trial results data, literature review, refurbished market and product base analysis. Market analysis of target competitors can be analyzed from technology-based analysis to market portfolio strategies. We can add as many competitors that you require data about in the format and data style you are looking for. Our team of analysts can also provide you data in crude raw excel files pivot tables (Fact book) or can assist you in creating presentations from the data sets available in the report.


