
North America Refinery Catalyst Market
Market Size in USD Billion
 USD
1.55 Billion
USD
2.32 Billion
2024
2032
USD
1.55 Billion
USD
2.32 Billion
2024
2032
| 2025 - 2032 | |
| USD 1.55 Billion | |
| USD 2.32 Billion | |
| % | |
|
North America Refinery Catalyst Market Size
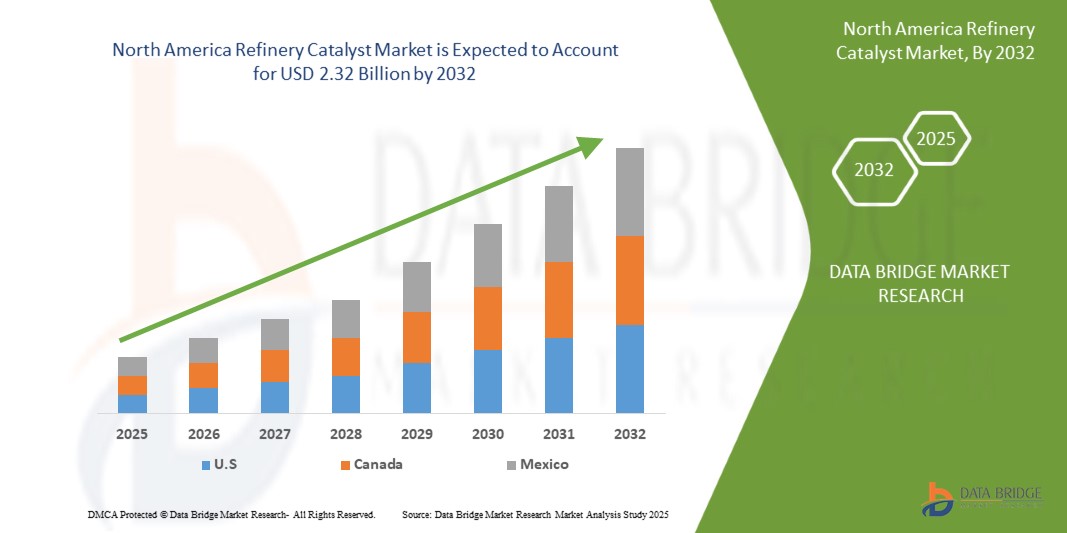
- The North America refinery catalyst market was valued at USD 1.55 billion in 2024 and is expected to reach USD 2.32 billion by 2032
- During the forecast period of 2025 to 2032 the market is likely to grow at a CAGR of 5.21%, primarily driven by rising demand for cleaner fuels
- This growth is driven by factors such as the rising demand for cleaner fuels and stricter environmental regulations
North America Refinery Catalyst Market Analysis
- The refinery catalyst market is expanding globally, driven by the rising demand for cleaner fuels and stricter environmental regulations. Refinery catalysts play a crucial role in enhancing fuel quality, optimizing refinery operations, and reducing emissions
- As governments enforce tighter sulfur content limits and carbon reduction targets, refineries are increasingly investing in advanced catalytic technologies to meet compliance and improve efficiency
- The demand for refinery catalysts is significantly influenced by the global shift toward low-sulfur and ultra-low-sulfur fuels, especially in diesel and gasoline production
- These catalysts are vital in hydroprocessing, fluid catalytic cracking (FCC), and alkylation processes to meet modern fuel standards and improve refinery margins
- The Asia-Pacific region stands out as the dominant market for refinery catalysts, driven by rapid industrialization, urban growth, and rising vehicle ownership. Countries like China and India are investing heavily in refinery upgrades and expansions, boosting demand for catalytic solutions
- Globally, hydroprocessing catalysts lead the market due to their crucial role in sulfur removal and improving fuel stability. Meanwhile, FCC catalysts are gaining prominence as they support higher gasoline yield and help refineries adapt to changing feedstock types
- The future of the market looks promising, with advancements in nanotechnology and renewable feedstock processing paving the way for next-gen catalyst innovation
Report Scope and North America Refinery Catalyst Market Segmentation
|
Attributes |
North America Refinery Catalyst Key Market Insights |
|
Segments Covered |
|
|
Countries Covered |
North America
Europe
Asia-Pacific
Middle East and Africa
South America
|
|
Key Market Players |
|
|
Market Opportunities |
|
|
Value Added Data Infosets |
In addition to the insights on market scenarios such as market value, growth rate, segmentation, geographical coverage, and major players, the market reports curated by the Data Bridge Market Research also include import export analysis, production capacity overview, production consumption analysis, price trend analysis, climate change scenario, supply chain analysis, value chain analysis, raw material/consumables overview, vendor selection criteria, PESTLE Analysis, Porter Analysis, and regulatory framework. |
North America Refinery Catalyst Market Trends
“Technological Advancements and Environmental Compliance”
- One prominent trend in the global refinery catalyst market is the increasing emphasis on technological advancements and environmental compliance
- The industry is experiencing significant growth, driven by the rising need for cleaner fuels and adherence to stringent environmental regulations. Refinery catalysts are essential in upgrading fuel quality, lowering emissions, and ensuring regulatory compliance across global markets
- For instance, in September 2023, BASF launched a next-generation FCC catalyst designed to reduce sulfur emissions while maximizing gasoline yield. This innovation aligns with global environmental mandates and highlights the industry's shift toward sustainable refinery operations
- Modern catalysts used in hydroprocessing and fluid catalytic cracking are increasingly incorporating nanotechnology and smart materials to enhance efficiency, reduce coke formation, and prolong catalyst lifespan
- The increasing demand for eco-friendly refining processes is driving the global refinery catalyst market by aligning with government policies targeting decarbonization and cleaner energy production
- This trend is fostering investment in R&D, expanding market opportunities, and accelerating the transition toward more sustainable refinery operations worldwide
North America Refinery Catalyst Market Dynamics
Driver
“Stringent Environmental Regulations and Cleaner Fuel Demand”
- The global push for cleaner energy is significantly boosting the refinery catalyst market. Stricter environmental regulations, such as low sulfur mandates and carbon emission targets, are compelling refineries to upgrade their catalytic processes
- Catalysts play a critical role in refining operations by improving fuel efficiency, reducing emissions, and enhancing yield quality. As countries adopt policies to reduce air pollution and transition toward greener energy, the demand for advanced refinery catalysts is surging
For instance,
- In 2023, BASF introduced its Fourtiva™ FCC catalyst designed to enhance butylene yield while minimizing dry gas and coke production, aligning with global goals for cleaner fuel output and reduced environmental impact
- The surge in environmental compliance and cleaner fuel initiatives is a major driver for the Global refinery catalyst market. Its alignment with sustainability goals, cleaner emissions, and energy transition strategies makes catalysts indispensable. As governments and industries globally prioritize eco-friendly refining, catalysts are playing a pivotal role in modernizing operations and ensuring future-ready energy infrastructure
Opportunity
“Innovation in Catalyst Formulations”
- Innovation in catalyst formulations presents a significant growth opportunity for the refinery catalyst market, enabling companies to improve efficiency, reduce environmental impact, and meet increasingly stringent regulations
- By developing advanced catalysts with higher selectivity, longer lifespans, and better thermal stability, refineries can optimize their processes for maximum output while minimizing costs and emissions
- In addition, the introduction of sustainable and eco-friendly catalysts will align with the growing global focus on environmental responsibility
For instance,
- According to a report by World Refining, the refinery catalyst market witnessed significant innovations with the development of bio-based catalysts that are more energy-efficient and produce fewer pollutants, addressing both economic and environmental concerns
- A recent Chemicals Today article highlighted the introduction of a new generation of advanced zeolite-based catalysts, which are designed to improve the cracking and reforming processes in refineries. These catalysts not only improve product yield but also reduce energy consumption, presenting a major opportunity for refineries seeking to meet both regulatory and market demands
- Innovation in catalyst formulations provides substantial opportunities by improving operational efficiency, reducing costs, aligning with environmental sustainability goals, and enhancing product quality. Refinery operators can leverage these advancements to remain competitive, meet regulatory demands, and contribute to global sustainability efforts, thus driving market growth in the refinery catalyst sector.
Restraint/Challenge
“High Costs of Raw Materials in Catalyst Production”
- The refinery catalyst market heavily depends on rare and high-cost raw materials such as zeolites, rare earth metals, and alumina, which are subject to global price fluctuations and supply chain constraints
- These high costs directly impact production expenses, posing a challenge for both catalyst manufacturers and end-users. Smaller producers, in particular, struggle to absorb rising costs, which can affect competitiveness, pricing strategies, and product availability
- In addition, geopolitical factors, environmental regulations, and limited mining sources contribute to the volatility of these materials, complicating long-term planning and investment
For instance,
- In November 2023, ICIS News reported a significant increase in the price of rare earth elements, especially lanthanum and cerium, due to export restrictions and supply chain disruptions in major producing countries. These metals are essential in the production of FCC (fluid catalytic cracking) catalysts, making the cost increase a substantial challenge for catalyst manufacturers
- A March 2024 article by Chemical & Engineering News highlighted how alumina prices surged due to increased energy costs and raw material shortages. Since alumina serves as a key support material in many refinery catalysts, this price rise has pressured manufacturers to either absorb costs or pass them on to refiners—leading to tighter margins and potential reductions in R&D spending
- The high costs of raw materials act as a major restraint by driving up production expenses, reducing profit margins, and limiting innovation. These challenges are particularly acute for smaller producers who lack the scale to negotiate favorable procurement terms
- Volatility in raw material prices may also lead to fluctuations in catalyst pricing, affecting refineries’ operational budgets and investment decisions—ultimately influencing the overall growth trajectory of the refinery catalyst market
North America Refinery Catalyst Market Scope
The market is segmented on the basis of type, catalyst, and application.
|
Segmentation |
Sub-Segmentation |
|
Type |
|
|
Catalyst |
|
|
Application |
|
North America Refinery Catalyst Market Regional Analysis
“U.S. is the Dominant Country in the Refinery catalyst market”
- U.S. is expected to dominate the refinery catalyst market, driven by rapid industrialization, expanding refining capacity, and a strong presence of leading market players
- U.S holds a significant share due to its massive oil refining industry, growing demand for petroleum products, and substantial investments in upgrading refinery infrastructure
- Factors such as rising energy demand, government support for cleaner fuel production, increasing fuel consumption, and modernization of existing refineries contribute to the region’s leadership
“U.S. is Projected to Register the Highest Growth Rate”
- The U.S. country is expected to witness the highest growth rate in the refinery catalyst market, fueled by surging energy demand, environmental regulations, and refinery modernization initiatives
- U.S. dominates due to its massive refining sector, strong government initiatives for ultra-low sulfur fuel production, technological advancements, and robust catalyst research and development
North America Refinery Catalyst Market Share
The market competitive landscape provides details by competitor. Details included are company overview, company financials, revenue generated, market potential, investment in research and development, new market initiatives, global presence, production sites and facilities, production capacities, company strengths and weaknesses, product launch, product width and breadth, application dominance. The above data points provided are only related to the companies' focus related to market.
The Major Market Leaders Operating in the Market Are:
- China Petroleum & Chemical Corporation (China)
- Exxon Mobil Corporation (U.S.)
- Shell (Netherlands)
- Antenchem (China)
- Ketjen (U.S.)
- Honeywell International Inc. (U.S.)
- Axens (France)
- BASF (Germany)
- Johnson Matthey (U.K.)
- Clariant (Switzerland)
- Arkema (France)
- JGC HOLDINGS CORPORATION (Japan)
- Dow (U.S.)
Latest Developments in North America Refinery Catalyst Market
- In December 2024, Shell Catalysts & Technologies and Yilkins have partnered to enhance the production of Sustainable Aviation Fuel (SAF). This collaboration aims to improve the efficiency and sustainability of SAF production through advanced catalytic technologies. The partnership will leverage Shell's expertise in catalysts alongside Yilkins' innovative solutions to support the aviation industry's transition to more sustainable fuel alternatives
- In December 2023, Johnson Matthey partnered with Basecamp Research to accelerate the adoption of biocatalysis solutions. This collaboration combines Johnson Matthey's expertise in catalysis with Basecamp's AI-enabled biodiversity genetic mapping to meet the growing demand in the pharmaceutical and chemicals industries. The partnership aims to expand biocatalyst solutions, reducing energy use and waste in pharmaceutical and agrochemical sectors
- In March 2022, ExxonMobil Catalysts and Licensing LLC and KBR have announced a collaboration to enhance propane dehydrogenation (PDH) technology by integrating ExxonMobil's proprietary catalyst with KBR's K-PRO PDH technology, aiming to convert propane into propylene more efficiently. This combined solution is expected to offer financial savings and reduce energy consumption compared to existing PDH technologies. The partnership leverages over 50 years of expertise from both companies in catalyst development and plant design. Doug Kelly, KBR President of Technology, highlighted the potential benefits for both new and existing K-PRO customers, while James Ritchie, President of ExxonMobil Catalysts and Licensing LLC, emphasized the collaboration's role in accelerating the commercialization of their next-generation catalyst
- In May 2022, Arkema and Nippon Shokubai announced a strategic partnership to strengthen their collaboration in innovative specialty materials. This alliance aims to enhance product development and expand market opportunities, particularly in sustainable and high-performance solutions
- In May 2020, Honeywell International Inc. developments in catalysts focus on enhancing refining processes by improving efficiency and product quality. These innovations are designed to optimize the conversion of crude oil into valuable fuels and chemicals, supporting cleaner and more sustainable refinery operations
SKU-

- Interactive Data Analysis Dashboard
- Company Analysis Dashboard for high growth potential opportunities
- Research Analyst Access for customization & queries
- Competitor Analysis with Interactive dashboard
- Latest News, Updates & Trend analysis
- Harness the Power of Benchmark Analysis for Comprehensive Competitor Tracking
Table of Content
1 INTRODUCTION
1.1 OBJECTIVES OF THE STUDY
1.2 MARKET DEFINITION
1.3 OVERVIEW
1.4 LIMITATIONS
1.5 MARKETS COVERED
2 MARKET SEGMENTATION
2.1 MARKETS COVERED
2.2 GEOGRAPHICAL SCOPE
2.3 YEARS CONSIDERED FOR THE STUDY
2.4 CURRENCY AND PRICING
2.5 DBMR TRIPOD DATA VALIDATION MODEL
2.6 MULTIVARIATE MODELING
2.7 PRIMARY INTERVIEWS WITH KEY OPINION LEADERS
2.8 DBMR MARKET POSITION GRID
2.9 DBMR VENDOR SHARE ANALYSIS
2.1 SECONDARY SOURCES
2.11 ASSUMPTIONS
3 EXECUTIVE SUMMARY
4 PREMIUM INSIGHTS
4.1 PESTEL ANALYSIS
4.1.1 POLITICAL FACTORS
4.1.2 ECONOMIC FACTORS
4.1.3 SOCIAL FACTORS
4.1.4 TECHNOLOGICAL FACTORS
4.1.5 ENVIRONMENTAL FACTORS
4.1.6 LEGAL FACTORS
4.2 PORTER’S FIVE FORCES
4.2.1 THREAT OF NEW ENTRANTS
4.2.2 BARGAINING POWER OF SUPPLIERS
4.2.3 BARGAINING POWER OF BUYERS
4.2.4 THREAT OF SUBSTITUTES
4.2.5 INDUSTRY RIVALRY
4.3 PRICING ANALYSIS
4.4 VALUE CHAIN ANALYSIS
4.4.1 PROCUREMENT:
4.4.2 MANUFACTURING:
4.4.3 MARKETING & DISTRIBUTION:
4.5 VENDOR SELECTION CRITERIA
4.5.1 QUALITY AND CONSISTENCY OF SUPPLY
4.5.2 RELIABILITY AND TIMELINESS
4.5.3 COST COMPETITIVENESS
4.5.4 TECHNICAL CAPABILITY AND INNOVATION
4.5.5 REGULATORY COMPLIANCE AND SUSTAINABILITY
4.5.6 FINANCIAL STABILITY
4.5.7 CUSTOMER SERVICE AND SUPPORT
4.6 CLIMATE CHANGE SCENARIO
4.6.1 IMPACT OF REGULATORY PRESSURE AND FUEL STANDARDS
4.6.2 CATALYST INNOVATION IN RESPONSE TO CLIMATE GOALS
4.6.3 CORPORATE CLIMATE COMMITMENTS AND SUSTAINABILITY INTEGRATION
4.6.4 CLIMATE CHANGE AND THE AVAILABILITY OF RAW MATERIALS
4.6.5 RENEWABLE ENERGY TRANSITION AND IMPACT ON DEMAND
4.6.6 CONCLUSION
4.7 PRODUCTION CAPACITY OVERVIEW
4.7.1 OVERVIEW
4.7.2 REGIONAL CAPACITY DISTRIBUTION
4.7.3 KEY PLAYERS & FACILITY FOOTPRINT
4.7.4 EXPANSION PLANS & INVESTMENTS
4.7.5 SUPPLY-DEMAND DYNAMICS
4.7.6 CHALLENGES & FUTURE OUTLOOK
4.8 RAW MATERIAL PRODUCTION COVERAGE
4.8.1 ZEOLITES
4.8.2 TRANSITION METALS
4.8.3 RARE EARTH ELEMENTS (REES)
4.8.4 ALTERNATIVE AND RENEWABLE FEEDSTOCKS
4.9 SUPPLY CHAIN ANALYSIS
4.9.1 OVERVIEW
4.9.2 RAW MATERIAL SOURCING
4.9.3 MANUFACTURING & PROCESSING
4.9.4 LOGISTICS & DISTRIBUTION
4.9.5 END-USE & MARKET DEMAND
4.9.6 CHALLENGES & FUTURE OUTLOOK
4.1 TARIFFS AND THEIR IMPACT ON MARKET
4.10.1 CURRENT TARIFF RATES IN TOP-5 COUNTRY MARKETS
4.10.2 OUTLOOK: LOCAL PRODUCTION V/S IMPORT RELIANCE
4.10.3 VENDOR SELECTION CRITERIA DYNAMICS
4.10.4 IMPACT ON SUPPLY CHAIN
4.10.4.1 RAW MATERIAL PROCUREMENT
4.10.4.2 MANUFACTURING AND PRODUCTION
4.10.4.3 LOGISTICS AND DISTRIBUTION
4.10.4.4 PRICE PITCHING AND POSITION OF MARKET
4.10.5 INDUSTRY PARTICIPANTS: PROACTIVE MOVES
4.10.5.1 SUPPLY CHAIN OPTIMIZATION
4.10.5.2 JOINT VENTURE ESTABLISHMENTS
4.10.6 IMPACT ON PRICES
4.10.7 REGULATORY INCLINATION
4.10.7.1 GEOPOLITICAL SITUATION
4.10.7.2 TRADE PARTNERSHIPS BETWEEN THE COUNTRIES
4.10.7.2.1 FREE TRADE AGREEMENTS
4.10.7.3 ALLIANCES ESTABLISHMENTS
4.10.7.4 STATUS ACCREDITATION (INCLUDING MFTN)
4.10.7.5 DOMESTIC COURSE OF CORRECTION
4.10.7.5.1 INCENTIVE SCHEMES TO BOOST PRODUCTION OUTPUTS
4.10.7.5.2 ESTABLISHMENT OF SPECIAL ECONOMIC ZONES/INDUSTRIAL PARKS
4.11 TECHNOLOGICAL INNOVATIONS ADVANCEMENT BY MANUFACTURERS
4.11.1 PRODUCT INNOVATIONS
4.11.2 INTEGRATION OF ARTIFICIAL INTELLIGENCE IN CATALYST DESIGN
4.11.3 SUSTAINABLE AND ENVIRONMENTALLY FRIENDLY CATALYSTS
4.11.4 ADVANCES UTILIZATION OF NANOTECHNOLOGY
4.11.5 INNOVATIONS DEVELOPMENT OF SOLID ACID CATALYSTS
4.11.6 INNOVATIONS DEVELOPMENT OF SOLID ACID CATALYSTS
5 REGULATION COVERAGE
6 MARKET OVERVIEW
6.1 DRIVERS
6.1.1 RISING DEMAND FOR CLEANER FUELS
6.1.2 EXPANSION OF REFINERY CAPACITY IN EMERGING MARKETS
6.1.3 STRINGENT ENVIRONMENTAL REGULATIONS
6.1.4 GROWING DEMAND FOR HIGH-OCTANE FUELS
6.2 RESTRAINTS
6.2.1 HIGH COST OF ADVANCED CATALYSTS
6.2.2 VOLATILITY IN RAW MATERIAL PRICES
6.3 OPPORTUNITIES
6.3.1 TECHNOLOGICAL ADVANCEMENTS IN CATALYST FORMULATIONS
6.3.2 GROWTH IN BIO-REFINERIES AND RENEWABLE FUELS
6.3.3 ADVANCEMENTS IN CATALYST REGENERATION AND RECYCLING TECHNOLOGIES
6.4 CHALLENGES
6.4.1 FLUCTUATING CRUDE OIL PRICES
6.4.2 HIGH R&D COSTS FOR NEW CATALYST DEVELOPMENT
7 NORTH AMERICA REFINERY CATALYST MARKET, BY TYPE
7.1 OVERVIEW
7.2 HYDROTREATING
7.3 FLUIDIZED CATALYTIC CRACKING (FCC)
7.4 RESIDUE FLUIDIZED CATALYTIC CRACKING (RFCC)
7.5 HYDROCRACKING
7.6 OTHERS
8 NORTH AMERICA REFINERY CATALYST MARKET, BY CATALYST
8.1 OVERVIEW
8.2 CHEMICALS
8.3 ZEOLITES
8.4 METALS
9 NORTH AMERICA REFINERY CATALYST MARKET, BY APPLICATION
9.1 OVERVIEW
9.2 DIESEL
9.3 KEROSENE
9.4 DISTILLATE DEWAX
9.5 OTHERS
10 NORTH AMERICA REFINERY CATALYST MARKET BY REGION
10.2 NORTH AMERICA
10.2.1 U.S.
10.2.2 CANADA
10.2.3 MEXICO
11 NORTH AMERICA REFINING CATALYST MARKET: COMPANY LANDSCAPE
11.1 COMPANY SHARE ANALYSIS: GLOBAL
12 SWOT ANALYSIS
13 COMPANY PROFILES
13.1 BASF
13.1.1 COMPANY SNAPSHOT
13.1.2 REVENUE ANALYSIS
13.1.3 COMPANY SHARE ANALYSIS
13.1.4 PRODUCT PORTFOLIO
13.1.5 RECENT DEVELOPMENT
13.2 EXXON MOBIL CORPORATION
13.2.1 COMPANY SNAPSHOT
13.2.2 REVENUE ANALYSIS
13.2.3 COMPANY SHARE ANALYSIS
13.2.4 PRODUCT PORTFOLIO
13.2.5 RECENT DEVELOPMENT
13.3 SHELL
13.3.1 COMPANY SNAPSHOT
13.3.2 REVENUE ANALYSIS
13.3.3 COMPANY SHARE ANALYSIS
13.3.4 PRODUCT PORTFOLIO
13.3.5 RECENT DEVELOPMENTS
13.4 HONEYWELL INTERNATIONAL INC.
13.4.1 COMPANY SNAPSHOTS
13.4.2 REVENUE ANALYSIS
13.4.3 COMPANY SHARE ANALYSIS
13.4.4 PRODUCT PORTFOLIO
13.4.5 RECENT DEVELOPMENT
13.5 JOHNSON MATTHEY
13.5.1 COMPANY SNAPSHOT
13.5.2 REVENUE ANALYSIS
13.5.3 COMPANY SHARE ANALYSIS
13.5.4 PRODUCT PORTFOLIO
13.5.5 RECENT DEVELOPMENTS
13.6 ANTENCHEM
13.6.1 COMPANY SNAPSHOT
13.6.2 PRODUCT PORTFOLIO
13.6.3 RECENT DEVELOPMENT
13.7 ARKEMA
13.7.1 COMPANY SNAPSHOT
13.7.2 REVENUE ANALYSIS
13.7.3 PRODUCT PORTFOLIO
13.7.4 RECENT DEVELOPMENTS
13.8 AXENS
13.8.1 COMPANY SNAPSHOT
13.8.2 PRODUCT PORTFOLIO
13.8.3 RECENT DEVELOPMENT
13.9 CHINA PETROLEUM & CHEMICAL CORPORATION
13.9.1 COMPANY SNAPSHOT
13.9.2 REVENUE ANALYSIS
13.9.3 PRODUCT PORTFOLIO
13.9.4 RECENT DEVELOPMENT
13.1 CLARIANT
13.10.1 COMPANY SNAPSHOT
13.10.2 REVENUE ANALYSIS
13.10.3 PRODUCT PORTFOLIO
13.10.4 RECENT DEVELOPMENT/NEWS
13.11 DOW
13.11.1 COMPANY SNAPSHOTS
13.11.2 REVENUE ANALYSIS
13.11.3 PRODUCT PORTFOLIO
13.11.4 RECENT DEVELOPMENT/NEWS
13.12 GAZPROMNEFT – SM LLC
13.12.1 COMPANY SNAPSHOT
13.12.2 PRODUCT PORTFOLIO
13.12.3 RECENT DEVELOPMENT
13.13 JGC HOLDINGS CORPORATION
13.13.1 COMPANY SNAPSHOT
13.13.2 REVENUE ANALYSIS
13.13.3 PRODUCT PORTFOLIO
13.13.4 RECENT DEVELOPMENTS
13.14 KETJEN
13.14.1 COMPANY SNAPSHOT
13.14.2 PRODUCT PORTFOLIO
13.14.3 RECENT DEVELOPMENTS
13.15 KUWAIT CATALYST COMPANY
13.15.1 COMPANY SNAPSHOT
13.15.2 PRODUCT PORTFOLIO
13.15.3 RECENT DEVELOPMENTS
14 QUESTIONNAIRE
15 RELATED REPORTS
List of Table
TABLE 1 REGULATORY COVERAGE
TABLE 2 NORTH AMERICA REFINERY CATALYST MARKET, BY TYPE, 2018-2032 (USD THOUSAND)
TABLE 3 NORTH AMERICA REFINERY CATALYST MARKET, BY TYPE, 2018-2032 (TONS)
TABLE 4 NORTH AMERICA HYDROTREATING IN REFINERY CATALYST MARKET, BY REGION, 2018-2032 (USD THOUSAND)
TABLE 5 NORTH AMERICA HYDROTREATING IN REFINERY CATALYST MARKET, BY REGION, 2018-2032 (TONS)
TABLE 6 NORTH AMERICA HYDROTREATING IN REFINERY CATALYST MARKET, BY PRODUCT TYPE, 2018-2032 (USD THOUSAND)
TABLE 7 NORTH AMERICA HYDROTREATING IN REFINERY CATALYST MARKET, BY PRODUCT TYPE, 2018-2032 (TONS)
TABLE 8 NORTH AMERICA FLUIDIZED CATALYTIC CRACKING (FCC) IN REFINERY CATALYST MARKET, BY REGION, 2018-2032 (USD THOUSAND)
TABLE 9 NORTH AMERICA FLUIDIZED CATALYTIC CRACKING (FCC) IN REFINERY CATALYST MARKET, BY REGION, 2018-2032 (TONS)
TABLE 10 NORTH AMERICA RESIDUE FLUIDIZED CATALYTIC CRACKING (RFCC) IN REFINERY CATALYST MARKET, BY REGION, 2018-2032 (USD THOUSAND)
TABLE 11 NORTH AMERICA RESIDUE FLUIDIZED CATALYTIC CRACKING (RFCC) IN REFINERY CATALYST MARKET, BY REGION, 2018-2032 (TONS)
TABLE 12 NORTH AMERICA HYDROCRACKING IN REFINERY CATALYST MARKET, BY REGION, 2018-2032 (USD THOUSAND)
TABLE 13 NORTH AMERICA HYDROCRACKING IN REFINERY CATALYST MARKET, BY REGION, 2018-2032 (TONS)
TABLE 14 NORTH AMERICA OTHERS IN REFINERY CATALYST MARKET, BY REGION, 2018-2032 (USD THOUSAND)
TABLE 15 NORTH AMERICA OTHERS IN REFINERY CATALYST MARKET, BY REGION, 2018-2032 (TONS)
TABLE 16 NORTH AMERICA REFINERY CATALYST MARKET, BY CATALYST, 2018-2032 (USD THOUSAND)
TABLE 17 NORTH AMERICA REFINERY CATALYST MARKET, BY CATALYST, 2018-2032 (TONS)
TABLE 18 NORTH AMERICA CHEMICALS IN REFINERY CATALYST MARKET, BY REGION, 2018-2032 (USD THOUSAND)
TABLE 19 NORTH AMERICA CHEMICALS IN REFINERY CATALYST MARKET, BY REGION, 2018-2032 (TONS)
TABLE 20 NORTH AMERICA CHEMICALS IN REFINERY CATALYST MARKET, BY TYPE, 2018-2032 (USD THOUSAND)
TABLE 21 NORTH AMERICA CHEMICALS IN REFINERY CATALYST MARKET, BY TYPE, 2018-2032 (TONS)
TABLE 22 NORTH AMERICA ZEOLITES IN REFINERY CATALYST MARKET, BY REGION, 2018-2032 (USD THOUSAND)
TABLE 23 NORTH AMERICA ZEOLITES IN REFINERY CATALYST MARKET, BY REGION, 2018-2032 (TONS)
TABLE 24 NORTH AMERICA ZEOLITES IN REFINERY CATALYST MARKET, BY TYPE, 2018-2032 (USD THOUSAND)
TABLE 25 NORTH AMERICA ZEOLITES IN REFINERY CATALYST MARKET, BY TYPE, 2018-2032 (TONS)
TABLE 26 NORTH AMERICA METALS IN REFINERY CATALYST MARKET, BY REGION, 2018-2032 (USD THOUSAND)
TABLE 27 NORTH AMERICA METALS IN REFINERY CATALYST MARKET, BY REGION, 2018-2032 (TONS)
TABLE 28 NORTH AMERICA METALS IN REFINERY CATALYST MARKET, BY TYPE, 2018-2032 (USD THOUSAND)
TABLE 29 NORTH AMERICA METALS IN REFINERY CATALYST MARKET, BY TYPE, 2018-2032 (TONS)
TABLE 30 NORTH AMERICA TRANSITION AND BASE METALS IN REFINERY CATALYST MARKET, BY TYPE, 2018-2032 (USD THOUSAND)
TABLE 31 NORTH AMERICA TRANSITION AND BASE METALS IN REFINERY CATALYST MARKET, BY TYPE, 2018-2032 (TONS)
TABLE 32 NORTH AMERICA PRECIOUS METALS IN REFINERY CATALYST MARKET, BY TYPE, 2018-2032 (USD THOUSAND)
TABLE 33 NORTH AMERICA PRECIOUS METALS IN REFINERY CATALYST MARKET, BY TYPE, 2018-2032 (TONS)
TABLE 34 NORTH AMERICA REFINERY CATALYST MARKET, BY APPLICATION, 2018-2032 (USD THOUSAND)
TABLE 35 NORTH AMERICA REFINERY CATALYST MARKET, BY APPLICATION, 2018-2032 (TONS)
TABLE 36 NORTH AMERICA DIESEL IN REFINERY CATALYST MARKET, BY REGION, 2018-2032 (USD THOUSAND)
TABLE 37 NORTH AMERICA DIESEL IN REFINERY CATALYST MARKET, BY REGION, 2018-2032 (TONS)
TABLE 38 NORTH AMERICA KEROSENE IN REFINERY CATALYST MARKET, BY REGION, 2018-2032 (USD THOUSAND)
TABLE 39 NORTH AMERICA KEROSENE IN REFINERY CATALYST MARKET, BY REGION, 2018-2032 (TONS)
TABLE 40 NORTH AMERICA DISTILLATE DEWAX IN REFINERY CATALYST MARKET, BY REGION, 2018-2032 (USD THOUSAND)
TABLE 41 NORTH AMERICA DISTILLATE DEWAX IN REFINERY CATALYST MARKET, BY REGION, 2018-2032 (TONS)
TABLE 42 NORTH AMERICA OTHERS IN REFINERY CATALYST MARKET, BY REGION, 2018-2032 (USD THOUSAND)
TABLE 43 NORTH AMERICA OTHERS IN REFINERY CATALYST MARKET, BY REGION, 2018-2032 (TONS)
TABLE 44 NORTH AMERICA REFINERY CATALYST MARKET, BY COUNTRY, 2018-2032 (USD THOUSAND)
TABLE 45 NORTH AMERICA REFINERY CATALYST MARKET, BY COUNTRY, 2018-2032 (TONS)
TABLE 46 NORTH AMERICA REFINERY CATALYST MARKET, BY TYPE, 2018-2032 (USD THOUSAND)
TABLE 47 NORTH AMERICA REFINERY CATALYST MARKET, BY TYPE, 2018-2032 (TONS)
TABLE 48 NORTH AMERICA HYDROTREATING IN REFINERY CATALYST MARKET, BY PRODUCT TYPE, 2018-2032 (USD THOUSAND)
TABLE 49 NORTH AMERICA HYDROTREATING IN REFINERY CATALYST MARKET, BY PRODUCT TYPE, 2018-2032 (TONS)
TABLE 50 NORTH AMERICA REFINERY CATALYST MARKET, BY CATALYST, 2018-2032 (USD THOUSAND)
TABLE 51 NORTH AMERICA REFINERY CATALYST MARKET, BY CATALYST, 2018-2032 (TONS)
TABLE 52 NORTH AMERICA CHEMICALS IN REFINERY CATALYST MARKET, BY TYPE, 2018-2032 (USD THOUSAND)
TABLE 53 NORTH AMERICA CHEMICALS IN REFINERY CATALYST MARKET, BY TYPE, 2018-2032 (TONS)
TABLE 54 NORTH AMERICA ZEOLITES IN REFINERY CATALYST MARKET, BY TYPE, 2018-2032 (USD THOUSAND)
TABLE 55 NORTH AMERICA ZEOLITES IN REFINERY CATALYST MARKET, BY TYPE, 2018-2032 (TONS)
TABLE 56 NORTH AMERICA METALS IN REFINERY CATALYST MARKET, BY TYPE, 2018-2032 (USD THOUSAND)
TABLE 57 NORTH AMERICA METALS IN REFINERY CATALYST MARKET, BY TYPE, 2018-2032 (TONS)
TABLE 58 NORTH AMERICA TRANSITION AND BASE METALS IN REFINERY CATALYST MARKET, BY TYPE, 2018-2032 (USD THOUSAND)
TABLE 59 NORTH AMERICA TRANSITION AND BASE METALS IN REFINERY CATALYST MARKET, BY TYPE, 2018-2032 (TONS)
TABLE 60 NORTH AMERICA PRECIOUS METALS IN REFINERY CATALYST MARKET, BY TYPE, 2018-2032 (USD THOUSAND)
TABLE 61 NORTH AMERICA PRECIOUS METALS IN REFINERY CATALYST MARKET, BY TYPE, 2018-2032 (TONS)
TABLE 62 NORTH AMERICA REFINERY CATALYST MARKET, BY APPLICATION, 2018-2032 (USD THOUSAND)
TABLE 63 NORTH AMERICA REFINERY CATALYST MARKET, BY APPLICATION, 2018-2032 (TONS)
TABLE 64 U.S. REFINERY CATALYST MARKET, BY TYPE, 2018-2032 (USD THOUSAND)
TABLE 65 U.S. REFINERY CATALYST MARKET, BY TYPE, 2018-2032 (TONS)
TABLE 66 U.S. HYDROTREATING IN REFINERY CATALYST MARKET, BY PRODUCT TYPE, 2018-2032 (USD THOUSAND)
TABLE 67 U.S. HYDROTREATING IN REFINERY CATALYST MARKET, BY PRODUCT TYPE, 2018-2032 (TONS)
TABLE 68 U.S. REFINERY CATALYST MARKET, BY CATALYST, 2018-2032 (USD THOUSAND)
TABLE 69 U.S. REFINERY CATALYST MARKET, BY CATALYST, 2018-2032 (TONS)
TABLE 70 U.S. CHEMICALS IN REFINERY CATALYST MARKET, BY TYPE, 2018-2032 (USD THOUSAND)
TABLE 71 U.S. CHEMICALS IN REFINERY CATALYST MARKET, BY TYPE, 2018-2032 (TONS)
TABLE 72 U.S. ZEOLITES IN REFINERY CATALYST MARKET, BY TYPE, 2018-2032 (USD THOUSAND)
TABLE 73 U.S. ZEOLITES IN REFINERY CATALYST MARKET, BY TYPE, 2018-2032 (TONS)
TABLE 74 U.S. METALS IN REFINERY CATALYST MARKET, BY TYPE, 2018-2032 (USD THOUSAND)
TABLE 75 U.S. METALS IN REFINERY CATALYST MARKET, BY TYPE, 2018-2032 (TONS)
TABLE 76 U.S. TRANSITION AND BASE METALS IN REFINERY CATALYST MARKET, BY TYPE, 2018-2032 (USD THOUSAND)
TABLE 77 U.S. TRANSITION AND BASE METALS IN REFINERY CATALYST MARKET, BY TYPE, 2018-2032 (TONS)
TABLE 78 U.S. PRECIOUS METALS IN REFINERY CATALYST MARKET, BY TYPE, 2018-2032 (USD THOUSAND)
TABLE 79 U.S. PRECIOUS METALS IN REFINERY CATALYST MARKET, BY TYPE, 2018-2032 (TONS)
TABLE 80 U.S. REFINERY CATALYST MARKET, BY APPLICATION, 2018-2032 (USD THOUSAND)
TABLE 81 U.S. REFINERY CATALYST MARKET, BY APPLICATION, 2018-2032 (TONS)
TABLE 82 CANADA REFINERY CATALYST MARKET, BY TYPE, 2018-2032 (USD THOUSAND)
TABLE 83 CANADA REFINERY CATALYST MARKET, BY TYPE, 2018-2032 (TONS)
TABLE 84 CANADA HYDROTREATING IN REFINERY CATALYST MARKET, BY PRODUCT TYPE, 2018-2032 (USD THOUSAND)
TABLE 85 CANADA HYDROTREATING IN REFINERY CATALYST MARKET, BY PRODUCT TYPE, 2018-2032 (TONS)
TABLE 86 CANADA REFINERY CATALYST MARKET, BY CATALYST, 2018-2032 (USD THOUSAND)
TABLE 87 CANADA REFINERY CATALYST MARKET, BY CATALYST, 2018-2032 (TONS)
TABLE 88 CANADA CHEMICALS IN REFINERY CATALYST MARKET, BY TYPE, 2018-2032 (USD THOUSAND)
TABLE 89 CANADA CHEMICALS IN REFINERY CATALYST MARKET, BY TYPE, 2018-2032 (TONS)
TABLE 90 CANADA ZEOLITES IN REFINERY CATALYST MARKET, BY TYPE, 2018-2032 (USD THOUSAND)
TABLE 91 CANADA ZEOLITES IN REFINERY CATALYST MARKET, BY TYPE, 2018-2032 (TONS)
TABLE 92 CANADA METALS IN REFINERY CATALYST MARKET, BY TYPE, 2018-2032 (USD THOUSAND)
TABLE 93 CANADA METALS IN REFINERY CATALYST MARKET, BY TYPE, 2018-2032 (TONS)
TABLE 94 CANADA TRANSITION AND BASE METALS IN REFINERY CATALYST MARKET, BY TYPE, 2018-2032 (USD THOUSAND)
TABLE 95 CANADA TRANSITION AND BASE METALS IN REFINERY CATALYST MARKET, BY TYPE, 2018-2032 (TONS)
TABLE 96 CANADA PRECIOUS METALS IN REFINERY CATALYST MARKET, BY TYPE, 2018-2032 (USD THOUSAND)
TABLE 97 CANADA PRECIOUS METALS IN REFINERY CATALYST MARKET, BY TYPE, 2018-2032 (TONS)
TABLE 98 CANADA REFINERY CATALYST MARKET, BY APPLICATION, 2018-2032 (USD THOUSAND)
TABLE 99 CANADA REFINERY CATALYST MARKET, BY APPLICATION, 2018-2032 (TONS)
TABLE 100 MEXICO REFINERY CATALYST MARKET, BY TYPE, 2018-2032 (USD THOUSAND)
TABLE 101 MEXICO REFINERY CATALYST MARKET, BY TYPE, 2018-2032 (TONS)
TABLE 102 MEXICO HYDROTREATING IN REFINERY CATALYST MARKET, BY PRODUCT TYPE, 2018-2032 (USD THOUSAND)
TABLE 103 MEXICO HYDROTREATING IN REFINERY CATALYST MARKET, BY PRODUCT TYPE, 2018-2032 (TONS)
TABLE 104 MEXICO REFINERY CATALYST MARKET, BY CATALYST, 2018-2032 (USD THOUSAND)
TABLE 105 MEXICO REFINERY CATALYST MARKET, BY CATALYST, 2018-2032 (TONS)
TABLE 106 MEXICO CHEMICALS IN REFINERY CATALYST MARKET, BY TYPE, 2018-2032 (USD THOUSAND)
TABLE 107 MEXICO CHEMICALS IN REFINERY CATALYST MARKET, BY TYPE, 2018-2032 (TONS)
TABLE 108 MEXICO ZEOLITES IN REFINERY CATALYST MARKET, BY TYPE, 2018-2032 (USD THOUSAND)
TABLE 109 MEXICO ZEOLITES IN REFINERY CATALYST MARKET, BY TYPE, 2018-2032 (TONS)
TABLE 110 MEXICO METALS IN REFINERY CATALYST MARKET, BY TYPE, 2018-2032 (USD THOUSAND)
TABLE 111 MEXICO METALS IN REFINERY CATALYST MARKET, BY TYPE, 2018-2032 (TONS)
TABLE 112 MEXICO TRANSITION AND BASE METALS IN REFINERY CATALYST MARKET, BY TYPE, 2018-2032 (USD THOUSAND)
TABLE 113 MEXICO TRANSITION AND BASE METALS IN REFINERY CATALYST MARKET, BY TYPE, 2018-2032 (TONS)
TABLE 114 MEXICO PRECIOUS METALS IN REFINERY CATALYST MARKET, BY TYPE, 2018-2032 (USD THOUSAND)
TABLE 115 MEXICO PRECIOUS METALS IN REFINERY CATALYST MARKET, BY TYPE, 2018-2032 (TONS)
TABLE 116 MEXICO REFINERY CATALYST MARKET, BY APPLICATION, 2018-2032 (USD THOUSAND)
TABLE 117 MEXICO REFINERY CATALYST MARKET, BY APPLICATION, 2018-2032 (TONS)
List of Figure
FIGURE 1 NORTH AMERICA REFINERY CATALYST MARKET
FIGURE 2 NORTH AMERICA REFINERY CATALYST MARKET: DATA TRIANGULATION
FIGURE 3 NORTH AMERICA REFINERY CATALYST MARKET: DROC ANALYSIS
FIGURE 4 NORTH AMERICA REFINERY CATALYST MARKET: NORTH AMERICA VS REGIONAL MARKET ANALYSIS
FIGURE 5 NORTH AMERICA REFINERY CATALYST MARKET: COMPANY RESEARCH ANALYSIS
FIGURE 6 NORTH AMERICA REFINERY CATALYST MARKET: MULTIVARIATE MODELLING
FIGURE 7 NORTH AMERICA REFINERY CATALYST MARKET: INTERVIEW DEMOGRAPHICS
FIGURE 8 NORTH AMERICA REFINERY CATALYST MARKET: DBMR MARKET POSITION GRID
FIGURE 9 NORTH AMERICA REFINERY CATALYST MARKET: VENDOR SHARE ANALYSIS
FIGURE 10 NORTH AMERICA REFINERY CATALYST MARKET: SEGMENTATION
FIGURE 11 RISING DEMAND FOR CLEANER FUELS IS EXPECTED TO DRIVE THE NORTH AMERICA REFINERY CATALYST MARKET DURING THE FORECAST PERIOD OF 2025 TO 2032
FIGURE 12 THE HYDROTREATING SEGMENT IS EXPECTED TO ACCOUNT FOR THE LARGEST SHARE OF THE NORTH AMERICA REFINERY CATALYST MARKET IN 2025 AND 2032
FIGURE 13 EXECUTIVE SUMMARY
FIGURE 14 FIVE SEGMENTS COMPRISE THE NORTH AMERICA REFINERY CATALYST MARKET, BY TYPE (2024)
FIGURE 15 STRATEGIC DECISIONS
FIGURE 16 PESTEL ANALYSIS
FIGURE 17 PORTER’S FIVE FORCES
FIGURE 18 NORTH AMERICA REFINERY CATALYST MARKET, 2024-2032, AVERAGE SELLING PRICE (USD/KG)
FIGURE 19 VALUE CHAIN ANALYSIS OF THE NORTH AMERICA REFINERY CATALYST MARKET
FIGURE 20 VENDOR SELECTION CRITERIA
FIGURE 21 DRIVERS, RESTRAINTS, OPPORTUNITIES, AND CHALLENGES FOR NORTH AMERICA REFINERY CATALYST MARKET
FIGURE 22 DECLINE IN OIL PRICE
FIGURE 26 NORTH AMERICA REFINERY CATALYST MARKET: SNAPSHOT (2024)
FIGURE 27 NORTH AMERICA REFINING CATALYST MARKET: COMPANY SHARE 2024 (%)
North America Refinery Catalyst Market, Supply Chain Analysis and Ecosystem Framework
To support market growth and help clients navigate the impact of geopolitical shifts, DBMR has integrated in-depth supply chain analysis into its North America Refinery Catalyst Market research reports. This addition empowers clients to respond effectively to global changes affecting their industries. The supply chain analysis section includes detailed insights such as North America Refinery Catalyst Market consumption and production by country, price trend analysis, the impact of tariffs and geopolitical developments, and import and export trends by country and HSN code. It also highlights major suppliers with data on production capacity and company profiles, as well as key importers and exporters. In addition to research, DBMR offers specialized supply chain consulting services backed by over a decade of experience, providing solutions like supplier discovery, supplier risk assessment, price trend analysis, impact evaluation of inflation and trade route changes, and comprehensive market trend analysis.
Data collection and base year analysis are done using data collection modules with large sample sizes. The stage includes obtaining market information or related data through various sources and strategies. It includes examining and planning all the data acquired from the past in advance. It likewise envelops the examination of information inconsistencies seen across different information sources. The market data is analysed and estimated using market statistical and coherent models. Also, market share analysis and key trend analysis are the major success factors in the market report. To know more, please request an analyst call or drop down your inquiry.
The key research methodology used by DBMR research team is data triangulation which involves data mining, analysis of the impact of data variables on the market and primary (industry expert) validation. Data models include Vendor Positioning Grid, Market Time Line Analysis, Market Overview and Guide, Company Positioning Grid, Patent Analysis, Pricing Analysis, Company Market Share Analysis, Standards of Measurement, Global versus Regional and Vendor Share Analysis. To know more about the research methodology, drop in an inquiry to speak to our industry experts.
Data Bridge Market Research is a leader in advanced formative research. We take pride in servicing our existing and new customers with data and analysis that match and suits their goal. The report can be customized to include price trend analysis of target brands understanding the market for additional countries (ask for the list of countries), clinical trial results data, literature review, refurbished market and product base analysis. Market analysis of target competitors can be analyzed from technology-based analysis to market portfolio strategies. We can add as many competitors that you require data about in the format and data style you are looking for. Our team of analysts can also provide you data in crude raw excel files pivot tables (Fact book) or can assist you in creating presentations from the data sets available in the report.


