
Market Analysis and Insights: North America Remote Sensing Technology Market
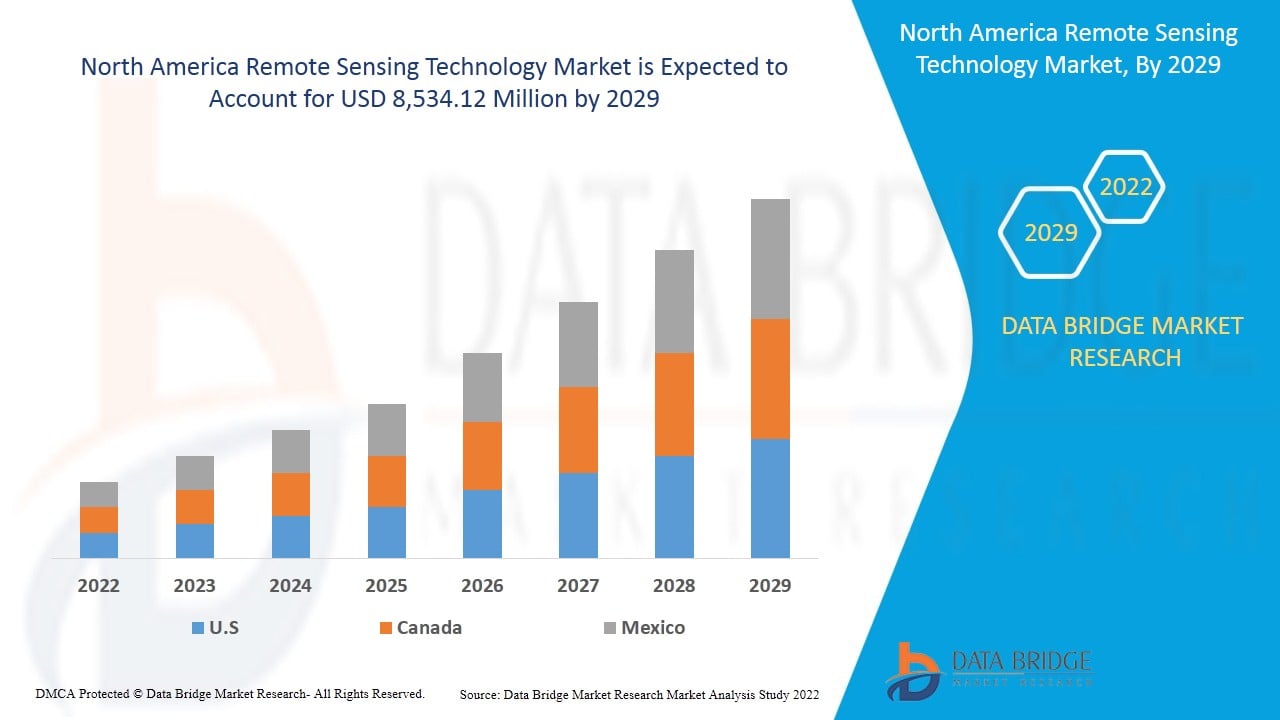
The remote sensing technology market is expected to gain market growth in the forecast period of 2022 to 2029. Data Bridge Market Research analyses that the market is growing with the CAGR of 9.3% in the forecast period of 2022 to 2029 and expected to reach USD 8,534.12 million by 2029. The increasing adoption of Internet of Things (IoT) innovation in the agriculture sector is expected to drive the market growth.
Remote sensing is a type of geospatial technology that emits and reflects electromagnetic (EM) radiation from the Earth’s terrestrial, atmospheric, and aquatic ecosystems in order to detect and monitor the physical characteristics of an area without making physical contact. This technique of data collection typically involves aircraft-based and satellite-based sensor technologies that are categorized as both passive sensors and active sensors. Passive sensors respond to external stimuli, collecting radiation that is reflected or emitted by an object or the surrounding space. The most common source of radiation measured through passive remote sensing is reflected sunlight. Active sensors use internal stimuli to gather data, emitting energy which will scan objects and areas whereupon a sensor measures the energy reflected from the target.
IoT in agriculture makes use of remote sensors, robots, drones, and PC imaging to display screen crops and provide information to farmers for efficient management of the farm. Internet of thing (IoT) sensors are used to gather data this is transmitted for the purpose of analysis. Farmers can display the quality of the crop from a systematic dashboard.
The requirement for high initial investments in the assembling of numerous components is blocking the development of the remote sensing technology marketplace. The market players want to make elements and encode data content material that fulfills the guidelines set by administrative organizations. This restricts the development possibilities for organizations in the marketplace. However, increasing adoption in research and exploration applications is expected to drive the market in the coming years.
The rising demand for the earth observation projects among developed and developing countries is expected to drive the growth of the market. Absence of alertness and interoperability issue is expected to challenge the market’s growth, however rising adoption of remote sensing in research and exploration among different sectors is expected to create an opportunity for the market’s growth. High infrastructure establishment cost may restrain the market’s growth.
The remote sensing technology market report provides details of market share, new developments, and product pipeline analysis, impact of domestic and localized market players, analyses opportunities in terms of emerging revenue pockets, changes in market regulations, product approvals, strategic decisions, product launches, geographic expansions, and technological innovations in the market. To understand the analysis and the Remote sensing technology market scenario contact Data Bridge Market Research for an Analyst Brief, our team will help you create a revenue impact solution to achieve your desired goal.
Remote Sensing Technology Market Scope and Market Size
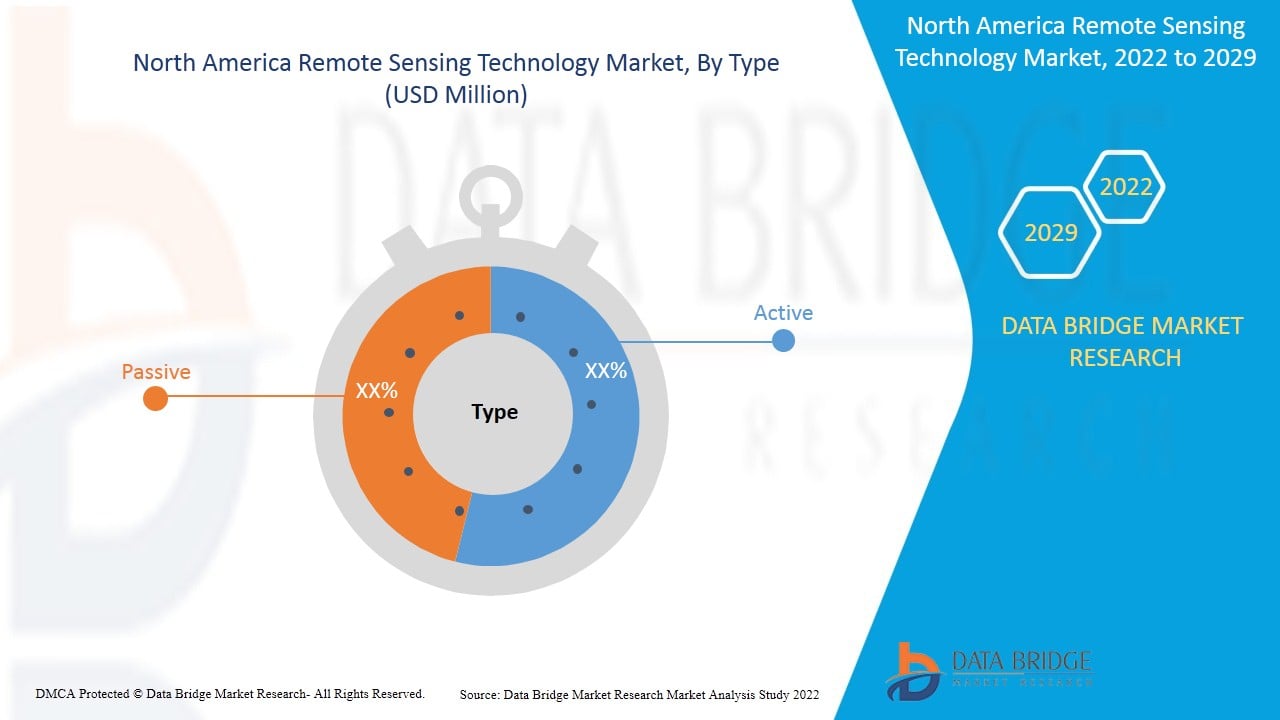
The remote sensing technology market is segmented into four notable segments which are based on the type, system type, image resolution and application. The growth among segments helps you analyze niche pockets of growth and strategies to approach the market and determine your core application areas and the difference in your target markets.
- On the basis of type, the remote sensing technology market is segmented into active and passive. In 2022, the passive segment is expected to dominate the market as passive remote sensing technology provides high-quality satellite images and is widely used for earth observation.
- On the basis of system type, the remote sensing technology market is segmented into visual remote sensing system, infrared remote sensing, optical remote sensing, microwave remote sensing, radar remote sensing, airborne remote sensing, satellite remote sensing, & acoustic, and near-acoustic remote sensing. In 2022, the radar remote sensing segment is expected to dominate the market as it facilitates radio signals that are clear and noise-free for propagating and communicating.
- On the basis of image resolution, the remote sensing technology market is segmented into low spatial resolution sources (> 30 meters), medium resolution satellite (5-30 meters), high resolution industry (1-5 meters), & very high resolution industry (< 1 meter). In 2022, low spatial resolution sources (> 30 meters) are expected to dominate the market as they are highly flame retardant and can be used in a wide range of industrial applications.
- On the basis of application, the remote sensing technology market is segmented into landscape assessment, security, air quality, hydrology, forestry, floodplain mapping and emergency management, healthcare, geology and mineral exploration, oceanography, agriculture & others. In 2022, the landscape assessment segment is expected to dominate the market as it ensures that landscapes are sustainably managed and developed.
Remote Sensing Technology Market Country Level Analysis
The remote sensing technology market is analyzed and market size information is provided by the country, type, system type, image resolution and application as referenced above.
The countries covered in the remote sensing technology market report are the U.S., Canada, and Mexico.
The U.S. is expected to dominate the market due to the presence of key market players and the adoption of remote sensing technology in major applications.
The country section of the report also provides individual market impacting factors and changes in regulation in the market domestically that impacts the current and future trends of the market. Data points such as new sales, replacement sales, country demographics, regulatory acts and import-export tariffs are some of the major pointers used to forecast the market scenario for individual countries. Also, presence and availability of global brands and their challenges faced due to large or scarce competition from local and domestic brands, impact of sales channels are considered while Providing Forecast Analysis Of The Country Data.
Surging Utility in Military and Defense Sector is Expected to Drive the Growth of the Market
The remote sensing technology market also provides you with detailed market analysis for every country growth in particular market. Additionally, it provides the detail information regarding the market players’ strategy and their geographical presence. The data is available for historic period 2011-2020.
Competitive Landscape and Remote Sensing Technology Market Share Analysis
Remote sensing technology market competitive landscape provides details by competitor. Details included are company overview, company financials, revenue generated, market potential, investment in research and development, new market initiatives, production sites and facilities, company strengths and weaknesses, product launch, product trials pipelines, product approvals, patents, product width and breadth, application dominance, technology lifeline curve. The above data points provided are only related to the company’s focus related to remote sensing technology market.
Some of the major players operating in the remote sensing technology market are Northrop Grumman, The Airborne Sensing Corporation ,ITT INC., Leica Geosystems AG - Part of Hexagon, Lockheed Martin Corporation., Honeywell International Inc., Thales Group, Orbital Insight, Ceres Imaging, Satellite Imaging Corporation, Descartes Labs, Inc, Astro Digital US, SlantRange, Inc., Droplet Measurement Technologies, Airbus, Farmers Edge Inc., SCANEX Group., SpaceKnow, Raytheon Technologies Corporation, Terra Remote Sensing, PrecisionHawk and among others.
Many contracts and agreements are also initiated by the companies’ worldwide which are also accelerating the remote sensing technology market.
For instances,
- In December 2021, Airbus completed its second ocean monitoring satellite sentinel-6B. The satellite was built to measure the distance to the sea surface to an accuracy of a few centimeters. The main purpose of the satellite is to measure the height of the sea surface, variations in sea levels, and analyze and observe ocean currents.
- In January 2022, Northrop Grumman Corporation completed a successful precision strike missile rocket motor static test. The rocket motor test was a necessary requirement to validate the company's motor design for production. The company’s investment in digital technologies drives affordability in modern and efficient tactical solid rocket motor production facilities.
SKU-

- Interactive Data Analysis Dashboard
- Company Analysis Dashboard for high growth potential opportunities
- Research Analyst Access for customization & queries
- Competitor Analysis with Interactive dashboard
- Latest News, Updates & Trend analysis
- Harness the Power of Benchmark Analysis for Comprehensive Competitor Tracking
Table of Content
1 INTRODUCTION
1.1 OBJECTIVES OF THE STUDY
1.2 MARKET DEFINITION
1.3 OVERVIEW OF NORTH AMERICA REMOTE SENSING TECHNOLOGY MARKET
1.4 CURRENCY AND PRICING
1.5 LIMITATIONS
1.6 MARKETS COVERED
2 MARKET SEGMENTATION
2.1 MARKETS COVERED
2.2 GEOGRAPHICAL SCOPE
2.3 YEARS CONSIDERED FOR THE STUDY
2.4 DBMR TRIPOD DATA VALIDATION MODEL
2.5 PRIMARY INTERVIEWS WITH KEY OPINION LEADERS
2.6 DBMR MARKET POSITION GRID
2.7 VENDOR SHARE ANALYSIS
2.8 MULTIVARIATE MODELING
2.9 TYPE TIMELINE CURVE
2.1 MARKET APPLICATION COVERAGE GRID
2.11 SECONDARY SOURCES
2.12 ASSUMPTIONS
3 EXECUTIVE SUMMARY
4 PREMIUM INSIGHTS
4.1 IN-DEPTH ANALYSIS ON HYPERSPECTRAL REMOTE SENSING: PREMIUM INSIGHTS
4.1.1 INTRODUCTION
4.1.2 HISTORY
4.1.3 LIST OF HYPERSPECTRAL SENSORS:
4.1.4 APPLICATION OF HYPERSPECTRAL IMAGE ANALYSIS:
4.1.5 PRICING ANALYSIS:
5 REGIONAL SUMMARY
5.1 NORTH AMERICA
5.2 EUROPE
5.3 ASIA-PACIFIC
5.4 MIDDLE EAST AND AFRICA
5.5 SOUTH AMERICAN
6 MARKET OVERVIEW
6.1 DRIVERS
6.1.1 RISING FOCUS TOWARDS EARTH OBSERVATION PROJECTS BETWEEN DEVELOPED AND DEVELOPING COUNTRIES
6.1.2 SURGING UTILITY IN MILITARY AND DEFENCE SECTOR
6.1.3 GROWING ADOPTION OF PRECISION FARMING TECHNOLOGY
6.2 RESTRAINT
6.2.1 HIGH INFRASTRUCTURE ESTABLISHMENT COST
6.3 OPPORTUNITIES
6.3.1 RISING ADOPTION OF REMOTE SENSING IN RESEARCH AND EXPLORATION AMONG DIFFERENT SECTORS
6.3.2 RISE IN ADOPTION OF INTERNET OF THING (IOT) IN REMOTE SENSING TECHNOLOGY
6.4 CHALLENGE
6.4.1 ABSENCE OF ALERTNESS AND INTEROPERABILITY ISSUE
7 IMPACT OF COVID-19 ON THE NORTH AMERICA REMOTE SENSING TECHNOLOGY MARKET
7.1 ANALYSIS ON IMPACT OF COVID-19 ON THE MARKET
7.2 STRATEGIC DECISION BY MANUFACTURERS AFTER COVID-19
7.3 IMPACT ON PRICE
7.4 IMPACT ON DEMAND AND SUPPLY CHAIN
7.5 CONCLUSION
8 NORTH AMERICA REMOTE SENSING TECHNOLOGY MARKET, BY TYPE
8.1 OVERVIEW
8.2 PASSIVE
8.2.1 NEAR INFRARED
8.2.2 THERMAL INFRARED ENERGY
8.2.3 VISIBLE
8.3 ACTIVE
8.3.1 RADAR
8.3.2 LASER
8.3.3 SONAR
9 NORTH AMERICA REMOTE SENSING TECHNOLOGY MARKET, BY SYSTEM TYPE
9.1 OVERVIEW
9.2 RADAR REMOTE SENSING
9.3 AIRBORNE REMOTE SENSING
9.4 SATELLITE REMOTE SENSING
9.5 MICROWAVE REMOTE SENSING
9.6 INFRARED REMOTE SENSING
9.7 ACOUSTIC AND NEAR ACOUSTIC REMOTE SENSING
9.8 OPTICAL REMOTE SENSING
9.9 VISUAL REMOTE SENSING
10 NORTH AMERICA REMOTE SENSING TECHNOLOGY MARKET, BY IMAGE RESOLUTION
10.1 OVERVIEW
10.2 LOW SPATIAL RESOLUTION RESOURCE (>30 METERS)
10.3 MEDIUM RESOLUTION SATELLITE (5-30 METERS)
10.4 HIGH RESOLUTION INDUSTRY (1-5 METERS)
10.5 VERY HIGH RESOLUTION INDUSTRY (< 1 METER)
11 NORTH AMERICA REMOTE SENSING TECHNOLOGY MARKET, BY APPLICATION
11.1 OVERVIEW
11.2 LANDSCAPE ASSESSMENT
11.2.1 RURAL/URBAN CHANGE
11.2.2 BIOMASS MAPPING
11.3 SECURITY
11.4 GEOLOGY AND MINERAL EXPLORATION
11.5 HYDROLOGY
11.5.1 FLOOD DELINEATION AND MAPPING
11.5.2 SOIL MOISTURE
11.6 FORESTRY
11.6.1 COASTAL PROTECTION
11.6.2 BIOMASS ESTIMATION
11.6.3 AGROFORESTRY MAPPING
11.6.4 BURN DELINEATION
11.6.5 DEPLETION MONITORING
11.7 HEALTHCARE
11.8 AIR QUALITY
11.9 FLOOD PLAIN MAPPING AND EMERGENCY MANAGEMENT
11.1 AGRICULTURE
11.10.1 CROP MONITORING & DAMAGE ASSESSMENT
11.10.2 CROP TYPE MAPPING
11.11 OCEANOGRAPHY
11.12 OTHERS
12 NORTH AMERICA REMOTE SENSING TECHNOLOGY MARKET, BY REGION
12.1 OVERVIEW
12.2 NORTH AMERICA
12.2.1 U.S.
12.2.2 CANADA
12.2.3 MEXICO
13 NORTH AMERICA REMOTE SENSING TECHNOLOGY MARKET: COMPANY LANDSCAPE
13.1 COMPANY SHARE ANALYSIS: NORTH AMERICA
14 SWOT ANALYSIS.
15 COMPANY PROFILE
15.1 NORTHROP GRUMMAN
15.1.1 COMPANY SNAPSHOT
15.1.2 REVENUE ANALYSIS
15.1.3 COMPANY SHARE ANALYSIS
15.1.4 PRODUCT PORTFOLIO
15.1.5 RECENT DEVELOPMENTS
15.2 RAYTHEON TECHNOLOGIES CORPORATION
15.2.1 COMPANY SNAPSHOT
15.2.2 COMPANY SHARE ANALYSIS
15.2.3 PRODUCT PORTFOLIO
15.2.4 RECENT DEVELOPMENT
15.3 LOCKHEED MARTIN CORPORATION.
15.3.1 COMPANY SNAPSHOT
15.3.2 REVENUE ANALYSIS
15.3.3 COMPANY SHARE ANALYSIS
15.3.4 PRODUCT PORTFOLIO
15.3.5 RECENT DEVELOPMENTS
15.4 THALES GROUP
15.4.1 COMPANY SNAPSHOT
15.4.2 COMPANY SHARE ANALYSIS
15.4.3 PRODUCT PORTFOLIO
15.4.4 RECENT DEVELOPMENTS
15.5 AIRBUS
15.5.1 COMPANY SNAPSHOT
15.5.2 REVENUE ANALYSIS
15.5.3 COMPANY SHARE ANALYSIS
15.5.4 PRODUCT PORTFOLIO
15.5.5 RECENT DEVELOPMENT
15.6 ASTRO DIGITAL US
15.6.1 COMPANY SNAPSHOT
15.6.2 PRODUCT PORTFOLIO
15.6.3 RECENT DEVELOPMENT
15.7 CERES IMAGING
15.7.1 COMPANY SNAPSHOT
15.7.2 PRODUCT PORTFOLIO
15.7.3 RECENT DEVELOPMENT
15.8 DESCARTES LABS, INC
15.8.1 COMPANY SNAPSHOT
15.8.2 PRODUCT PORTFOLIO
15.8.3 RECENT DEVELOPMENT
15.9 DROPLET MEASUREMENT TECHNOLOGIES
15.9.1 COMPANY SNAPSHOT
15.9.2 PRODUCT PORTFOLIO
15.9.3 RECENT DEVELOPMENT
15.1 FARMERS EDGE INC.
15.10.1 COMPANY SNAPSHOT
15.10.2 REVENUE ANALYSIS
15.10.3 PRODUCT PORTFOLIO
15.10.4 RECENT DEVELOPMENT
15.11 HONEYWELL INTERNATIONAL INC.
15.11.1 COMPANY SNAPSHOT
15.11.2 REVENUE ANALYSIS
15.11.3 PRODUCT PORTFOLIO
15.11.4 RECENT DEVELOPMENTS
15.12 ITT INC.
15.12.1 COMPANY SNAPSHOT
15.12.2 REVENUE ANALYSIS
15.12.3 PRODUCT PORTFOLIO
15.12.4 RECENT DEVELOPMENT
15.13 LEICA GEOSYSTEMS AG - PART OF HEXAGON
15.13.1 COMPANY SNAPSHOT
15.13.2 PRODUCT PORTFOLIO
15.13.3 RECENT DEVELOPMENTS
15.14 MALLON TECHNOLOGY
15.14.1 COMPANY SNAPSHOT
15.14.2 PRODUCT PORTFOLIO
15.14.3 RECENT DEVELOPMENT
15.15 MAXAR TECHNOLOGIES
15.15.1 COMPANY SNAPSHOT
15.15.2 PRODUCT PORTFOLIO
15.15.3 RECENT DEVELOPMENT
15.16 ORBITAL INSIGHT
15.16.1 COMPANY SNAPSHOT
15.16.2 PRODUCT PORTFOLIO
15.16.3 RECENT DEVELOPMENT
15.17 PRECISIONHAWK
15.17.1 COMPANY SNAPSHOT
15.17.2 PRODUCT PORTFOLIO
15.17.3 RECENT DEVELOPMENT
15.18 SATELLITE IMAGING CORPORATION
15.18.1 COMPANY SNAPSHOT
15.18.2 PRODUCT PORTFOLIO
15.18.3 RECENT DEVELOPMENT
15.19 SLANTRANGE, INC.
15.19.1 COMPANY SNAPSHOT
15.19.2 PRODUCT PORTFOLIO
15.19.3 RECENT DEVELOPMENT
15.2 SCANEX GROUP.
15.20.1 COMPANY SNAPSHOT
15.20.2 PRODUCT PORTFOLIO
15.20.3 RECENT DEVELOPMENT
15.21 SPACEKNOW
15.21.1 COMPANY SNAPSHOT
15.21.2 PRODUCT PORTFOLIO
15.21.3 RECENT DEVELOPMENT
15.22 THE AIRBORNE SENSING CORPORATION
15.22.1 COMPANY SNAPSHOT
15.22.2 PRODUCT PORTFOLIO
15.22.3 RECENT DEVELOPMENT
15.23 TERRA REMOTE SENSING
15.23.1 COMPANY SNAPSHOT
15.23.2 PRODUCT PORTFOLIO
15.23.3 RECENT DEVELOPMENT
16 QUESTIONNAIRE
17 RELATED REPORT
List of Table
TABLE 1 WAVELENGTH RANGES APPLIED IN HYPERSPECTRAL REMOTE SENSING
TABLE 2 THE COSTS OF VARIOUS OPTICAL AND MICROWAVE SATELLITE DATA USED FOR CROP AREA ESTIMATION
TABLE 3 NORTH AMERICA REMOTE SENSING TECHNOLOGY MARKET, BY TYPE, 2020-2029 (USD MILLION)
TABLE 4 NORTH AMERICA PASSIVE IN REMOTE SENSING TECHNOLOGY MARKET, BY REGION, 2020-2029 (USD MILLION)
TABLE 5 NORTH AMERICA PASSIVE IN REMOTE SENSING TECHNOLOGY MARKET, BY TYPE, 2020-2029 (USD MILLION)
TABLE 6 NORTH AMERICA ACTIVE IN REMOTE SENSING TECHNOLOGY MARKET, BY REGION, 2020-2029 (USD MILLION)
TABLE 7 NORTH AMERICA ACTIVE IN REMOTE SENSING TECHNOLOGY MARKET, BY TYPE, 2020-2029 (USD MILLION)
TABLE 8 NORTH AMERICA REMOTE SENSING TECHNOLOGY MARKET, BY SYSTEM TYPE, 2020-2029 (USD MILLION)
TABLE 9 NORTH AMERICA RADAR REMOTE SENSING IN REMOTE SENSING TECHNOLOGY MARKET, BY REGION, 2020-2029 (USD MILLION)
TABLE 10 NORTH AMERICA AIRBORNE REMOTE SENSING IN REMOTE SENSING TECHNOLOGY MARKET, BY REGION, 2020-2029 (USD MILLION)
TABLE 11 NORTH AMERICA SATELLITE REMOTE SENSING IN REMOTE SENSING TECHNOLOGY MARKET, BY REGION, 2020-2029 (USD MILLION)
TABLE 12 NORTH AMERICA MICROWAVE REMOTE SENSING IN REMOTE SENSING TECHNOLOGY MARKET, BY REGION, 2020-2029 (USD MILLION)
TABLE 13 NORTH AMERICA INFRARED REMOTE SENSING IN REMOTE SENSING TECHNOLOGY MARKET, BY REGION, 2020-2029 (USD MILLION)
TABLE 14 NORTH AMERICA ACOUSTIC AND NEAR ACOUSTIC REMOTE SENSING IN REMOTE SENSING TECHNOLOGY MARKET, BY REGION, 2020-2029 (USD MILLION)
TABLE 15 NORTH AMERICA OPTICAL REMOTE SENSING IN REMOTE SENSING TECHNOLOGY MARKET, BY REGION, 2020-2029 (USD MILLION)
TABLE 16 NORTH AMERICA VISUAL REMOTE SENSING IN REMOTE SENSING TECHNOLOGY MARKET, BY REGION, 2020-2029 (USD MILLION)
TABLE 17 NORTH AMERICA REMOTE SENSING TECHNOLOGY MARKET, BY IMAGE RESOLUTION, 2020-2029 (USD MILLION)
TABLE 18 NORTH AMERICA LOW SPATIAL RESOLUTION RESOURCES (> 30 METERS) IN REMOTE SENSING TECHNOLOGY MARKET, BY REGION, 2020-2029 (USD MILLION)
TABLE 19 NORTH AMERICA MEDIUM RESOLUTION SATELLITE (5-30 METERS) IN REMOTE SENSING TECHNOLOGY MARKET, BY REGION, 2020-2029 (USD MILLION)
TABLE 20 NORTH AMERICA HIGH RESOLUTION INDUSTRY (1-5 METERS) IN REMOTE SENSING TECHNOLOGY MARKET, BY REGION, 2020-2029 (USD MILLION)
TABLE 21 NORTH AMERICA VERY HIGH RESOLUTION INDUSTRY (< 1 METER) IN REMOTE SENSING TECHNOLOGY MARKET, BY REGION, 2020-2029 (USD MILLION)
TABLE 22 NORTH AMERICA REMOTE SENSING TECHNOLOGY MARKET, BY APPLICATION, 2020-2029 (USD MILLION)
TABLE 23 NORTH AMERICA LANDSCAPE ASSESSMENT IN REMOTE SENSING TECHNOLOGY MARKET, BY REGION, 2020-2029 (USD MILLION)
TABLE 24 NORTH AMERICA LANDSCAPE ASSESSMENT IN REMOTE SENSING TECHNOLOGY MARKET, BY TYPE, 2020-2029 (USD MILLION)
TABLE 25 NORTH AMERICA SECURITY IN REMOTE SENSING TECHNOLOGY MARKET, BY REGION, 2020-2029 (USD MILLION)
TABLE 26 NORTH AMERICA GEOLOGY AND MINERAL EXPLORATION IN REMOTE SENSING TECHNOLOGY MARKET, BY REGION, 2020-2029 (USD MILLION)
TABLE 27 NORTH AMERICA HYDROLOGY IN REMOTE SENSING TECHNOLOGY MARKET, BY REGION, 2020-2029 (USD MILLION)
TABLE 28 NORTH AMERICA HYDROLOGY IN REMOTE SENSING TECHNOLOGY MARKET, BY TYPE, 2020-2029 (USD MILLION)
TABLE 29 NORTH AMERICA FORESTRY IN REMOTE SENSING TECHNOLOGY MARKET, BY REGION, 2020-2029 (USD MILLION)
TABLE 30 NORTH AMERICA FORESTRY IN REMOTE SENSING TECHNOLOGY MARKET, BY TYPE, 2020-2029 (USD MILLION)
TABLE 31 NORTH AMERICA HEALTHCARE IN REMOTE SENSING TECHNOLOGY MARKET, BY REGION, 2020-2029 (USD MILLION)
TABLE 32 NORTH AMERICA AIR QUALITY IN REMOTE SENSING TECHNOLOGY MARKET, BY REGION, 2020-2029 (USD MILLION)
TABLE 33 NORTH AMERICA FLOOD PLAIN MAPPING AND EMERGENCY MANAGEMENT IN REMOTE SENSING TECHNOLOGY MARKET, BY REGION, 2020-2029 (USD MILLION)
TABLE 34 NORTH AMERICA AGRICULTURE IN REMOTE SENSING TECHNOLOGY MARKET, BY REGION, 2020-2029 (USD MILLION)
TABLE 35 NORTH AMERICA AGRICULTURE IN REMOTE SENSING TECHNOLOGY MARKET, BY TYPE, 2020-2029 (USD MILLION)
TABLE 36 NORTH AMERICA OCEANOGRAPHY IN REMOTE SENSING TECHNOLOGY MARKET, BY REGION, 2020-2029 (USD MILLION)
TABLE 37 NORTH AMERICA OTHERS IN REMOTE SENSING TECHNOLOGY MARKET, BY REGION, 2020-2029 (USD MILLION)
TABLE 38 NORTH AMERICA REMOTE SENSING TECHNOLOGY MARKET, BY REGION, 2020-2029 (USD MILLION)
TABLE 39 NORTH AMERICA REMOTE SENSING TECHNOLOGY MARKET, BY COUNTRY, 2020-2029 (USD MILLION)
TABLE 40 NORTH AMERICA REMOTE SENSING TECHNOLOGY MARKET, BY TYPE, 2020-2029 (USD MILLION)
TABLE 41 NORTH AMERICA PASSIVE IN REMOTE SENSING TECHNOLOGY MARKET, BY TYPE, 2020-2029 (USD MILLION)
TABLE 42 NORTH AMERICA ACTIVE IN REMOTE SENSING TECHNOLOGY MARKET, BY TYPE, 2020-2029 (USD MILLION)
TABLE 43 NORTH AMERICA REMOTE SENSING TECHNOLOGY MARKET, BY SYSTEM TYPE, 2020-2029 (USD MILLION)
TABLE 44 NORTH AMERICA REMOTE SENSING TECHNOLOGY MARKET, BY IMAGE RESOLUTION, 2020-2029 (USD MILLION)
TABLE 45 NORTH AMERICA REMOTE SENSING TECHNOLOGY MARKET, BY APPLICATION, 2020-2029 (USD MILLION)
TABLE 46 NORTH AMERICA LANDSCAPE ASSESSMENT IN REMOTE SENSING TECHNOLOGY MARKET, BY TYPE, 2020-2029 (USD MILLION)
TABLE 47 NORTH AMERICA HYDROLOGY IN REMOTE SENSING TECHNOLOGY MARKET, BY TYPE, 2020-2029 (USD MILLION)
TABLE 48 NORTH AMERICA FORESTRY IN REMOTE SENSING TECHNOLOGY MARKET, BY TYPE, 2020-2029 (USD MILLION)
TABLE 49 NORTH AMERICA AGRICULTURE IN REMOTE SENSING TECHNOLOGY MARKET, BY TYPE, 2020-2029 (USD MILLION)
TABLE 50 U.S. REMOTE SENSING TECHNOLOGY MARKET, BY TYPE, 2020-2029 (USD MILLION)
TABLE 51 U.S. PASSIVE IN REMOTE SENSING TECHNOLOGY MARKET, BY TYPE, 2020-2029 (USD MILLION)
TABLE 52 U.S. ACTIVE IN REMOTE SENSING TECHNOLOGY MARKET, BY TYPE, 2020-2029 (USD MILLION)
TABLE 53 U.S. REMOTE SENSING TECHNOLOGY MARKET, BY SYSTEM TYPE, 2020-2029 (USD MILLION)
TABLE 54 U.S. REMOTE SENSING TECHNOLOGY MARKET, BY IMAGE RESOLUTION, 2020-2029 (USD MILLION)
TABLE 55 U.S. REMOTE SENSING TECHNOLOGY MARKET, BY APPLICATION, 2020-2029 (USD MILLION)
TABLE 56 U.S. LANDSCAPE ASSESSMENT IN REMOTE SENSING TECHNOLOGY MARKET, BY TYPE, 2020-2029 (USD MILLION)
TABLE 57 U.S. HYDROLOGY IN REMOTE SENSING TECHNOLOGY MARKET, BY TYPE, 2020-2029 (USD MILLION)
TABLE 58 U.S. FORESTRY IN REMOTE SENSING TECHNOLOGY MARKET, BY TYPE, 2020-2029 (USD MILLION)
TABLE 59 U.S. AGRICULTURE IN REMOTE SENSING TECHNOLOGY MARKET, BY TYPE, 2020-2029 (USD MILLION)
TABLE 60 CANADA REMOTE SENSING TECHNOLOGY MARKET, BY TYPE, 2020-2029 (USD MILLION)
TABLE 61 CANADA PASSIVE IN REMOTE SENSING TECHNOLOGY MARKET, BY TYPE, 2020-2029 (USD MILLION)
TABLE 62 CANADA ACTIVE IN REMOTE SENSING TECHNOLOGY MARKET, BY TYPE, 2020-2029 (USD MILLION)
TABLE 63 CANADA REMOTE SENSING TECHNOLOGY MARKET, BY SYSTEM TYPE, 2020-2029 (USD MILLION)
TABLE 64 CANADA REMOTE SENSING TECHNOLOGY MARKET, BY IMAGE RESOLUTION, 2020-2029 (USD MILLION)
TABLE 65 CANADA REMOTE SENSING TECHNOLOGY MARKET, BY APPLICATION, 2020-2029 (USD MILLION)
TABLE 66 CANADA LANDSCAPE ASSESSMENT IN REMOTE SENSING TECHNOLOGY MARKET, BY TYPE, 2020-2029 (USD MILLION)
TABLE 67 CANADA HYDROLOGY IN REMOTE SENSING TECHNOLOGY MARKET, BY TYPE, 2020-2029 (USD MILLION)
TABLE 68 CANADA FORESTRY IN REMOTE SENSING TECHNOLOGY MARKET, BY TYPE, 2020-2029 (USD MILLION)
TABLE 69 CANADA AGRICULTURE IN REMOTE SENSING TECHNOLOGY MARKET, BY TYPE, 2020-2029 (USD MILLION)
TABLE 70 MEXICO REMOTE SENSING TECHNOLOGY MARKET, BY TYPE, 2020-2029 (USD MILLION)
TABLE 71 MEXICO PASSIVE IN REMOTE SENSING TECHNOLOGY MARKET, BY TYPE, 2020-2029 (USD MILLION)
TABLE 72 MEXICO ACTIVE IN REMOTE SENSING TECHNOLOGY MARKET, BY TYPE, 2020-2029 (USD MILLION)
TABLE 73 MEXICO REMOTE SENSING TECHNOLOGY MARKET, BY SYSTEM TYPE, 2020-2029 (USD MILLION)
TABLE 74 MEXICO REMOTE SENSING TECHNOLOGY MARKET, BY IMAGE RESOLUTION, 2020-2029 (USD MILLION)
TABLE 75 MEXICO REMOTE SENSING TECHNOLOGY MARKET, BY APPLICATION, 2020-2029 (USD MILLION)
TABLE 76 MEXICO LANDSCAPE ASSESSMENT IN REMOTE SENSING TECHNOLOGY MARKET, BY TYPE, 2020-2029 (USD MILLION)
TABLE 77 MEXICO HYDROLOGY IN REMOTE SENSING TECHNOLOGY MARKET, BY TYPE, 2020-2029 (USD MILLION)
TABLE 78 MEXICO FORESTRY IN REMOTE SENSING TECHNOLOGY MARKET, BY TYPE, 2020-2029 (USD MILLION)
TABLE 79 MEXICO AGRICULTURE IN REMOTE SENSING TECHNOLOGY MARKET, BY TYPE, 2020-2029 (USD MILLION)
List of Figure
FIGURE 1 NORTH AMERICA REMOTE SENSING TECHNOLOGY MARKET: SEGMENTATION
FIGURE 2 NORTH AMERICA REMOTE SENSING TECHNOLOGY MARKET: DATA TRIANGULATION
FIGURE 3 NORTH AMERICA REMOTE SENSING TECHNOLOGY MARKET: DROC ANALYSIS
FIGURE 4 NORTH AMERICA REMOTE SENSING TECHNOLOGY MARKET: NORTH AMERICA VS REGIONAL MARKET ANALYSIS
FIGURE 5 NORTH AMERICA REMOTE SENSING TECHNOLOGY MARKET: COMPANY RESEARCH ANALYSIS
FIGURE 6 NORTH AMERICA REMOTE SENSING TECHNOLOGY MARKET: INTERVIEW DEMOGRAPHICS
FIGURE 7 NORTH AMERICA REMOTE SENSING TECHNOLOGY MARKET: DBMR MARKET POSITION GRID
FIGURE 8 NORTH AMERICA REMOTE SENSING TECHNOLOGY MARKET: VENDOR SHARE ANALYSIS
FIGURE 9 NORTH AMERICA REMOTE SENSING TECHNOLOGY MARKET: MARKET APPLICATION COVERAGE GRID
FIGURE 10 NORTH AMERICA REMOTE SENSING TECHNOLOGY MARKET: SEGMENTATION
FIGURE 11 SURGING UTILITY IN MILITARY AND DEFENSE SECTOR IS EXPECTED TO DRIVE THE NORTH AMERICA REMOTE SENSING TECHNOLOGY MARKET IN THE FORECAST PERIOD OF 2022 TO 2029
FIGURE 12 PASSIVE SEGMENT IS EXPECTED TO ACCOUNT FOR THE LARGEST SHARE OF NORTH AMERICA REMOTE SENSING TECHNOLOGY MARKET IN 2022 & 2029
FIGURE 13 NORTH AMERICA IS EXPECTED TO DOMINATE AND IS THE FASTEST-GROWING REGION IN THE NORTH AMERICA REMOTE SENSING TECHNOLOGY MARKET IN THE FORECAST PERIOD OF 2022 TO 2029
FIGURE 14 DRIVERS, RESTRAINT, OPPORTUNITIES, CHALLENGE OF NORTH AMERICA REMOTE SENSING TECHNOLOGY MARKET
FIGURE 15 NORTH AMERICA REMOTE SENSING TECHNOLOGY MARKET: BY TYPE, 2021
FIGURE 16 NORTH AMERICA REMOTE SENSING TECHNOLOGY MARKET: BY SYSTEM TYPE, 2021
FIGURE 17 NORTH AMERICA REMOTE SENSING TECHNOLOGY MARKET: BY IMAGE RESOLUTION, 2021
FIGURE 18 NORTH AMERICA REMOTE SENSING TECHNOLOGY MARKET: BY APPLICATION, 2021
FIGURE 19 NORTH AMERICA REMOTE SENSING TECHNOLOGY MARKET: SNAPSHOT (2021)
FIGURE 20 NORTH AMERICA REMOTE SENSING TECHNOLOGY MARKET: BY REGION (2021)
FIGURE 21 NORTH AMERICA REMOTE SENSING TECHNOLOGY MARKET: BY REGION (2022 & 2029)
FIGURE 22 NORTH AMERICA REMOTE SENSING TECHNOLOGY MARKET: BY REGION (2021 & 2029)
FIGURE 23 NORTH AMERICA REMOTE SENSING TECHNOLOGY MARKET: BY TYPE (2022-2029)
FIGURE 24 NORTH AMERICA REMOTE SENSING TECHNOLOGY MARKET: SNAPSHOT (2021)
FIGURE 25 NORTH AMERICA REMOTE SENSING TECHNOLOGY MARKET: BY COUNTRY (2021)
FIGURE 26 NORTH AMERICA REMOTE SENSING TECHNOLOGY MARKET: BY COUNTRY (2022 & 2029)
FIGURE 27 NORTH AMERICA REMOTE SENSING TECHNOLOGY MARKET: BY COUNTRY (2021 & 2029)
FIGURE 28 NORTH AMERICA REMOTE SENSING TECHNOLOGY MARKET: BY TYPE (2022-2029)
FIGURE 29 NORTH AMERICA REMOTE SENSING TECHNOLOGY MARKET: COMPANY SHARE 2021 (%)
North America Remote Sensing Technology Market, Supply Chain Analysis and Ecosystem Framework
To support market growth and help clients navigate the impact of geopolitical shifts, DBMR has integrated in-depth supply chain analysis into its North America Remote Sensing Technology Market research reports. This addition empowers clients to respond effectively to global changes affecting their industries. The supply chain analysis section includes detailed insights such as North America Remote Sensing Technology Market consumption and production by country, price trend analysis, the impact of tariffs and geopolitical developments, and import and export trends by country and HSN code. It also highlights major suppliers with data on production capacity and company profiles, as well as key importers and exporters. In addition to research, DBMR offers specialized supply chain consulting services backed by over a decade of experience, providing solutions like supplier discovery, supplier risk assessment, price trend analysis, impact evaluation of inflation and trade route changes, and comprehensive market trend analysis.
Data collection and base year analysis are done using data collection modules with large sample sizes. The stage includes obtaining market information or related data through various sources and strategies. It includes examining and planning all the data acquired from the past in advance. It likewise envelops the examination of information inconsistencies seen across different information sources. The market data is analysed and estimated using market statistical and coherent models. Also, market share analysis and key trend analysis are the major success factors in the market report. To know more, please request an analyst call or drop down your inquiry.
The key research methodology used by DBMR research team is data triangulation which involves data mining, analysis of the impact of data variables on the market and primary (industry expert) validation. Data models include Vendor Positioning Grid, Market Time Line Analysis, Market Overview and Guide, Company Positioning Grid, Patent Analysis, Pricing Analysis, Company Market Share Analysis, Standards of Measurement, Global versus Regional and Vendor Share Analysis. To know more about the research methodology, drop in an inquiry to speak to our industry experts.
Data Bridge Market Research is a leader in advanced formative research. We take pride in servicing our existing and new customers with data and analysis that match and suits their goal. The report can be customized to include price trend analysis of target brands understanding the market for additional countries (ask for the list of countries), clinical trial results data, literature review, refurbished market and product base analysis. Market analysis of target competitors can be analyzed from technology-based analysis to market portfolio strategies. We can add as many competitors that you require data about in the format and data style you are looking for. Our team of analysts can also provide you data in crude raw excel files pivot tables (Fact book) or can assist you in creating presentations from the data sets available in the report.


