
North America Residential Energy Management Market
Market Size in USD Billion
 USD
8.63 Billion
USD
84.06 Billion
2025
2033
USD
8.63 Billion
USD
84.06 Billion
2025
2033
| 2026 - 2033 | |
| USD 8.63 Billion | |
| USD 84.06 Billion | |
| % | |
|
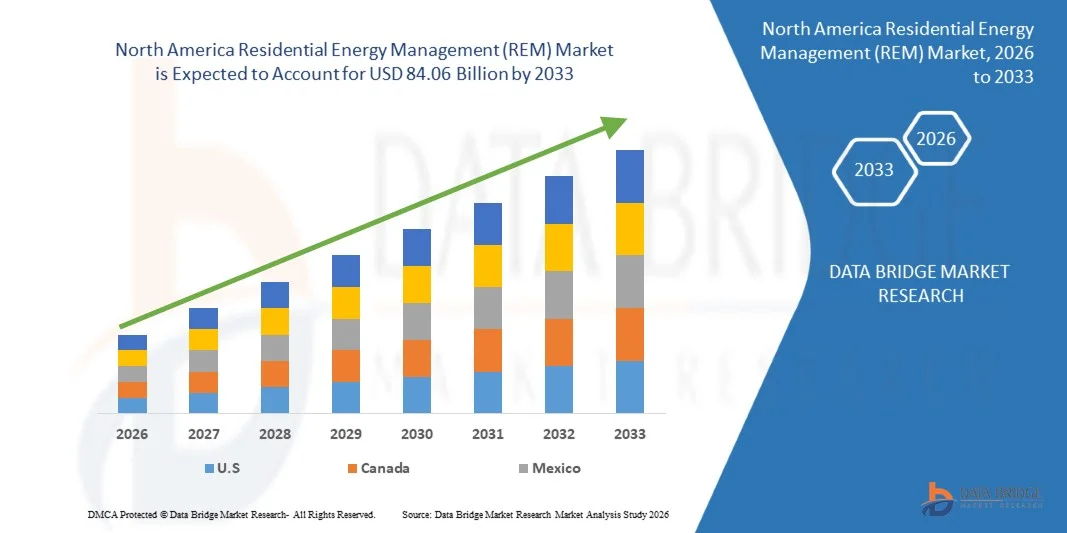
North America Residential Energy Management (REM) Market Size
- The North America Residential Energy Management (REM) Market size was valued at USD 8.63 billion in 2025 and is expected to reach USD 84.06 billion by 2033, at a CAGR of 32.9% during the forecast period
- The market growth is largely fueled by the increasing adoption of connected home devices and smart home technology, which enable greater digitalization and automation in residential energy management systems. Advancements in IoT, AI, and cloud-based platforms are enhancing the efficiency, monitoring, and control of household energy consumption, driving significant market expansion
- Furthermore, rising consumer demand for energy-efficient, sustainable, and user-friendly solutions is establishing Residential Energy Management (REM) systems as essential tools for modern households. These converging factors, including integration with renewable energy sources and smart appliances, are accelerating the adoption of residential energy management solutions, thereby significantly boosting industry growth
North America Residential Energy Management (REM) Market Analysis
- Residential energy management systems, offering real-time monitoring, optimization, and control of household energy consumption, are becoming increasingly vital for both independent homes and apartments. These systems provide homeowners with actionable insights, automated energy management, and the ability to integrate with smart appliances and renewable energy sources, enhancing overall efficiency and convenience
- The escalating demand for Residential Energy Management (REM) systems is primarily driven by the widespread adoption of smart home technologies, growing awareness of energy conservation and cost reduction, and the increasing need for sustainability. Consumers are increasingly seeking solutions that combine energy efficiency, convenience, and integration with broader smart home ecosystems, further fueling market growth
- U.S. dominated the North America Residential Energy Management (REM) Market in 2025, due to early adoption of smart home technologies, strong consumer demand for energy-efficient systems, and widespread integration of IoT-based home automation platforms
- Canada is expected to be the fastest growing country in the North America Residential Energy Management (REM) Market during the forecast period due to rising government-led sustainability programs, expanding smart meter rollouts, and growing consumer demand for energy-efficient home technologies
- Energy Management Platform (EMP) segment dominated the market with a market share of 45.5% in 2025, due to its ability to provide centralized control over household energy systems. EMPs enable users to monitor, optimize, and automate energy usage, offering actionable insights for efficiency improvements. Their integration with smart appliances and IoT-enabled devices supports advanced energy-saving strategies, attracting both residential and utility stakeholders. EMPs also facilitate remote monitoring, predictive maintenance, and cost reduction, reinforcing their market dominance
Report Scope and North America Residential Energy Management (REM) Market Segmentation
|
Attributes |
North America Residential Energy Management (REM) Key Market Insights |
|
Segments Covered |
|
|
Countries Covered |
North America
|
|
Key Market Players |
|
|
Market Opportunities |
|
|
Value Added Data Infosets |
In addition to the market insights such as market value, growth rate, market segments, geographical coverage, market players, and market scenario, the market report curated by the Data Bridge Market Research team includes in-depth expert analysis, import/export analysis, pricing analysis, production consumption analysis, and pestle analysis. |
North America Residential Energy Management (REM) Market Trends
“Rising Integration of AI-Based Home Energy Optimization”
- A significant trend in the residential energy management market is the rising integration of AI-driven home energy optimization systems that enhance real-time monitoring and intelligent control of household energy consumption. This shift is strengthening the role of Residential Energy Management (REM) platforms as essential components for improving energy efficiency and reducing electricity costs across modern homes.
- For instance, companies such as Schneider Electric and Honeywell offer AI-enabled home energy management solutions that analyze usage patterns and automatically adjust loads for improved efficiency. These systems help homeowners maintain optimal consumption levels while reducing dependence on manual control and supporting long-term energy savings
- AI-based Residential Energy Management (REM) solutions are gaining strong adoption across smart homes where automated demand response, predictive consumption analytics, and load balancing enable households to operate more efficiently. This development is positioning advanced Residential Energy Management (REM) platforms as key contributors to sustainable residential energy ecosystems
- The increasing use of connected appliances and IoT-enabled devices is accelerating the adoption of AI-powered management systems that streamline energy distribution and reduce wastage. This trend is supporting the transition toward intelligent and data-driven residential environments
- Renewable energy integration within homes is driving rapid utilization of advanced Residential Energy Management (REM) platforms that optimize the use of rooftop solar power, battery storage, and grid-supplied electricity. This capability strengthens energy independence and improves household sustainability
- The market continues to expand as consumer interest in smart home energy solutions grows, reinforcing the long-term shift toward automated monitoring, efficient load control, and intelligent consumption management across residential spaces
North America Residential Energy Management (REM) Market Dynamics
Driver
“Growing Demand for Efficient Smart Home Energy Solutions”
- The rising adoption of smart home technologies is driving demand for efficient residential energy management solutions that provide deeper control over energy usage and enable more efficient power distribution. These systems help households reduce unnecessary consumption and improve overall energy performance through real-time insights
- For instance, companies such as Siemens deliver advanced home energy systems that integrate with smart meters and connected appliances to optimize consumption. These solutions support dynamic energy adjustments and enable consistent performance improvements across residential settings
- The increasing electrification of homes is elevating the need for energy management systems that can handle diverse loads ranging from HVAC systems to EV chargers. This demand strengthens the role of Residential Energy Management (REM) platforms in maintaining balanced consumption
- Government initiatives promoting energy efficiency and smart home adoption are further boosting interest in advanced residential energy solutions. These programs encourage homeowners to adopt technologies that improve energy conservation
- The rapid growth of connected home ecosystems is supporting the expansion of Residential Energy Management (REM) solutions as consumers seek centralized platforms for monitoring and controlling energy use. This driver continues to shape long-term adoption patterns across markets
Restraint/Challenge
“High Setup Costs and Integration Complexity”
- The residential energy management market faces challenges due to high setup costs and integration complexity associated with installing advanced monitoring systems, smart meters, and connected appliances. These financial and technical barriers affect adoption, especially in cost-sensitive households
- For instance, companies such as Tesla offer home energy systems that require sophisticated hardware integration and substantial installation efforts. These processes involve specialized labor and high initial investment, increasing overall adoption barriers
- Integrating Residential Energy Management (REM) systems with existing home infrastructure often requires compatibility checks, system upgrades, and tailored configurations that extend project timelines. This complexity limits ease of deployment for many consumers
- The need for skilled installation personnel and advanced networking setups creates additional constraints for widespread adoption. These requirements contribute to higher operational overheads for service providers
- The challenge persists as consumers evaluate long-term benefits against upfront investments, shaping adoption rates across varied residential segments
North America Residential Energy Management (REM) Market Scope
The market is segmented on the basis of user interface application, platform, component, communication technology, and end-user.
• By User Interface Application
On the basis of user interface application, the North America Residential Energy Management (REM) Market is segmented into Smart Meter, Smart Thermostats, In-House Displays (IHD), and Smart Appliances. The Smart Meter segment dominated the market with the largest revenue share in 2025, driven by its central role in real-time energy monitoring and accurate billing. Smart meters enable homeowners to track consumption patterns and make informed decisions to reduce energy costs. Their integration with utility programs and demand response initiatives further strengthens adoption, as they provide seamless communication between households and energy providers. Smart meters are also increasingly compatible with advanced Residential Energy Management (REM) platforms, enhancing overall system efficiency and customer engagement.
The Smart Thermostats segment is anticipated to witness the fastest growth rate from 2026 to 2033, fueled by rising consumer interest in personalized comfort and energy savings. For instance, companies such as Nest offer learning thermostats that adjust automatically to occupancy and user preferences, resulting in significant reductions in energy consumption. Smart thermostats’ connectivity with mobile apps and voice assistants enhances convenience and control, making them increasingly popular in both independent homes and apartments. Their combination of energy efficiency, cost savings, and comfort drives rapid market adoption.
• By Platform
On the basis of platform, the North America Residential Energy Management (REM) Market is segmented into Energy Management Platform (EMP), Energy Analytics, and Customer Engagement Platform (CEP). The Energy Management Platform segment held the largest revenue share of 45.5% in 2025 due to its ability to provide centralized control over household energy systems. EMPs enable users to monitor, optimize, and automate energy usage, offering actionable insights for efficiency improvements. Their integration with smart appliances and IoT-enabled devices supports advanced energy-saving strategies, attracting both residential and utility stakeholders. EMPs also facilitate remote monitoring, predictive maintenance, and cost reduction, reinforcing their market dominance.
The Energy Analytics segment is expected to witness the fastest CAGR from 2026 to 2033, driven by growing demand for data-driven energy optimization. For instance, companies such as Schneider Electric offer analytics tools that provide deep insights into consumption patterns, peak load management, and predictive energy planning. Advanced analytics help homeowners and energy providers identify inefficiencies and implement targeted interventions, boosting energy savings and sustainability. The increasing adoption of cloud-based analytics solutions further accelerates market growth.
• By Component
On the basis of component, the North America Residential Energy Management (REM) Market is segmented into Hardware and Software. The Hardware segment dominated the market with the largest revenue share in 2025, as devices such as smart meters, thermostats, and sensors form the backbone of residential energy management systems. Hardware components are essential for real-time monitoring, load control, and automated energy management, ensuring efficient system operation. Their integration with multiple platforms and applications enhances functionality, making them indispensable for modern homes. Hardware reliability and performance also influence customer trust and adoption, strengthening the segment’s position.
The Software segment is anticipated to witness the fastest growth rate from 2026 to 2033, driven by the rising demand for intelligent, user-friendly applications for energy monitoring and control. For instance, companies such as Siemens provide software solutions that analyze energy usage, predict consumption trends, and facilitate automation of appliances. Software solutions enable seamless communication between hardware devices and platforms, enhancing user experience and operational efficiency. The scalability and adaptability of software make it an increasingly preferred choice for both independent homes and apartments.
• By Communication Technology
On the basis of communication technology, the North America Residential Energy Management (REM) Market is segmented into Zigbee, Z-Wave, Wi-Fi, Homeplug, Wireless M-Bus, and Thread. The Wi-Fi segment held the largest revenue share in 2025 due to the widespread availability of home Wi-Fi networks and their compatibility with multiple devices. Wi-Fi-enabled Residential Energy Management (REM) systems allow homeowners to remotely monitor and control energy consumption through mobile apps and cloud-based platforms. They also support integration with voice assistants and other smart home ecosystems, increasing convenience and adoption. The robust connectivity and high data transfer rates of Wi-Fi contribute to its continued dominance in the market.
The Zigbee segment is expected to witness the fastest CAGR from 2026 to 2033, driven by its low power consumption and secure, reliable mesh network connectivity. For instance, companies such as Honeywell utilize Zigbee-enabled devices to facilitate seamless communication between sensors, thermostats, and energy platforms. Zigbee allows for scalable networks that can support multiple devices without significant interference, enhancing system efficiency. Its popularity is rising in smart homes where energy efficiency and interoperability are critical priorities.
• By End-User
On the basis of end-user, the North America Residential Energy Management (REM) Market is segmented into Independent Homes and Apartments. The Independent Homes segment dominated the market with the largest revenue share in 2025, owing to higher adoption rates for advanced energy management systems in standalone residences. Homeowners of independent properties often invest in comprehensive solutions for energy monitoring, renewable integration, and cost savings. Independent homes offer flexibility for device installation and system customization, encouraging deployment of advanced Residential Energy Management (REM) technologies. In addition, these homes often participate in utility-driven demand response programs, enhancing the value proposition of energy management systems.
The Apartments segment is anticipated to witness the fastest growth rate from 2026 to 2033, fueled by increasing urbanization and the adoption of smart energy solutions in multi-dwelling units. For instance, developers such as Brookfield Residential are incorporating smart energy systems in new apartment complexes to improve sustainability and reduce operational costs. Apartments benefit from compact, integrated solutions that can be centrally managed, enhancing convenience for residents. Rising awareness of energy efficiency and government incentives also support rapid adoption in apartment settings.
North America Residential Energy Management (REM) Market Regional Analysis
- U.S. dominated the North America Residential Energy Management (REM) Market with the largest revenue share in 2025, driven by early adoption of smart home technologies, strong consumer demand for energy-efficient systems, and widespread integration of IoT-based home automation platforms
- Federal and state-level incentives supporting solar installations, smart meters, and residential energy storage reinforce the country’s leading position in the region. The presence of major Residential Energy Management (REM) solution providers, continuous upgrades in AI-driven home energy optimization, and expanding deployment of connected appliances strengthen market growth across suburban and urban households
- Increasing adoption of real-time energy monitoring, rising EV charging integration at home, and growing consumer interest in reducing utility costs ensure that the U.S. maintains its dominant regional role throughout the forecast period
Canada North America Residential Energy Management (REM) Market Insight
Canada is projected to register the fastest CAGR in the North America Residential Energy Management (REM) Market from 2026 to 2033, supported by rising government-led sustainability programs, expanding smart meter rollouts, and growing consumer demand for energy-efficient home technologies. Canadian households are increasingly adopting cloud-based Residential Energy Management (REM) platforms to optimize electricity consumption and improve home comfort amid fluctuating energy prices. The rise of residential solar-plus-storage systems, combined with partnerships between Canadian utilities and global smart home technology providers, is accelerating nationwide adoption. Strong emphasis on environmental conservation, digitization of residential infrastructure, and expanding availability of advanced IoT solutions position Canada as the fastest-growing market in the region.
Mexico North America Residential Energy Management (REM) Market Insight
Mexico is expected to grow steadily from 2026 to 2033, driven by expanding urbanization, rising awareness of energy savings, and increasing interest in basic-to-advanced smart home energy devices. Government initiatives promoting electricity efficiency, along with broader adoption of smart meters and home automation tools, are supporting consistent market expansion. The presence of regional energy solution providers, growing deployments of solar home systems, and rising affordability of connected appliances are strengthening market accessibility. Mexico’s gradual transition toward digital residential infrastructure, increasing focus on utility cost reduction, and wider penetration of IoT ecosystems are contributing to stable growth across the forecast period.
North America Residential Energy Management (REM) Market Share
The Residential Energy Management (REM) industry is primarily led by well-established companies, including:
- ABB (Switzerland)
- Eaton (Ireland)
- Schneider Electric (France)
- Honeywell International (U.S.)
- Siemens (Germany)
- General Electric (U.S.)
- Engie (France)
- E.On (Germany)
- Bosch (Germany)
- Landis+Gyr (Switzerland)
- Itron (U.S.)
- Emerson (U.S.)
- Trane Technologies (Ireland)
- Tantalus system Corp, (U.S.)
- Provident Energy Management Inc. (Canada)
- Sunverge Energy Inc. (U.S.)
- Koben System Inc. (Canada)
- NeoSilica (India)
- Lockheed Martin Corporation (U.S.)
- Uplight (U.S.)
- Span.IO (U.S.)
- Lumin (U.S.)
- RacePoint Energy (U.S.)
- Appartme (Poland)
- Wattics Ltd (U.K.)
Latest Developments in North America Residential Energy Management (REM) Market
- In September 2025, Honeywell (U.S.) launched a new suite of smart home products designed to optimize energy consumption through advanced AI algorithms. This innovation is expected to significantly enhance Honeywell’s market position by providing homeowners with personalized energy-saving recommendations, thereby increasing user engagement and retention. By integrating AI-driven insights into residential energy management systems, Honeywell strengthens its competitive edge and aligns its offerings with growing demand for intelligent, automated energy solutions in the global market
- In August 2025, Schneider Electric (FR) announced a strategic partnership with a leading renewable energy provider to integrate solar energy solutions into its residential energy management systems. This collaboration is likely to boost Schneider’s market presence by enabling homeowners to manage solar energy generation alongside traditional consumption, fostering energy efficiency and sustainability. By expanding its product portfolio to include renewable energy integration, Schneider positions itself as a front-runner in the transition towards low-carbon smart homes, capturing the increasing consumer preference for eco-friendly solutions
- In July 2025, Siemens (DE) expanded its operations in the North American market through the acquisition of a local smart home technology firm. This move is projected to strengthen Siemens’ market footprint by combining local expertise with advanced technologies to deliver customized residential energy management solutions. The acquisition enhances Siemens’ ability to meet the rising demand for smart energy solutions, improve customer loyalty, and accelerate its growth trajectory in a competitive market landscape
- In May 2025, LG Electronics (KR) introduced a new range of connected home appliances integrated with its residential energy management platform. This development is anticipated to enhance LG’s market share by enabling seamless monitoring and control of energy consumption across multiple devices. By providing homeowners with comprehensive insights into appliance-level energy usage, LG strengthens the appeal of its Residential Energy Management (REM) ecosystem, supports energy efficiency initiatives, and reinforces its leadership in the growing smart home segment
- In July 2020, China extended the expiration date of its NEV subsidy program from 2020 to the end of 2022 while gradually reducing base subsidy levels by 10%, 20%, and 30% per year. It also prolonged the exemption from purchase taxes for NEVs until the end of 2023. These policy extensions are expected to stimulate the adoption of energy-efficient vehicles and promote integration with residential energy management systems, indirectly driving demand for smart energy solutions in households aiming to optimize electricity usage from renewable sources and EV charging infrastructure
SKU-

- Interactive Data Analysis Dashboard
- Company Analysis Dashboard for high growth potential opportunities
- Research Analyst Access for customization & queries
- Competitor Analysis with Interactive dashboard
- Latest News, Updates & Trend analysis
- Harness the Power of Benchmark Analysis for Comprehensive Competitor Tracking
Data collection and base year analysis are done using data collection modules with large sample sizes. The stage includes obtaining market information or related data through various sources and strategies. It includes examining and planning all the data acquired from the past in advance. It likewise envelops the examination of information inconsistencies seen across different information sources. The market data is analysed and estimated using market statistical and coherent models. Also, market share analysis and key trend analysis are the major success factors in the market report. To know more, please request an analyst call or drop down your inquiry.
The key research methodology used by DBMR research team is data triangulation which involves data mining, analysis of the impact of data variables on the market and primary (industry expert) validation. Data models include Vendor Positioning Grid, Market Time Line Analysis, Market Overview and Guide, Company Positioning Grid, Patent Analysis, Pricing Analysis, Company Market Share Analysis, Standards of Measurement, Global versus Regional and Vendor Share Analysis. To know more about the research methodology, drop in an inquiry to speak to our industry experts.
Data Bridge Market Research is a leader in advanced formative research. We take pride in servicing our existing and new customers with data and analysis that match and suits their goal. The report can be customized to include price trend analysis of target brands understanding the market for additional countries (ask for the list of countries), clinical trial results data, literature review, refurbished market and product base analysis. Market analysis of target competitors can be analyzed from technology-based analysis to market portfolio strategies. We can add as many competitors that you require data about in the format and data style you are looking for. Our team of analysts can also provide you data in crude raw excel files pivot tables (Fact book) or can assist you in creating presentations from the data sets available in the report.


