
North America Rugged Industrial Display Market
Market Size in USD Billion
 USD
1.67 Billion
USD
2.94 Billion
2025
2033
USD
1.67 Billion
USD
2.94 Billion
2025
2033
| 2026 - 2033 | |
| USD 1.67 Billion | |
| USD 2.94 Billion | |
| % | |
|
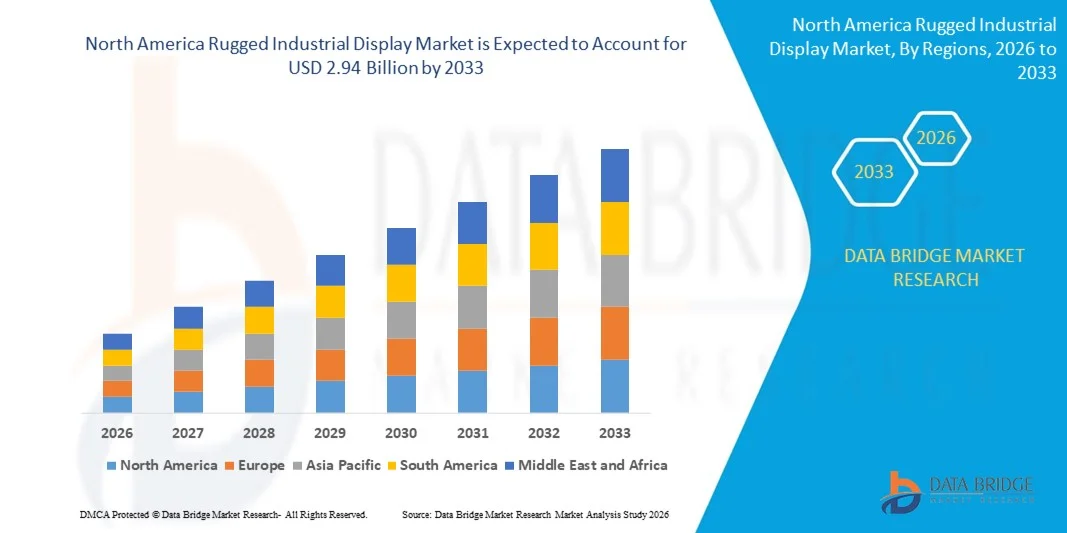
North America Rugged Industrial Display Market Size
- The North America rugged industrial display market size was valued at USD 1.67 billion in 2025 and is expected to reach USD 2.94 billion by 2033, at a CAGR of 7.3% during the forecast period
- The market growth is largely fueled by the rising adoption of industrial automation, advanced manufacturing systems, and harsh-environment monitoring solutions, which require durable and high-performance display devices for reliable visualization and control in challenging conditions
- Furthermore, increasing demand for robust, sunlight-readable, and ergonomically designed displays across sectors such as transportation, energy, defense, and logistics is establishing rugged industrial displays as essential components for critical operations. These converging factors are accelerating the deployment of rugged display solutions, thereby significantly boosting the industry’s growth
North America Rugged Industrial Display Market Analysis
- Rugged industrial displays, offering durable, high-performance visualization for harsh and demanding environments, are increasingly vital components of industrial control, HMI systems, transportation interfaces, and field applications due to their enhanced reliability, clarity, and operational resilience
- The escalating demand for rugged displays is primarily fueled by the need for real-time monitoring in extreme conditions, growing industrial digitalization, and an increasing preference for reliable, long-lasting display solutions that can operate under vibration, temperature fluctuations, dust, and moisture
- U.S. dominated the rugged industrial display market in 2025, due to strong adoption of industrial automation, smart manufacturing initiatives, and rising investments in high-performance HMI and display solutions across manufacturing, energy, and transportation sectors
- Canada is expected to be the fastest growing country in the rugged industrial display market during the forecast period due to expanding industrial automation projects, adoption of smart manufacturing solutions, and growing demand for durable displays in harsh operational environments
- LCD segment dominated the market with a market share of 43% in 2025, due to its proven reliability, cost-effectiveness, and compatibility with harsh industrial environments. LCD displays are widely preferred for applications requiring consistent brightness and clarity under varying temperature and lighting conditions
Report Scope and Rugged Industrial Display Market Segmentation
|
Attributes |
Rugged Industrial Display Key Market Insights |
|
Segments Covered |
|
|
Countries Covered |
North America
|
|
Key Market Players |
|
|
Market Opportunities |
|
|
Value Added Data Infosets |
In addition to the insights on market scenarios such as market value, growth rate, segmentation, geographical coverage, and major players, the market reports curated by the Data Bridge Market Research also include in-depth expert analysis, geographically represented company-wise production and capacity, network layouts of distributors and partners, detailed and updated price trend analysis and deficit analysis of supply chain and demand. |
North America Rugged Industrial Display Market Trends
Increasing Adoption of Industrial Automation and Smart HMI Systems
- A significant trend in the rugged industrial display market is the rising adoption of automated industrial systems and smart human-machine interface (HMI) solutions, driven by the need for efficient process monitoring, real-time control, and reliable visualization in harsh environments. This trend is positioning rugged displays as essential interfaces that enhance operational productivity and reduce downtime across manufacturing, energy, and transportation sectors
- For instance, Advantech and Siemens provide industrial-grade touch panels and HMIs that integrate rugged displays for real-time monitoring in factory automation setups. Such deployments improve visibility into complex processes, enabling operators to make informed decisions and maintain system reliability under extreme conditions
- The demand for high-brightness and sunlight-readable displays is growing as industrial operators require visibility in outdoor or brightly lit environments. This trend is supporting the development of displays with enhanced contrast, anti-glare coatings, and wide viewing angles for consistent performance
- Industries such as oil and gas, mining, and heavy machinery are increasingly using rugged displays capable of withstanding shock, vibration, dust, and temperature extremes. This requirement is fostering innovation in display enclosures, sealing techniques, and durable materials to ensure longevity and consistent functionality
- Integration with IIoT platforms is accelerating as operators seek smart HMIs that can communicate with sensors, controllers, and enterprise software. Rugged displays are evolving to support connectivity protocols, remote monitoring, and predictive maintenance capabilities for smarter industrial operations
- The market is witnessing strong adoption of multi-touch and gesture-based interfaces in industrial HMIs that improve operator ergonomics and simplify complex task execution. This shift is reinforcing the overall move toward more intuitive, interactive, and resilient human-machine interfaces in industrial environments
North America Rugged Industrial Display Market Dynamics
Driver
Rising Demand for Durable, High-Performance Displays in Harsh Environments
- The growing need for displays that can operate reliably under extreme conditions such as high temperatures, dust, moisture, and mechanical shock is driving the rugged industrial display market. These displays enable uninterrupted industrial operations, reducing maintenance costs and minimizing downtime
- For instance, companies such as Rockwell Automation supply rugged HMIs and industrial monitors that maintain performance in manufacturing and process automation environments. These solutions enhance operational visibility, improve safety, and support critical decision-making in challenging conditions
- Industries are increasingly adopting sunlight-readable, high-brightness displays for outdoor and well-lit environments, enhancing operational accuracy and user comfort. This trend supports the deployment of rugged displays in sectors such as transportation terminals, outdoor monitoring stations, and energy production sites
- Integration with industrial automation and IIoT systems is creating demand for displays that support real-time data visualization, remote monitoring, and predictive maintenance. Rugged displays that offer connectivity with PLCs, SCADA, and other control systems are becoming central to efficient industrial workflows
- The emphasis on operator safety, efficiency, and ergonomics is boosting investment in touch-enabled, multi-functional displays that provide intuitive control and reduce human error. Rugged displays with advanced touch technology, customizable interfaces, and durable design meet the operational and safety requirements of modern industries
Restraint/Challenge
High Cost and Complexity of Rugged Display Integration
- The rugged industrial display market faces challenges due to the high cost of specialized components, durable materials, and advanced manufacturing processes required for industrial-grade reliability. These factors increase initial investment and create barriers for small and medium-sized industrial enterprises
- For instance, companies such as Avalue Technology invest in extensive testing, ruggedization, and integration support for their industrial displays to ensure compliance with stringent operational standards. These efforts contribute to higher product prices and complex deployment requirements
- Integrating rugged displays into existing industrial systems often involves compatibility testing, software customization, and interface adaptation, which can extend project timelines and increase complexity
- The need for compliance with industry-specific certifications, environmental standards, and safety regulations further adds to integration challenges. Manufacturers must balance performance, durability, and regulatory compliance without compromising usability
- The market continues to face constraints related to scaling deployment across diverse industrial applications while maintaining cost-effectiveness and reliability. Addressing these challenges requires advanced engineering, careful selection of materials, and optimized supply chain management to meet growing demand without compromising quality
North America Rugged Industrial Display Market Scope
The market is segmented on the basis of technology, display size, resolution, mounting, touch screen type, application, and vertical.
- By Technology
On the basis of technology, the rugged industrial display market is segmented into LCD, LED, OLED, and E-Paper displays. The LCD segment dominated the market with the largest revenue share of 43% in 2025, driven by its proven reliability, cost-effectiveness, and compatibility with harsh industrial environments. LCD displays are widely preferred for applications requiring consistent brightness and clarity under varying temperature and lighting conditions. The segment benefits from the availability of established suppliers and versatile integration options across industrial machinery, HMI panels, and automation equipment. LCD technology’s durability and ease of maintenance further reinforce its leading position.
The OLED segment is anticipated to witness the fastest growth from 2026 to 2033, fueled by increasing demand for high-contrast, energy-efficient displays in advanced industrial applications. For instance, companies such as Kontron AG are integrating OLED displays into next-generation control panels and monitoring systems due to their superior color rendering and thinner form factor. OLED displays also support flexible designs, making them suitable for compact and mobile industrial devices. Rising adoption in sectors requiring precise visualization, such as medical instrumentation and digital signage, is further driving growth.
- By Display Size
On the basis of display size, the market is segmented into 8”-11”, 11”-12”, 13”-18”, 19”-25”, and 40”-Above. The 13”-18” segment dominated in 2025 due to its optimal balance between screen readability and device footprint. Industrial operators favor this size for control panels and HMIs because it provides sufficient display area for detailed visualization without occupying excessive space on machinery. The segment is further supported by standardization in panel design, which reduces installation complexity and integration costs across industrial environments.
The 19”-25” segment is expected to witness the fastest growth from 2026 to 2033, driven by increasing demand in monitoring, digital signage, and advanced automation systems requiring larger displays. For instance, Advantech Co., Ltd. is offering rugged displays in this range for real-time monitoring in manufacturing plants and transportation control centers. Larger displays enhance operational efficiency by allowing simultaneous visualization of multiple data streams, which is critical in complex industrial processes.
- By Resolution
On the basis of resolution, the rugged industrial display market is segmented into 1920x1200, 1920x1080, 1280x1024, 1024x768, 800x600, and 1366x768. The 1920x1080 segment dominated the market in 2025, supported by its widespread adoption across industrial applications requiring high-definition visualization for process monitoring and machine control. Full HD resolution ensures clear rendering of graphs, schematics, and real-time data, enhancing operator accuracy and decision-making. Industrial integrators prefer this resolution due to its compatibility with existing software platforms and graphics standards.
The 1920x1200 segment is expected to register the fastest growth from 2026 to 2033, driven by rising demand for slightly taller display formats for multi-window applications in HMIs and medical devices. For instance, Beijer Electronics has integrated 1920x1200 panels in its advanced operator terminals to improve workflow efficiency. The higher vertical resolution allows for better visualization of complex schematics and dashboards in constrained spaces, appealing to high-performance industrial setups.
- By Mounting
On the basis of mounting, the market is segmented into panel-mounting, rack-mounting, wall-mounting, arm-mounting, open-frame, and others. The panel-mounting segment dominated the market in 2025 due to its ease of integration into machinery and control cabinets, providing secure installation and protection in rugged industrial environments. It is widely preferred in automation and manufacturing systems where space efficiency and accessibility are critical. The segment benefits from compatibility with standardized enclosures and robust industrial design specifications.
The arm-mounting segment is expected to witness the fastest growth from 2026 to 2033, fueled by increasing use in dynamic industrial workstations and flexible production environments. For instance, Siemens AG has deployed arm-mounted rugged displays for operator workstations to allow adjustable positioning and ergonomic access. Arm-mounted displays improve operational efficiency and reduce operator fatigue, particularly in sectors with frequent equipment monitoring and human-machine interaction.
- By Touch Screen Type
On the basis of touch screen type, the market is segmented into resistive, PCAP, IR touch, and capacitive. The PCAP (projected capacitive) segment dominated the market in 2025, driven by its multi-touch capability, durability, and high responsiveness suitable for industrial environments. PCAP displays are widely adopted in HMIs, kiosks, and automation systems requiring precise gesture-based control. The segment also benefits from increasing integration with ruggedized mobile terminals and monitoring devices, where reliability under continuous use is critical.
The IR touch segment is anticipated to witness the fastest growth from 2026 to 2033, driven by demand for non-contact interaction and high durability in harsh industrial conditions. For instance, Avalue Technology Inc. is offering IR touch displays for medical and manufacturing applications where glove operation and robust input recognition are required. IR touch screens provide long service life and resistance to scratches and contaminants, making them ideal for rugged industrial usage.
- By Application
On the basis of application, the rugged industrial display market is segmented into medical, HMI, industrial automation, KIOSK/POS, digital signage, imaging, and gaming/lottery. The HMI segment dominated the market in 2025 due to its critical role in controlling machinery and monitoring processes across manufacturing and energy sectors. HMIs demand high reliability, clear visualization, and integration flexibility, making them a major contributor to revenue. Adoption is further supported by industrial trends emphasizing automation and real-time monitoring.
The digital signage segment is expected to witness the fastest growth from 2026 to 2033, driven by the expansion of industrial and public-facing digital information systems. For instance, NEC Display Solutions is deploying rugged digital signage panels for factories and transportation hubs. These applications require durable displays with high visibility and consistent performance under continuous operation.
- By Vertical
On the basis of vertical, the market is segmented into oil & gas, manufacturing, chemical, energy & power, mining & metals, transportation, military & defence, and others. The manufacturing vertical dominated the market in 2025 due to the extensive adoption of industrial automation and process monitoring systems requiring reliable display solutions. Manufacturing operations benefit from rugged displays for real-time visualization of production lines, predictive maintenance, and HMI applications. The segment also sees continuous technology upgrades to meet operational efficiency and safety requirements.
The transportation vertical is expected to witness the fastest growth from 2026 to 2033, fueled by demand for real-time monitoring, vehicle control interfaces, and passenger information systems. For instance, Panasonic Corporation has introduced rugged displays for trains and buses to provide operational visibility and enhance passenger experience. Growth is further driven by smart transportation initiatives and the need for durable displays capable of operating in varying environmental conditions.
North America Rugged Industrial Display Market Regional Analysis
- U.S. dominated the rugged industrial display market with the largest revenue share in 2025, driven by strong adoption of industrial automation, smart manufacturing initiatives, and rising investments in high-performance HMI and display solutions across manufacturing, energy, and transportation sectors
- The demand for durable, high-brightness, and touchscreen-enabled rugged displays is supported by well-established industrial infrastructure, growing focus on predictive maintenance, and increasing integration of IIoT and digital control systems in production facilities
- The presence of major industrial automation and display technology providers, extensive manufacturing hubs, and ongoing modernization of industrial operations reinforce the U.S. leadership position in the North America rugged industrial display market
Canada Rugged Industrial Display Market Insight
Canada is projected to register the fastest CAGR in the North America rugged industrial display market from 2026 to 2033, supported by expanding industrial automation projects, adoption of smart manufacturing solutions, and growing demand for durable displays in harsh operational environments. Investments in energy, mining, and manufacturing facilities are driving demand for rugged HMIs and high-reliability industrial panels. Increasing deployment of digital monitoring systems, IoT-enabled displays, and predictive maintenance solutions is accelerating market growth, positioning Canada as the fastest-growing country in the region during the forecast period.
Mexico Rugged Industrial Display Market Insight
Mexico is expected to grow steadily from 2026 to 2033, driven by increasing industrial digitization, modernization of manufacturing facilities, and adoption of automated production systems. Growing deployment of rugged displays for real-time monitoring, process control, and operator interface in energy, automotive, and manufacturing sectors supports consistent demand. Infrastructure improvements, industrial expansion, and focus on operational efficiency contribute to sustained growth of the rugged industrial display market throughout the forecast period.
North America Rugged Industrial Display Market Share
The rugged industrial display industry is primarily led by well-established companies, including:
- Dell Inc. (U.S.)
- Curtiss-Wright Corp. (U.S.)
- Getac Technology Corp. (China)
- General Dynamics Corp. (U.S.)
- Zebra Technologies Corp. (U.S.)
- L3 Technologies Inc. (U.S.)
- Panasonic Corporation (Japan)
- Scio Teq (Belgium)
- Sparton Corp. (U.S.)
- Crystal Group Inc. (U.S.)
- Kyocera Corp. (Japan)
- Beijer Electronics Group AB (Sweden)
Latest Developments in North America Rugged Industrial Display Market
- In November 2025, Panasonic launched its latest rugged tablet series featuring enhanced display capabilities, improved battery life, and reinforced durability, addressing the growing need for high-performance devices in logistics, field operations, and harsh industrial environments. This launch strengthens Panasonic’s position in the rugged industrial display market by offering solutions that combine portability with ruggedization, enabling enterprises to deploy reliable visualization tools in challenging conditions. The enhanced performance and display quality are expected to drive adoption among industrial users seeking dependable devices for data-intensive applications, including asset tracking, remote monitoring, and on-site inspections
- In March 2025, rugged embedded computer brand Cincoze expanded its Display Computing – CRYSTAL product line by adding a new 15.6-inch FHD display option for HMI applications in harsh environments, along with nearly 20 new rugged industrial panel PCs and monitors. This expansion provides industrial operators with a broader range of rugged display solutions suitable for both indoor and high-brightness outdoor environments. The addition of sunlight-readable monitors and panel PCs addresses critical operational challenges, enhancing usability, flexibility, and performance in harsh settings, thereby reinforcing Cincoze’s competitive edge in the industrial HMI segment
- In September 2023, Helios Technologies launched its next-generation premium rugged display controller, the PowerView™ P70, designed to deliver higher processing capabilities, improved graphics performance, and enhanced reliability in industrial and mission-critical applications. The launch strengthens Helios’ presence in the rugged industrial display market by enabling advanced control and monitoring systems, supporting complex visualizations for automation, transportation, and defense sectors. The new controller is expected to drive adoption in industries requiring high-precision displays capable of withstanding challenging operational conditions
- In September 2023, Spartan Radar partnered with RiverPark Inc. to integrate its Hoplo safety solution, a ruggedized 79 GHz collision warning system with an intuitive and comprehensive display. This collaboration enhances situational awareness for drivers in transportation and industrial applications, providing reliable detection while eliminating nuisance alarms. By offering a rugged and display-driven safety solution, Spartan Radar and RiverPark strengthen market adoption of high-performance, visualization-based safety systems in industrial vehicles and fleet operations
- In april 2023, Beijer Electronics acquired a part of BEIJER GROUP to integrate Smart HMI, expanding its digitalization and visualization capabilities across key industrial segments. This acquisition reinforces Beijer Electronics’ strategy of offering platform-independent, web-based rugged display solutions, enabling customers to deploy flexible, scalable, and efficient HMI systems. The integration of Smart HMI supports enhanced control and monitoring workflows, driving adoption of rugged visualization solutions in manufacturing, energy, and automation industries
SKU-

- Interactive Data Analysis Dashboard
- Company Analysis Dashboard for high growth potential opportunities
- Research Analyst Access for customization & queries
- Competitor Analysis with Interactive dashboard
- Latest News, Updates & Trend analysis
- Harness the Power of Benchmark Analysis for Comprehensive Competitor Tracking
North America Rugged Industrial Display Market, Supply Chain Analysis and Ecosystem Framework
To support market growth and help clients navigate the impact of geopolitical shifts, DBMR has integrated in-depth supply chain analysis into its North America Rugged Industrial Display Market research reports. This addition empowers clients to respond effectively to global changes affecting their industries. The supply chain analysis section includes detailed insights such as North America Rugged Industrial Display Market consumption and production by country, price trend analysis, the impact of tariffs and geopolitical developments, and import and export trends by country and HSN code. It also highlights major suppliers with data on production capacity and company profiles, as well as key importers and exporters. In addition to research, DBMR offers specialized supply chain consulting services backed by over a decade of experience, providing solutions like supplier discovery, supplier risk assessment, price trend analysis, impact evaluation of inflation and trade route changes, and comprehensive market trend analysis.
Data collection and base year analysis are done using data collection modules with large sample sizes. The stage includes obtaining market information or related data through various sources and strategies. It includes examining and planning all the data acquired from the past in advance. It likewise envelops the examination of information inconsistencies seen across different information sources. The market data is analysed and estimated using market statistical and coherent models. Also, market share analysis and key trend analysis are the major success factors in the market report. To know more, please request an analyst call or drop down your inquiry.
The key research methodology used by DBMR research team is data triangulation which involves data mining, analysis of the impact of data variables on the market and primary (industry expert) validation. Data models include Vendor Positioning Grid, Market Time Line Analysis, Market Overview and Guide, Company Positioning Grid, Patent Analysis, Pricing Analysis, Company Market Share Analysis, Standards of Measurement, Global versus Regional and Vendor Share Analysis. To know more about the research methodology, drop in an inquiry to speak to our industry experts.
Data Bridge Market Research is a leader in advanced formative research. We take pride in servicing our existing and new customers with data and analysis that match and suits their goal. The report can be customized to include price trend analysis of target brands understanding the market for additional countries (ask for the list of countries), clinical trial results data, literature review, refurbished market and product base analysis. Market analysis of target competitors can be analyzed from technology-based analysis to market portfolio strategies. We can add as many competitors that you require data about in the format and data style you are looking for. Our team of analysts can also provide you data in crude raw excel files pivot tables (Fact book) or can assist you in creating presentations from the data sets available in the report.


