
North America Sauces Dressings And Condiments Market
Market Size in USD Million
 USD
51.11 Million
USD
78.04 Million
2025
2033
USD
51.11 Million
USD
78.04 Million
2025
2033
| 2026 - 2033 | |
| USD 51.11 Million | |
| USD 78.04 Million | |
| % | |
|
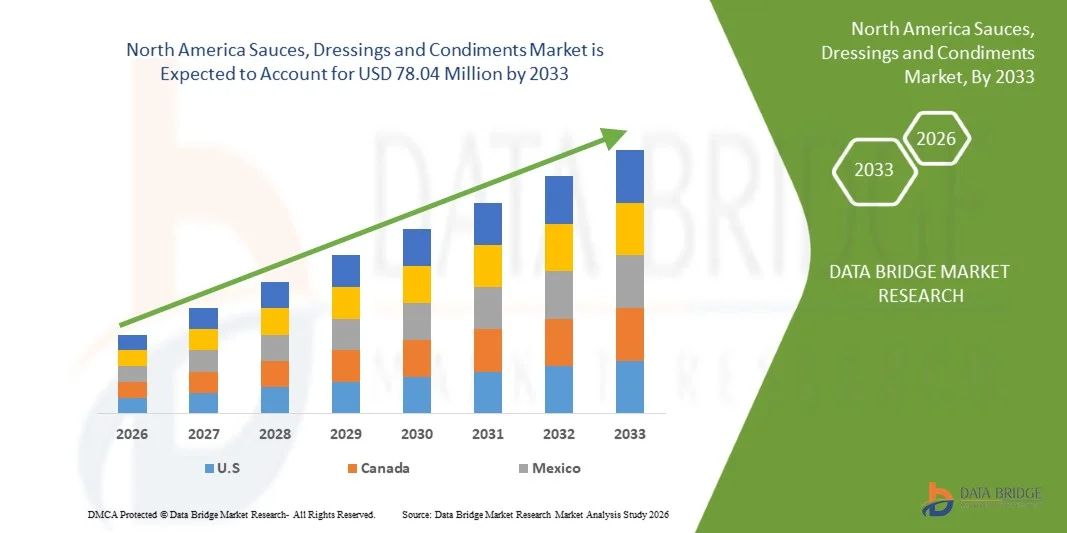
North America Sauces, Dressings and Condiments Market Size
- The North America Sauces, dressings and condiments Market is expected to reach USD 78.04 million by 2033 from USD 51.11 million in 2025, growing with a CAGR of 5.5% in the forecast period of 2026 to 2033.
- The growth of the e-commerce sector significantly boosts demand for sauces, dressings, and condiments by expanding product accessibility and purchase convenience.
- The expanding trend of homemade culinary practices significantly boosts demand for sauces, dressings, and condiments as more consumers actively prepare meals at home and experiment with diverse cuisines.
North America Sauces, Dressings and Condiments Market Analysis
- The North America sauces, dressings and condiments market has evolved significantly over the past decades, driven by changing food consumption patterns and expanding applications across households and foodservice industries. Initially, production was limited and largely focused on traditional, locally prepared sauces and condiments.
- The growth of the e-commerce sector significantly boosts demand for sauces, dressings, and condiments by expanding product accessibility and purchase convenience.
- The market is further supported by urbanization, expanding restaurant chains, premiumization of food products, and innovation in clean-label, low-sugar, and plant-based formulations. Increasing e-commerce penetration and attractive packaging formats also contribute to sustained market expansion.
- The U.S. is projected to dominate the North America sauces, dressings and condiments market, and it is the fastest growing region which is anticipated to grow at a CAGR of around 5.6% from 2026 to 2033 and, capturing 81.32% market share in 2026, due to its large population, strong culinary traditions, and high consumption of soy sauce, chili sauces, and regional condiments. Rapid urbanization, rising disposable incomes, expanding foodservice chains, and increasing adoption of packaged and ready-to-cook foods further drive volume growth and market leadership across the region.
- Sauces are expected to dominate the market, holding the largest share of 50.18 in 2025, due to its extensive use in cooking, marinades, ready meals, and foodservice applications, supported by high consumption frequency and broad culinary versatility across global cuisines.
Report Scope and North America Sauces, Dressings and Condiments Market Segmentation
|
Attributes |
North America Sauces, Dressings and Condiments Market Insights |
|
Segments Covered |
|
|
Countries Covered |
|
|
Key Market Players |
|
|
Market Opportunities |
|
|
Value Added Data Infosets |
In addition to the insights on market scenarios such as market value, growth rate, segmentation, geographical coverage, and major players, the market reports curated by the Data Bridge Market Research also include in-depth expert analysis, pricing analysis, brand share analysis, consumer survey, demography analysis, supply chain analysis, value chain analysis, raw material/consumables overview, vendor selection criteria, PESTLE Analysis, Porter Analysis, and regulatory framework. |
North America Sauces, Dressings and Condiments Market Trends
“High Internet Penetration and Digital Food Ecosystem Expansion”
- High and near-saturated internet penetration across North America is significantly influencing the sauces, dressings, and condiments market by reshaping consumer engagement, product discovery, and purchasing behavior. Widespread access to high-speed broadband, 5G networks, and smartphones in the U.S. and Canada has accelerated the role of digital platforms in everyday food decisions. Consumers are increasingly exposed to new flavor profiles, international cuisines, and innovative sauce formats through social media, recipe platforms, food streaming content, and influencer-driven cooking trends. This constant digital exposure encourages experimentation with ethnic sauces, gourmet dressings, plant-based condiments, and regionally inspired flavors, supporting sustained demand across both mass-market and premium product segments.
- Strong internet connectivity in North America also underpins the rapid growth of online grocery, quick-commerce, and direct-to-consumer (DTC) food sales channels. Major retailers, brand-owned platforms, and food delivery apps offer wide assortments of sauces and condiments, including limited-edition, imported, and specialty variants. Subscription-based meal kits and digital recipe integrations further stimulate regular usage of sauces and dressings by embedding them into weekly meal planning, convenience cooking, and at-home dining routines. This omnichannel accessibility increases product visibility, trial rates, and repeat purchases across urban and suburban households.
Advanced digital marketing capabilities in North America enable brands to deploy highly targeted, data-driven campaigns focused on product functionality, clean-label credentials, and lifestyle alignment. Manufacturers actively collaborate with food influencers, chefs, and nutrition-focused content creators to promote reduced-sugar, low-sodium, organic, vegan, and functional sauces and condiments. Short-form videos, interactive recipes, and personalized recommendations enhance usage awareness and versatility, which is critical for driving higher consumption frequency and brand loyalty in a mature but innovation-driven market.
North America Sauces, Dressings and Condiments Market Dynamics
Driver
“Growth Of E-Commerce Sector”
- The growth of the e-commerce sector significantly boosts demand for sauces, dressings, and condiments by expanding product accessibility and purchase convenience. Online platforms allow consumers to explore a wide range of products, including regional flavors, international cuisines, organic variants, and premium or niche sauces that may not be available in nearby retail stores. Easy price comparison, bundled offers, subscription models, and doorstep delivery encourage impulse buying and bulk purchasing, which directly increases consumption frequency and overall sales volume of sauces, dressings, and condiments.
- E-commerce also supports demand growth by enabling direct-to-consumer (D2C) models and data-driven marketing strategies. Brands leverage consumer browsing and purchase data to launch targeted promotions, personalized recommendations, and limited-edition flavors, which stimulates trial and repeat purchases. Additionally, online reviews and ratings build trust and influence buying decisions, especially for new or innovative condiment products. As busy urban consumers increasingly prefer online grocery shopping, e-commerce platforms become a critical sales channel that accelerates market penetration and sustains long-term demand growth for sauces, dressings, and condiments.
For Instances
- In February 2025, the Census Bureau of the Department of Commerce estimated that U.S. retail e-commerce sales for the fourth quarter of 2024 were USD 08.9 billion, an increase of 2.7 percent from the third quarter of 2024.
- In December 2025, the Census Bureau of the Department of Commerce estimated that U.S. retail e-commerce sales for the third quarter of 2025 were USD 310.3 billion, an increase of 1.9 percent from the second quarter of 2025.
- According to the International Trade Administration, global B2C ecommerce revenue is expected to grow to USD 5.5 trillion by 2027 at a steady 14.4% compound annual growth rate.
- In February 2025, according to Eurostat, online shopping in the EU continues to expand, with 77% of internet users in 2024 buying or ordering goods or services for personal use online in the previous 12 months, increasing from 59% in 2014.
- In November 2023, according to the International Trade Administration, in 2022, UK online sales saw their highest annual growth since 2007, with sales increasing by 36%.
In conclusion, the rapid expansion of the e-commerce sector plays a decisive role in strengthening demand for sauces, dressings, and condiments by reshaping how consumers discover, evaluate, and purchase these products. The combination of wider product availability, convenience-driven purchasing, and data-enabled marketing continues to increase consumption frequency and encourage experimentation with premium, ethnic, and innovative variants. Strong growth indicators across major markets such as the U.S., EU, and UK, along with the robust global B2C e-commerce outlook, underline the scale and sustainability of this trend
Restraint/Challenge
“Volatility In Raw Material Prices”
- Volatility in raw material prices significantly hampers demand for sauces, dressings, and condiments by increasing production costs and creating pricing instability across the value chain. Key inputs such as tomatoes, chili peppers, soybeans, mustard seeds, edible oils, sugar, vinegar, and spices are highly susceptible to fluctuations caused by weather conditions, crop yields, geopolitical tensions, transportation costs, and currency movements. When the prices of these agricultural commodities rise sharply or remain unpredictable, manufacturers face higher input costs that are difficult to absorb, especially in a price-sensitive food category. As a result, companies are often forced to increase product prices to protect margins, which directly affects consumer purchasing behavior.
- Raw material price volatility also disrupts production planning and supply chain efficiency, further constraining market growth. Manufacturers struggle to forecast costs accurately, making it difficult to set long-term contracts, maintain stable pricing, or invest confidently in product development and capacity expansion. Smaller and mid-sized producers, in particular, are more vulnerable as they lack the financial flexibility and hedging capabilities of larger players. This uncertainty may lead to inconsistent product availability or quality adjustments, weakening brand trust and reducing repeat purchases.
For Instances,
- In August 2023, according to the National Bank for Agriculture and Rural Development (NABARD). Indian tomato prices tripled in the month of July 2023 from around ₹30 04 or USD 0.36 per kg in the month of June 2023 to ₹109 or USD 1.31 per kg in the retail market by the end of July 2023.
- In November 2025, The Economic Times reported that tomato prices had increased by nearly 50% during the last 10-15 days in India as supplies had reduced due to the impact of excess rainfall in October.
- In July 2025, The Economic Times reported that American consumers may soon face higher tomato prices due to new 20.9% tariffs on Mexican imports, potentially replacing a long-standing trade agreement.
- In June 2025, The Business Standard reported that the landed price of major edible oils has risen by 3-5 per cent during the week ended June 20 as compared to the previous week that ended on June 13.
In conclusion, volatility in raw material prices acts as a significant restraint on the sauces, dressings, and condiments market by exerting continuous pressure on production costs, pricing stability, and supply chain reliability. Sharp and frequent fluctuations in key agricultural inputs force manufacturers to pass on cost increases to consumers, which dampens demand in a price-sensitive category. At the same time, cost unpredictability disrupts production planning, weakens investment confidence, and disproportionately impacts small and mid-sized players with limited risk-management capabilities. Persistent raw material instability ultimately undermines product affordability, brand consistency, and consumer loyalty, constraining overall market growth for sauces, dressings, and condiments.
North America Sauces, Dressings and Condiments Market Scope
The North America sauces, dressings and condiments market is categorized into seven notable segments which are based on type, ingredients, packaging type, packaging material, packaging size, end-use, distribution channel.
By Type
On the basis of type, North America sauces, dressings and condiments market is segmented into sauces, condiments and dressings.
In 2026, the sauces segment is expected to dominate with 50.36% market share, growing with the highest CAGR of 5.9% in the forecast period of 2026 to 2033. The sauces segment is driven by rising global consumption of convenience foods, expanding quick-service restaurant chains, and growing preference for ready-to-use flavor solutions. Increasing urbanization, busy lifestyles, and experimentation with international cuisines are boosting demand for cooking sauces, table sauces, and specialty variants across both developed and emerging markets.
By Ingredients
On the basis of ingredients, the North America sauces, dressings and condiments market is segmented into vegetable, fruits, spices, food additives, herbs and others.
In 2026, the vegetable segment is expected to dominate with 24.39% market share, growing with the CAGR of 5.3% in the forecast period of 2026 to 2033. Vegetable-based sauces are gaining traction due to increasing health consciousness, clean-label preferences, and demand for plant-forward diets. Consumers favor products made from tomatoes, peppers, onions, and herbs due to their natural taste, nutritional value, and perceived freshness, supporting strong adoption in household cooking and foodservice applications.
The Herbs segment is anticipated to witness the fastest CAGR of 6.4% from 2026 to 2033, driven by shifting consumer preferences toward flavorful, convenient, and ready-to-use food products. The growing demand for international cuisines, clean-label ingredients, and premium artisanal offerings is significantly boosting market expansion. Product innovations include organic sauces, low-fat and sugar-free dressings, plant-based condiments, and functional formulations with added health benefits. Additionally, the rising popularity of home cooking, quick-service restaurants, and online grocery platforms is further accelerating segment growth.
By Packaging Type
On the basis of packaging type, the North America sauces, dressings and condiments market is segmented into bottles, pouch, sachets, containers, cans, boxes, cups, bag in box, packs and others.
In 2026, the bottles segment is expected to dominate with 28.00% market share, growing with the highest CAGR of 6.1%in the forecast period of 2026 to 2033. Bottle packaging dominates due to its convenience, resealability, controlled dispensing, and suitability for both retail shelves and foodservice use. Bottles provide strong product visibility, branding space, and protection against contamination. Their compatibility with automated filling lines and multiple material options supports large-scale production and wide market penetration.
The Pouch segment is anticipated to witness the fastest CAGR of 6.3% from 2026 to 2033, driven by increasing consumer demand for convenient, portable, and single-use packaging formats. Pouches offer advantages such as lightweight design, resealability, extended shelf life, and reduced material usage, making them a cost-effective and sustainable packaging solution. The rising preference for on-the-go consumption, takeaway culture, and home delivery services further supports segment growth. Additionally, manufacturers are introducing innovative spouted and stand-up pouches with enhanced barrier properties, contributing to greater product freshness and brand appeal.
By Packaging Material
On the basis of packaging material, the North America sauces, dressings and condiments market is segmented into plastic, glass, paper and paperboard, metal and others.
In 2026, the plastic segment is expected to dominate with 45.24% market share, growing with the CAGR of 5.6% in the forecast period of 2026 to 2033. Plastic packaging is driven by its lightweight nature, cost efficiency, durability, and ease of transportation. Compared to glass, plastic reduces breakage losses and logistics costs, making it ideal for mass-market sauces. Advancements in recyclable and food-grade plastics further support adoption amid sustainability-driven packaging innovations.
The Paper and Paperboard segment is anticipated to witness the fastest CAGR of 6.3% from 2026 to 2033, driven by the growing emphasis on sustainable and eco-friendly packaging solutions. Increasing consumer awareness regarding plastic waste and stringent environmental regulations are encouraging manufacturers to adopt recyclable and biodegradable paper-based packaging formats. Paper and paperboard materials offer benefits such as lightweight structure, cost-effectiveness, and strong branding appeal through high-quality printing. Additionally, the rising demand for sustainable packaging from retail chains and foodservice providers is further accelerating segment growth across the sauces, dressings, and condiments category.
By Packaging Size
On the basis of packaging size, the North America sauces, dressings and condiments market is segmented into 250 ml – 500 ml, 50 ml – 250 ml, 500 ml – 1l, 1l – 5l, less than 50 ml and more than 5l.
In 2026, the 250 ml – 500 ml segment is expected to dominate with 31.46% market share, growing with the CAGR of 5.4% in the forecast period of 2026 to 2033. The 250–500 ml pack size is driven by its balance between affordability, convenience, and household consumption needs. This size suits regular usage without frequent repurchasing, making it popular among urban families. It also aligns well with retail pricing strategies and shelf optimization across supermarkets and neighborhood stores.
The Less than 50 ML segment is anticipated to witness the fastest CAGR of 6.4% from 2026 to 2033, driven by the rising demand for single-serve and portion-controlled packaging formats. These small-sized packs are increasingly popular in quick-service restaurants, takeaway orders, airline catering, and institutional foodservice due to their convenience and hygiene benefits. Growing on-the-go consumption trends and the expansion of home delivery platforms are further supporting demand. Additionally, trial-size packaging for premium and specialty sauces is encouraging product sampling and brand penetration, thereby accelerating segment growth.
By End-User
On the basis of end-user, the North America sauces, dressings and condiments market is segmented into 2 retail food, food services, food processors and others.
In 2026, the retail food segment is expected to dominate with 58.45% market share, growing with the CAGR of 5.6% in the forecast period of 2026 to 2033. Retail food consumption drives the market due to increasing home cooking, growth of modern retail formats, and wider product availability. Consumers prefer retail sauces for daily meal preparation, flavor customization, and cost savings compared to dining out. Promotional pricing and private-label expansion further support retail segment growth.
The Food Services segment is anticipated to witness the fastest CAGR of 5.7% from 2026 to 2033, driven by the rapid expansion of quick-service restaurants, cafés, cloud kitchens, and catering services. The growing demand for diverse flavor offerings, customized meal options, and premium condiments in the foodservice industry is significantly contributing to segment growth. Increasing consumer preference for dining out, takeaway, and online food delivery platforms further accelerates demand for bulk and portion-controlled sauce formats. Additionally, collaborations between condiment manufacturers and foodservice chains for exclusive flavors and menu innovations are supporting sustained market expansion.
By Distribution Channel
On the basis of distribution channel, the North America sauces, dressings and condiments market is segmented into offline-trade and online trade.
In 2026, the offline-trade segment is expected to dominate with 77.44% market share, growing with the CAGR of 5.4% in the forecast period of 2026 to 2033. Offline trade remains strong due to consumer preference for physical inspection, immediate availability, and brand familiarity. Supermarkets, hypermarkets, and convenience stores offer extensive product assortments, in-store promotions, and impulse purchase opportunities. In emerging economies, traditional retail networks continue to dominate sauce and condiment sales volumes.
The Online Trade segment is anticipated to witness the fastest CAGR of 5.8% from 2026 to 2033, driven by the rapid growth of e-commerce platforms and digital grocery channels. Increasing consumer preference for convenient doorstep delivery, wider product assortments, and access to premium and international brands is significantly supporting segment expansion. Online platforms enable easy price comparison, subscription-based purchases, and promotional discounts, further encouraging repeat buying. Additionally, the rising influence of digital marketing, social media promotions, and direct-to-consumer brand strategies is accelerating online sales of sauces, dressings, and condiments globally.
North America Sauces, Dressings and Condiments Market Regional Analysis
- The U.S. represents the largest and most influential market for sauces, dressings, and condiments in North America, supported by its large consumer base, high per-capita food consumption, and a highly developed food processing and retail ecosystem. Strong demand from both household and foodservice channels, widespread presence of quick-service and casual dining chains, and a mature packaged food industry continue to drive consistent volume sales. Ongoing innovation in flavors, clean-label formulations, and premium and ethnic sauces, combined with strong private-label penetration and omnichannel retail distribution, reinforces the U.S.’s dominant position in the regional market.
- Mexico is witnessing steady growth in the sauces, dressings, and condiments market, driven by strong culinary traditions, increasing urbanization, and rising consumption of packaged and ready-to-use food products. Expansion of modern retail formats, growth in foodservice outlets, and increasing exposure to international cuisines are accelerating demand for table sauces, cooking sauces, and condiments. Additionally, rising disposable incomes and the growing influence of convenience-oriented cooking solutions are supporting higher penetration of branded and value-added sauces across urban and semi-urban areas.
- Canada is emerging as a high-growth market for sauces, dressings, and condiments in North America, supported by a diverse and multicultural consumer base, growing demand for global flavors, and increasing health and wellness awareness. Strong adoption of premium, organic, plant-based, and low-sodium condiments, along with expanding online grocery and meal kit services, is driving market expansion. Growth in foodservice chains, coupled with innovation in sustainable packaging and clean-label products, is further strengthening Canada’s position within the North American sauces, dressings, and condiments market.
Canada Sauces, Dressings and Condiments Market Insight
The Canada Sauces, dressings and condiments market holds a significant position within the Global industry, driven by rising online retail penetration, strong consumer preference for sustainable packaging, and increasing investments in advanced logistics and fulfillment infrastructure. The country’s stringent environmental regulations and growing emphasis on recyclability and circular economy practices are accelerating the adoption of fiber-based and eco-friendly packaging solutions. Additionally, the rapid expansion of domestic and cross-border e-commerce, growth of subscription-based brands, and increasing presence of global retailers have boosted demand for sauces, dressings and condiments Canada’s steady growth in warehousing capacity, improvements in last-mile delivery networks, and continued digital transformation across retail are further strengthening its role as an important contributor to the North America Sauces, dressings and condiments Market.
Mexico Sauces, Dressings and Condiments Market Insight
The Mexico Sauces, dressings and condiments market is expected to grow steadily, driven by rapid expansion of online shopping, increasing internet and smartphone penetration, and the rise of domestic and cross-border e-commerce platforms. Growing participation of SMEs and D2C brands in online retail is boosting demand for cost-effective packaging formats such as flexible mailers, corrugated boxes, and protective packaging. Additionally, significant investments in logistics modernization—including automated warehouses, improved transportation networks, and enhanced last-mile delivery capabilities—are strengthening the country’s e-commerce ecosystem. Supportive government initiatives to promote manufacturing competitiveness, coupled with rising consumer expectations for faster deliveries and secure packaging, further contribute to the market’s sustained growth trajectory.
U.S. Sauces, Dressings and Condiments Market Insight
U.S. is expected to dominate the Sauces, dressings and condiments Market with the largest market share of 81.32% in 2026, supported by the country’s highly mature retail and e-commerce ecosystem, strong consumer spending power, and the presence of major online retailers, logistics providers, and packaging manufacturers. Large-scale operations by companies such as Amazon, Walmart, Target, UPS, and FedEx drive substantial demand for corrugated boxes, mailers, protective packaging, and sustainable materials. Additionally, the U.S. continues to invest heavily in automation, warehouse optimization, supply chain digitalization, and environmentally responsible packaging, further solidifying its dominant position in the region.
North America Sauces, Dressings and Condiments Market Share
The Sauces, dressings and condiments industry is primarily led by well-established companies, including:
- Del Monte Foods (U.S.)
- Nestlé (Switzerland/U.S.)
- McCormick & Company (U.S.)
- The Kraft Heinz Company (U.S.)
- General Mills (U.S.)
- Kerry Group plc (Ireland)
- Casa Fiesta (U.S.)
- Bay Valley Foods (U.S.)
- AFP Advanced Food Products (U.S.)
- Berner Foods (U.S.)
- Conagra Brands (U.S.)
- Ricos (U.S.)
- Prego (U.S.)
Latest Developments in North America Sauces, Dressings and Condiments Market
- In March 2025, Prima, a leading Spanish sauces and condiments brand, launched a collaborative line of collectible sauce bottles with LALIGA. This release features eight bottles showcasing seven LALIGA players, enhancing fan engagement through limited-edition packaging for products like ketchup and barbecue sauces.
- In July 2025, Del Monte Foods announced it has voluntarily initiated Chapter 11 proceedings to pursue a value-maximizing sale process.
- In May 2025 the McCormick & Company marked the largest launch yet: 11 Mexican-inspired items including Birria Cooking Sauce, Cremosa toppings (Cilantro Lime, Chipotle), seasoning mixes, and Chamoy.
- In September 2025, Nestlé India expanded Maggi noodles production at its Sanand Factory in Gujarat with a new line adding 20,600 tons capacity for USD 9.48 million. This indirectly supports sauces, dressings, and condiments as Maggi noodles are frequently paired with MAGGI sauces like Rich Tomato Ketchup or Hot & Sweet Tomato Chilli Sauce for enhanced meals.
- In April 2025, Nestlé emphasized MAGGI's role in home cooking solutions, including Masala-ae-Magic masalas under Prepared Dishes and Cooking Aids. These innovations in cooking aids directly relate to sauces and condiments by promoting complementary use in everyday Indian recipes, boosting category synergy.
SKU-

- Interactive Data Analysis Dashboard
- Company Analysis Dashboard for high growth potential opportunities
- Research Analyst Access for customization & queries
- Competitor Analysis with Interactive dashboard
- Latest News, Updates & Trend analysis
- Harness the Power of Benchmark Analysis for Comprehensive Competitor Tracking
Table of Content
1 INTRODUCTION
1.1 OBJECTIVES OF THE STUDY
1.2 MARKET DEFINITION
1.3 OVERVIEW OF NORTH AMERICA SAUCES, DRESSINGS AND CONDIMENTS MARKET
1.4 LIMITATIONS
1.5 MARKETS COVERED
2 MARKET SEGMENTATION
2.1 MARKETS COVERED
2.2 GEOGRAPHICAL SCOPE
2.3 YEARS CONSIDERED FOR THE STUDY
2.4 CURRENCY AND PRICING
2.5 DBMR TRIPOD DATA VALIDATION MODEL
2.6 MULTIVARIATE MODELLING
2.7 PRODUCT TYPE LIFELINE CURVE
2.8 PRIMARY INTERVIEWS WITH KEY OPINION LEADERS
2.9 DBMR MARKET POSITION GRID
2.1 MARKET END USER COVERAGE GRID
2.11 VENDOR SHARE ANALYSIS
2.12 SECONDARY SOURCES
2.13 ASSUMPTIONS
3 EXECUTIVE SUMMARY
4 PREMIUM INSIGHTS
4.1 PATENT ANALYSIS– NORTH AMERICA SAUCES, DRESSINGS AND CONDIMENTS MARKET
4.1.1 PATENT QUALITY AND STRENGTH
4.1.2 PATENT FAMILIES
4.1.3 LICENSING AND COLLABORATIONS
4.1.4 REGION PATENT LANDSCAPE
4.1.5 IP STRATEGY AND MANAGEMENT
4.2 PORTERS FIVE FORCES ANALYSIS
4.3 SUPPLY CHAIN ANALYSIS
4.3.1 OVERVIEW
4.3.2 LOGISTICS COST SCENARIO
4.3.3 IMPORTANCE OF LOGISTICS SERVICE PROVIDERS
4.4 BRAND OUTLOOK
4.4.1 BRAND COMPARATIVE ANALYSIS
4.4.2 COMPANY VS BRAND OVERVIEW
4.5 CONSUMER BUYING BEHAVIOUR
4.5.1 GROUP 1 PREMIUM & BRAND-LOYAL CONSUMERS
4.5.2 GROUP 2 QUALITY-CONSCIOUS MAINSTREAM CONSUMERS
4.5.3 GROUP 3 PRICE-AWARE MASS CONSUMERS
4.5.4 GROUP 4 BUDGET-DRIVEN TRADITIONAL CONSUMERS
4.5.5 GROUP 5 NICHE & EXPERIENCE-ORIENTED CONSUMERS
4.5.6 GROUP 6 CONVENIENCE-DRIVEN OCCASIONAL BUYERS
4.6 TECHNOLIGICAL ADVANCEMENT
4.7 VALUE CHAIN ANALYSIS
4.7.1 INBOUND LOGISTICS
4.7.2 OPERATIONS
4.7.3 OUTBOUND LOGISTICS
4.7.4 MARKETING AND SALES
4.7.5 SERVICE
4.8 VENDOR SELECTION CRITERIA
4.8.1 QUALITY AND SAFETY STANDARDS
4.8.2 FINANCIAL AND OPERATIONAL RELIABILITY
4.8.3 COST AND VALUE BALANCE
4.8.4 COMPLIANCE AND TRACEABILITY
4.9 INNOVATION TRACKER AND STRATEGIC ANALYSIS
4.9.1 MAJOR DEALS AND STRATEGIC ALLIANCES ANALYSIS
4.9.1.1 JOINT VENTURES
4.9.1.2 MERGERS AND ACQUISITIONS
4.9.1.3 LICENSING AND PARTNERSHIP
4.9.1.4 TECHNOLOGY COLLABORATIONS
4.9.1.5 STRATEGIC DIVESTMENTS
4.9.2 NUMBER OF PRODUCTS IN DEVELOPMENT
4.9.3 STAGE OF DEVELOPMENT
4.9.4 TIMELINES AND MILESTONES
4.9.5 INNOVATION STRATEGIES AND METHODOLOGIES
4.9.6 RISK ASSESSMENT AND MITIGATION
4.9.7 FUTURE OUTLOOK
4.1 PRICING ANALYSIS
5 TARIFFS & IMPACT ON THE MARKET – NORTH AMERICA SAUCES, DRESSINGS AND CONDIMENTS MARKET
5.1 CURRENT TARIFF RATES IN TOP-5 COUNTRY MARKETS
5.2 OUTLOOK: LOCAL PRODUCTION VS IMPORT RELIANCE
5.3 VENDOR SELECTION CRITERIA DYNAMICS
5.4 IMPACT ON SUPPLY CHAIN
5.4.1 RAW MATERIAL PROCUREMENT
5.4.2 MANUFACTURING AND PRODUCTION
5.4.3 LOGISTICS AND DISTRIBUTION
5.4.4 PRICE PITCHING AND POSITION OF MARKET
5.5 INDUSTRY PARTICIPANTS: PROACTIVE MOVES
5.5.1 SUPPLY CHAIN OPTIMIZATION
5.5.2 JOINT VENTURE ESTABLISHMENTS
5.6 IMPACT ON PRICES
5.7 REGULATORY INCLINATION
5.7.1 GEOPOLITICAL SITUATION
5.7.2 TRADE PARTNERSHIPS BETWEEN COUNTRIES
5.7.2.1 FREE TRADE AGREEMENTS
5.7.2.2 ALLIANCE ESTABLISHMENTS
5.7.3 STATUS ACCREDITATION (INCLUDING MFN)
5.7.4 DOMESTIC COURSE OF CORRECTION
5.7.4.1 INCENTIVE SCHEMES TO BOOST PRODUCTION OUTPUTS
5.7.4.2 ESTABLISHMENT OF SPECIAL ECONOMIC ZONES / INDUSTRIAL PARKS
6 REGULATORY STANDARDS OF NORTH AMERICA SAUCES, DRESSINGS AND CONDIMENTS MARKET.
6.1 PRODUCT CODES
6.2 CERTIFIED STANDARDS
6.3 SAFETY STANDARDS
6.3.1 MATERIAL HANDLING & STORAGE
6.4 TRANSPORT & PRECAUTIONS
6.5 HAZARD IDENTIFICATION & RISK MANAGEMENT
7 MARKET OVERVIEW
7.1 DRIVERS
7.1.1 GROWTH OF E-COMMERCE SECTOR
7.1.2 EXPANDING TREND OF HOMEMADE CULINARY
7.1.3 RISING PREFERENCE FOR NORTH AMERICA FLAVOR EXPLORATION
7.1.4 GROWING FOOD SERVICE SECTOR WORLDWIDE
7.2 RESTRAINTS
7.2.1 VOLATILITY IN RAW MATERIAL PRICES
7.2.2 HIGH SUGAR AND SODIUM CONTENT
7.3 OPPORTUNITIES
7.3.1 RISE OF VEGANISM
7.3.2 INCREASING INTERNET PENETRATION IN EMERGING ECONOMIES
7.4 CHALLENGES
7.4.1 RISING FOCUS TOWARD SUSTAINABLE PACKAGING AND RECYCLABILITY
7.4.2 HIGH COMPETITION/SATURATION
8 NORTH AMERICA SAUCES, DRESSINGS AND CONDIMENTS MARKET, BY TYPE
8.1 OVERVIEW
8.1.1 SAUCES
8.1.2 CONDIMENTS
8.1.3 DRESSINGS
8.2 NORTH AMERICA SAUCES, DRESSINGS AND CONDIMENTS MARKET, BY TYPE, 2018-2033 (KILO TONS)
8.2.1 SAUCES
8.2.2 CONDIMENTS
8.2.3 DRESSINGS
8.3 NORTH AMERICA SAUCES IN SAUCES, DRESSINGS AND CONDIMENTS MARKET, BY TYPE, 2018-2033 (USD MILLION)
8.3.1 TOMATO-BASED SAUCES
8.3.2 SOY-BASED SAUCES
8.3.3 CHILI-BASED SAUCES
8.3.4 VINEGAR AND MUSTARD-BASED SAUCES
8.3.5 OIL-BASED SAUCES
8.3.6 FERMENTED OR PICKLED SAUCES
8.3.7 ETHNIC/REGIONAL SAUCES
8.3.8 DAIRY-BASED SAUCES
8.3.9 OTHERS
8.4 NORTH AMERICA TOMATO-BASED SAUCES IN SAUCES, DRESSINGS AND CONDIMENTS MARKET, BY TYPE, 2018-2033 (USD MILLION)
8.4.1 KETCHUP
8.4.2 MARINARA
8.4.3 PIZZA SAUCE
8.4.4 PASTA SAUCE
8.5 NORTH AMERICA SOY-BASED SAUCESIN SAUCES, DRESSINGS AND CONDIMENTS MARKET, BY TYPE, 2018-2033 (USD MILLION)
8.5.1 SOY SAUCE
8.5.2 TERIYAKI SAUCE
8.5.3 HOISIN SAUCE
8.6 NORTH AMERICA SOY SAUCE IN SAUCES, DRESSINGS AND CONDIMENTS MARKET, BY TYPE, 2018-2033 (USD MILLION)
8.6.1 LIGHT
8.6.2 DARK
8.7 NORTH AMERICA CHILI-BASED SAUCES IN SAUCES, DRESSINGS AND CONDIMENTS MARKET, BY TYPE, 2018-2033 (USD MILLION)
8.7.1 HOT SAUCE
8.7.2 SRIRACHA
8.7.3 CHILI GARLIC SAUCE
8.8 NORTH AMERICA VINEGAR AND MUSTARD-BASED SAUCES IN SAUCES, DRESSINGS AND CONDIMENTS MARKET, BY TYPE, 2018-2033 (USD MILLION)
8.8.1 BARBECUE SAUCE
8.8.2 SALAD DRESSINGS
8.8.3 HONEY MUSTARD
8.9 NORTH AMERICA OIL-BASED SAUCES IN SAUCES, DRESSINGS AND CONDIMENTS MARKET, BY TYPE, 2018-2033 (USD MILLION)
8.9.1 PESTO
8.9.2 GARLIC OIL
8.9.3 CHIMICHURRI
8.1 NORTH AMERICA DAIRY-BASED SAUCES IN SAUCES, DRESSINGS AND CONDIMENTS MARKET, BY TYPE, 2018-2033 (USD MILLION)
8.10.1 CHEESE SAUCE
8.10.2 ALFREDO SAUCE
8.10.3 CREAM-BASED PASTA SAUCES
8.11 NORTH AMERICA SAUCES IN SAUCES, DRESSINGS AND CONDIMENTS MARKET, BY REGION, 2018-2033 (USD MILLION)
8.11.1 ASIA-PACIFIC
8.11.2 NORTH AMERICA
8.11.3 EUROPE
8.11.4 SOUTH AMERICA
8.11.5 MIDDLE EAST & AFRICA
8.12 NORTH AMERICA SAUCES IN SAUCES, DRESSINGS AND CONDIMENTS MARKET, BY REGION, 2018-2033 (KILO TONS)
8.12.1 ASIA-PACIFIC
8.12.2 NORTH AMERICA
8.12.3 EUROPE
8.12.4 SOUTH AMERICA
8.12.5 MIDDLE EAST & AFRICA
8.13 NORTH AMERICA CONDIMENTS IN SAUCES, DRESSINGS AND CONDIMENTS MARKET, BY TYPE, 2018-2033 (USD MILLION)
8.13.1 AROMATIC
8.13.2 ACID
8.13.3 ACRID OR PEPPERY
8.13.4 ALLYLIC OR ALLIACEOUS
8.13.5 MINERAL
8.13.6 ANIMAL
8.14 NORTH AMERICA AROMATIC IN SAUCES, DRESSINGS AND CONDIMENTS MARKET, BY TYPE, 2018-2033 (USD MILLION)
8.14.1 CINNAMON
8.14.2 VANILLA
8.14.3 CLOVE
8.14.4 PARSLEY
8.14.5 OTHERS
8.15 NORTH AMERICA ACID IN SAUCES, DRESSINGS AND CONDIMENTS MARKET, BY TYPE, 2018-2033 (USD MILLION)
8.15.1 VINEGAR (WHITE, CIDER OR WINE)
8.15.2 GHERKINS
8.15.3 CAPERS
8.16 NORTH AMERICA ACRID OR PEPPERY IN SAUCES, DRESSINGS AND CONDIMENTS MARKET, BY TYPE, 2018-2033 (USD MILLION)
8.16.1 CHILLIES
8.16.2 GINGER
8.16.3 CAYENNE
8.16.4 BLACK AND WHITE PEPPER
8.17 NORTH AMERICA ALLYLIC OR ALLIACEOUS IN SAUCES, DRESSINGS AND CONDIMENTS MARKET, BY TYPE, 2018-2033 (USD MILLION)
8.17.1 GARLIC
8.17.2 ONION
8.17.3 OTHERS
8.18 NORTH AMERICA ANIMAL IN SAUCES, DRESSINGS AND CONDIMENTS MARKET, BY TYPE, 2018-2033 (USD MILLION)
8.18.1 BEEF BOUILLON
8.18.2 ANCHOVIES
8.18.3 CAVIAR
8.19 NORTH AMERICA CONDIMENTS IN SAUCES, DRESSINGS AND CONDIMENTS MARKET, BY REGION, 2018-2033 (USD MILLION)
8.19.1 ASIA-PACIFIC
8.19.2 NORTH AMERICA
8.19.3 EUROPE
8.19.4 SOUTH AMERICA
8.19.5 MIDDLE EAST & AFRICA
8.2 NORTH AMERICA CONDIMENTS IN SAUCES, DRESSINGS AND CONDIMENTS MARKET, BY REGION, 2018-2033 (KILO TONS)
8.20.1 ASIA-PACIFIC
8.20.2 NORTH AMERICA
8.20.3 EUROPE
8.20.4 SOUTH AMERICA
8.20.5 MIDDLE EAST & AFRICA
8.21 NORTH AMERICA DRESSINGS IN SAUCES, DRESSINGS AND CONDIMENTS MARKET, BY TYPE, 2018-2033 (USD MILLION)
8.21.1 MAYONNAISE DRESSINGS
8.21.2 VINAIGRETTE DRESSINGS
8.21.3 CREAM AND CREAM-STYLE DRESSINGS
8.21.4 TOMATO-BASED DRESSINGS
8.22 NORTH AMERICA DRESSINGS IN SAUCES, DRESSINGS AND CONDIMENTS MARKET, BY REGION, 2018-2033 (USD MILLION)
8.22.1 ASIA-PACIFIC
8.22.2 NORTH AMERICA
8.22.3 EUROPE
8.22.4 SOUTH AMERICA
8.22.5 MIDDLE EAST & AFRICA
8.23 NORTH AMERICA DRESSINGS IN SAUCES, DRESSINGS AND CONDIMENTS MARKET, BY REGION, 2018-2033 (KILO TONS)
8.23.1 ASIA-PACIFIC
8.23.2 NORTH AMERICA
8.23.3 EUROPE
8.23.4 SOUTH AMERICA
8.23.5 MIDDLE EAST & AFRICA
9 NORTH AMERICA SAUCES, DRESSINGS AND CONDIMENTS MARKET, BY INGREDIENTS
9.1 OVERVIEW
9.1.1 VEGETABLE
9.1.2 FRUITS
9.1.3 SPICES
9.1.4 FOOD ADDITIVES
9.1.5 HERBS
9.1.6 OTHERS
9.2 NORTH AMERICA VEGETABLE IN SAUCES, DRESSINGS AND CONDIMENTS MARKET, BY TYPE, 2018-2033 (USD MILLION)
9.2.1 TOMATOES
9.2.2 CARROTS
9.2.3 PEAS
9.2.4 CAULIFLOWER
9.2.5 OTHERS
9.3 NORTH AMERICA VEGETABLE IN SAUCES, DRESSINGS AND CONDIMENTS MARKET, BY REGION, 2018-2033 (USD MILLION)
9.3.1 ASIA-PACIFIC
9.3.2 NORTH AMERICA
9.3.3 EUROPE
9.3.4 SOUTH AMERICA
9.3.5 MIDDLE EAST & AFRICA
9.4 NORTH AMERICA FRUITS IN SAUCES, DRESSINGS AND CONDIMENTS MARKET, BY TYPE, 2018-2033 (USD MILLION)
9.4.1 CITRUS FRUITS
9.4.2 TROPICAL FRUITS
9.4.3 STONE FRUITS
9.4.4 BERRIES
9.5 NORTH AMERICA CITRUS FRUITS IN SAUCES, DRESSINGS AND CONDIMENTS MARKET, BY TYPE, 2018-2033 (USD MILLION)
9.5.1 LEMON
9.5.2 ORANGE
9.5.3 GOOSEBERRY
9.5.4 OTHERS
9.6 NORTH AMERICA TROPICAL FRUITS IN SAUCES, DRESSINGS AND CONDIMENTS MARKET, BY TYPE, 2018-2033 (USD MILLION)
9.6.1 AVOCADO
9.6.2 BANANA
9.6.3 CHIKOO
9.6.4 OTHERS
9.7 NORTH AMERICA STONE FRUITS IN SAUCES, DRESSINGS AND CONDIMENTS MARKET, BY TYPE, 2018-2033 (USD MILLION)
9.7.1 MANGOES
9.7.2 PEACHES
9.7.3 CHERRIES
9.7.4 APRICOTS
9.7.5 LYCHEE
9.7.6 OTHERS
9.8 NORTH AMERICA BERRIES IN SAUCES, DRESSINGS AND CONDIMENTS MARKET, BY TYPE, 2018-2033 (USD MILLION)
9.8.1 STRAWBERRIES
9.8.2 RASPBERRIES
9.8.3 BLUEBERRIES
9.8.4 OTHERS
9.9 NORTH AMERICA FRUITS IN SAUCES, DRESSINGS AND CONDIMENTS MARKET, BY REGION, 2018-2033 (USD MILLION)
9.9.1 ASIA-PACIFIC
9.9.2 NORTH AMERICA
9.9.3 EUROPE
9.9.4 SOUTH AMERICA
9.9.5 MIDDLE EAST & AFRICA
9.1 NORTH AMERICA SPICES IN SAUCES, DRESSINGS AND CONDIMENTS MARKET, BY TYPE, 2018-2033 (USD MILLION)
9.10.1 CHILI
9.10.2 PEPPER
9.10.3 HOT PAPRIKA
9.10.4 CAYENNE PEPPER
9.10.5 FENNEL
9.10.6 OTHERS
9.11 NORTH AMERICA SPICES IN SAUCES, DRESSINGS AND CONDIMENTS MARKET, BY REGION, 2018-2033 (USD MILLION)
9.11.1 ASIA-PACIFIC
9.11.2 NORTH AMERICA
9.11.3 EUROPE
9.11.4 SOUTH AMERICA
9.11.5 MIDDLE EAST & AFRICA
9.12 NORTH AMERICA FOOD ADDITIVES IN SAUCES, DRESSINGS AND CONDIMENTS MARKET, BY REGION, 2018-2033 (USD MILLION)
9.12.1 ASIA-PACIFIC
9.12.2 NORTH AMERICA
9.12.3 EUROPE
9.12.4 SOUTH AMERICA
9.12.5 MIDDLE EAST & AFRICA
9.13 NORTH AMERICA HERBS IN SAUCES, DRESSINGS AND CONDIMENTS MARKET, BY REGION, 2018-2033 (USD MILLION)
9.13.1 ASIA-PACIFIC
9.13.2 NORTH AMERICA
9.13.3 EUROPE
9.13.4 SOUTH AMERICA
9.13.5 MIDDLE EAST & AFRICA
9.14 NORTH AMERICA OTHERS IN SAUCES, DRESSINGS AND CONDIMENTS MARKET, BY REGION, 2018-2033 (USD MILLION)
9.14.1 ASIA-PACIFIC
9.14.2 NORTH AMERICA
9.14.3 EUROPE
9.14.4 SOUTH AMERICA
9.14.5 MIDDLE EAST & AFRICA
10 NORTH AMERICA SAUCES, DRESSINGS AND CONDIMENTS MARKET, BY PACKAGING TYPE
10.1 OVERVIEW
10.1.1 BOTTLES
10.1.2 POUCH
10.1.3 SACHETS
10.1.4 CONTAINERS
10.1.5 CANS
10.1.6 BOXES
10.1.7 CUPS
10.1.8 BAG IN BOX
10.1.9 PACKS
10.1.10 OTHERS
10.2 NORTH AMERICA BOTTLES IN SAUCES, DRESSINGS AND CONDIMENTS MARKET, BY REGION, 2018-2033 (USD MILLION)
10.2.1 ASIA-PACIFIC
10.2.2 NORTH AMERICA
10.2.3 EUROPE
10.2.4 SOUTH AMERICA
10.2.5 MIDDLE EAST & AFRICA
10.3 NORTH AMERICA POUCH IN SAUCES, DRESSINGS AND CONDIMENTS MARKET, BY TYPE, 2018-2033 (USD MILLION)
10.3.1 STAND-UP POUCHES
10.3.2 VACUUM POUCHES
10.3.3 FLAT BOTTOM POUCHES
10.3.4 QUAD SEAL POUCHES
10.3.5 PILLOW POUCHES
10.3.6 THREE-SIDE SEAL POUCHES
10.3.7 GUSSETED POUCHES
10.4 NORTH AMERICA STAND-UP POUCHES IN SAUCES, DRESSINGS AND CONDIMENTS MARKET, BY TYPE, 2018-2033 (USD MILLION)
10.4.1 JAR SHAPE
10.4.2 TOP SHAPE SEALED
10.4.3 POURING SHAPE
10.4.4 TOP VALVE
10.4.5 FRONT VALVE
10.4.6 INCLINED SIDES
10.4.7 CORNER VALVE
10.4.8 TOP SHAPE
10.5 NORTH AMERICA POUCH IN SAUCES, DRESSINGS AND CONDIMENTS MARKET, BY REGION, 2018-2033 (USD MILLION)
10.5.1 ASIA-PACIFIC
10.5.2 NORTH AMERICA
10.5.3 EUROPE
10.5.4 SOUTH AMERICA
10.5.5 MIDDLE EAST & AFRICA
10.6 NORTH AMERICA SACHETS IN SAUCES, DRESSINGS AND CONDIMENTS MARKET, BY TYPE, 2018-2033 (USD MILLION)
10.6.1 FLAT SACHETS
10.6.2 TOP SIDES
10.7 NORTH AMERICA FLAT SACHETS IN SAUCES, DRESSINGS AND CONDIMENTS MARKET, BY TYPE, 2018-2033 (USD MILLION)
10.7.1 SEALED
10.7.2 FLAT
10.7.3 TWIN SACHETS
10.7.4 STRING SACHETS
10.8 NORTH AMERICA SEALED IN SAUCES, DRESSINGS AND CONDIMENTS MARKET, BY TYPE, 2018-2033 (USD MILLION)
10.8.1 4 SIDES SEAL
10.8.2 3 SIDES SEAL
10.9 NORTH AMERICA FLAT IN SAUCES, DRESSINGS AND CONDIMENTS MARKET, BY TYPE, 2018-2033 (USD MILLION)
10.9.1 VALVE
10.9.2 DISPLAY PERFORATIONS
10.9.3 PARTIAL SHAPE
10.9.4 EUROHOLE
10.1 NORTH AMERICA SACHETS IN SAUCES, DRESSINGS AND CONDIMENTS MARKET, BY REGION, 2018-2033 (USD MILLION)
10.10.1 ASIA-PACIFIC
10.10.2 NORTH AMERICA
10.10.3 EUROPE
10.10.4 SOUTH AMERICA
10.10.5 MIDDLE EAST & AFRICA
10.11 NORTH AMERICA CONTAINERS IN SAUCES, DRESSINGS AND CONDIMENTS MARKET, BY REGION, 2018-2033 (USD MILLION)
10.11.1 ASIA-PACIFIC
10.11.2 NORTH AMERICA
10.11.3 EUROPE
10.11.4 SOUTH AMERICA
10.11.5 MIDDLE EAST & AFRICA
10.12 NORTH AMERICA CANS IN SAUCES, DRESSINGS AND CONDIMENTS MARKET, BY REGION, 2018-2033 (USD MILLION)
10.12.1 ASIA-PACIFIC
10.12.2 NORTH AMERICA
10.12.3 EUROPE
10.12.4 SOUTH AMERICA
10.12.5 MIDDLE EAST & AFRICA
10.13 NORTH AMERICA BOXES IN SAUCES, DRESSINGS AND CONDIMENTS MARKET, BY REGION, 2018-2033 (USD MILLION)
10.13.1 ASIA-PACIFIC
10.13.2 NORTH AMERICA
10.13.3 EUROPE
10.13.4 SOUTH AMERICA
10.13.5 MIDDLE EAST & AFRICA
10.14 NORTH AMERICA CUPS IN SAUCES, DRESSINGS AND CONDIMENTS MARKET, BY REGION, 2018-2033 (USD MILLION)
10.14.1 ASIA-PACIFIC
10.14.2 NORTH AMERICA
10.14.3 EUROPE
10.14.4 SOUTH AMERICA
10.14.5 MIDDLE EAST & AFRICA
10.15 NORTH AMERICA BAG IN BOX IN SAUCES, DRESSINGS AND CONDIMENTS MARKET, BY REGION, 2018-2033 (USD MILLION)
10.15.1 ASIA-PACIFIC
10.15.2 NORTH AMERICA
10.15.3 EUROPE
10.15.4 SOUTH AMERICA
10.15.5 MIDDLE EAST & AFRICA
10.16 NORTH AMERICA PACKS IN SAUCES, DRESSINGS AND CONDIMENTS MARKET, BY TYPE, 2018-2033 (USD MILLION)
10.16.1 DOYPACKS
10.16.2 STICK PACKS
10.17 NORTH AMERICA PACKS IN SAUCES, DRESSINGS AND CONDIMENTS MARKET, BY REGION, 2018-2033 (USD MILLION)
10.17.1 ASIA-PACIFIC
10.17.2 NORTH AMERICA
10.17.3 EUROPE
10.17.4 SOUTH AMERICA
10.17.5 MIDDLE EAST & AFRICA
10.18 NORTH AMERICA OTHERS IN SAUCES, DRESSINGS AND CONDIMENTS MARKET, BY REGION, 2018-2033 (USD MILLION)
10.18.1 ASIA-PACIFIC
10.18.2 NORTH AMERICA
10.18.3 EUROPE
10.18.4 SOUTH AMERICA
10.18.5 MIDDLE EAST & AFRICA
11 NORTH AMERICA SAUCES, DRESSINGS AND CONDIMENTS MARKET, BY PACKAGING MATERIAL
11.1 OVERVIEW
11.1.1 PLASTIC
11.1.2 GLASS
11.1.3 PAPER AND PAPERBOARD
11.1.4 METAL
11.1.5 OTHERS
11.2 NORTH AMERICA PLASTIC IN SAUCES, DRESSINGS AND CONDIMENTS MARKET, BY PACKAGING MATERIAL, 2018-2033 (USD MILLION)
11.2.1 POLYETHYLENE (PE)
11.2.2 POLYPROPYLENE (PP)
11.2.3 POLYCARBONATE (PC)
11.2.4 POLYSTYRENE (PS)
11.2.5 POLYVINYL CHLORIDE (PVC)
11.3 NORTH AMERICA POLYETHYLENE (PE) IN SAUCES, DRESSINGS AND CONDIMENTS MARKET, BY PACKAGING MATERIAL, 2018-2033 (USD MILLION)
11.3.1 HIGH DENSITY POLYETHYLENE (HDPE)
11.3.2 OW DENSITY POLYETHYLENE (LDPE)
11.3.3 LINEAR LOW DENSITY POLYETHYLENE (LLDPE)
11.3.4 POLYETHYLENE TEREPHTHALATE (PET)
11.3.5 OTHERS
11.4 NORTH AMERICA PLASTIC IN SAUCES, DRESSINGS AND CONDIMENTS MARKET, BY REGION, 2018-2033 (USD MILLION)
11.4.1 ASIA-PACIFIC
11.4.2 NORTH AMERICA
11.4.3 EUROPE
11.4.4 SOUTH AMERICA
11.4.5 MIDDLE EAST & AFRICA
11.5 NORTH AMERICA GLASS IN SAUCES, DRESSINGS AND CONDIMENTS MARKET, BY REGION, 2018-2033 (USD MILLION)
11.5.1 ASIA-PACIFIC
11.5.2 NORTH AMERICA
11.5.3 EUROPE
11.5.4 SOUTH AMERICA
11.5.5 MIDDLE EAST & AFRICA
11.6 NORTH AMERICA PAPER AND PAPERBOARD IN SAUCES, DRESSINGS AND CONDIMENTS MARKET, BY PACKAGING MATERIAL, 2018-2033 (USD MILLION)
11.6.1 PAPERBOARD CARTONS
11.6.2 CORRUGATED BOARD
11.6.3 KRAFT PAPER
11.6.4 PAPER BAGS
11.6.5 GREASEPROOF PAPER
11.7 NORTH AMERICA PAPER AND PAPERBOARD IN SAUCES, DRESSINGS AND CONDIMENTS MARKET, BY REGION, 2018-2033 (USD MILLION)
11.7.1 ASIA-PACIFIC
11.7.2 NORTH AMERICA
11.7.3 EUROPE
11.7.4 SOUTH AMERICA
11.7.5 MIDDLE EAST & AFRICA
11.8 NORTH AMERICA METAL IN SAUCES, DRESSINGS AND CONDIMENTS MARKET, BY PACKAGING MATERIAL, 2018-2033 (USD MILLION)
11.8.1 STEEL
11.8.2 ALUMINUM
11.8.3 TIN
11.8.4 OTHERS
11.9 NORTH AMERICA METAL IN SAUCES, DRESSINGS AND CONDIMENTS MARKET, BY REGION, 2018-2033 (USD MILLION)
11.9.1 ASIA-PACIFIC
11.9.2 NORTH AMERICA
11.9.3 EUROPE
11.9.4 SOUTH AMERICA
11.9.5 MIDDLE EAST & AFRICA
11.1 NORTH AMERICA OTHERS IN SAUCES, DRESSINGS AND CONDIMENTS MARKET, BY REGION, 2018-2033 (USD MILLION)
11.10.1 ASIA-PACIFIC
11.10.2 NORTH AMERICA
11.10.3 EUROPE
11.10.4 SOUTH AMERICA
11.10.5 MIDDLE EAST & AFRICA
12 NORTH AMERICA SAUCES, DRESSINGS AND CONDIMENTS MARKET, BY PACKAGING SIZE
12.1 OVERVIEW
12.1.1 250 ML – 500 ML
12.1.2 50 ML – 250 ML
12.1.3 500 ML – 1L
12.1.4 1L – 5L
12.1.5 LESS THAN 50 ML
12.1.6 MORE THAN 5L
12.2 NORTH AMERICA 250 ML – 500 ML IN SAUCES, DRESSINGS AND CONDIMENTS MARKET, BY REGION, 2018-2033 (USD MILLION)
12.2.1 ASIA-PACIFIC
12.2.2 NORTH AMERICA
12.2.3 EUROPE
12.2.4 SOUTH AMERICA
12.2.5 MIDDLE EAST & AFRICA
12.3 NORTH AMERICA 50 ML – 250 ML IN SAUCES, DRESSINGS AND CONDIMENTS MARKET, BY REGION, 2018-2033 (USD MILLION)
12.3.1 ASIA-PACIFIC
12.3.2 NORTH AMERICA
12.3.3 EUROPE
12.3.4 SOUTH AMERICA
12.3.5 MIDDLE EAST & AFRICA
12.4 NORTH AMERICA 500 ML – 1L IN SAUCES, DRESSINGS AND CONDIMENTS MARKET, BY REGION, 2018-2033 (USD MILLION)
12.4.1 ASIA-PACIFIC
12.4.2 NORTH AMERICA
12.4.3 EUROPE
12.4.4 SOUTH AMERICA
12.4.5 MIDDLE EAST & AFRICA
12.5 NORTH AMERICA 1L – 5L IN SAUCES, DRESSINGS AND CONDIMENTS MARKET, BY REGION, 2018-2033 (USD MILLION)
12.5.1 SIA-PACIFIC
12.5.2 NORTH AMERICA
12.5.3 EUROPE
12.5.4 SOUTH AMERICA
12.5.5 MIDDLE EAST & AFRICA
12.6 NORTH AMERICA LESS THAN 50 ML IN SAUCES, DRESSINGS AND CONDIMENTS MARKET, BY REGION, 2018-2033 (USD MILLION)
12.6.1 ASIA-PACIFIC
12.6.2 NORTH AMERICA
12.6.3 EUROPE
12.6.4 SOUTH AMERICA
12.6.5 MIDDLE EAST & AFRICA
12.7 NORTH AMERICA MORE THAN 5L IN SAUCES, DRESSINGS AND CONDIMENTS MARKET, BY REGION, 2018-2033 (USD MILLION)
12.7.1 ASIA-PACIFIC
12.7.2 NORTH AMERICA
12.7.3 EUROPE
12.7.4 SOUTH AMERICA
12.7.5 MIDDLE EAST & AFRICA
13 NORTH AMERICA SAUCES, DRESSINGS AND CONDIMENTS MARKET, BY END USER
13.1 OVERVIEW
13.1.1 RETAIL FOOD
13.1.2 FOOD SERVICES
13.1.3 FOOD PROCESSORS
13.1.4 OTHERS
13.2 NORTH AMERICA RETAIL FOOD IN SAUCES, DRESSINGS AND CONDIMENTS MARKET, BY REGION, 2018-2033 (USD MILLION)
13.2.1 ASIA-PACIFIC
13.2.2 NORTH AMERICA
13.2.3 EUROPE
13.2.4 SOUTH AMERICA
13.2.5 MIDDLE EAST & AFRICA
13.3 NORTH AMERICA FOOD SERVICES IN SAUCES, DRESSINGS AND CONDIMENTS MARKET, BY TYPE, 2018-2033 (USD MILLION)
13.3.1 QUICK SERVICE RESTAURANTS
13.3.2 FAMILY RESTAURANTS
13.3.3 HOTELS
13.3.4 OTHERS
13.4 NORTH AMERICA QUICK SERVICE RESTAURANTS IN SAUCES, DRESSINGS AND CONDIMENTS MARKET, BY TYPE, 2018-2033 (USD MILLION)
13.4.1 FAST FOOD RESTAURANTS
13.4.2 CAFETERIAS
13.4.3 FOOD TRUCKS
13.4.4 JOINTS
13.4.5 OTHERS
13.5 NORTH AMERICA FOOD SERVICES IN SAUCES, DRESSINGS AND CONDIMENTS MARKET, BY REGION, 2018-2033 (USD MILLION)
13.5.1 ASIA-PACIFIC
13.5.2 NORTH AMERICA
13.5.3 EUROPE
13.5.4 SOUTH AMERICA
13.5.5 MIDDLE EAST & AFRICA
13.6 NORTH AMERICA FOOD PROCESSORS IN SAUCES, DRESSINGS AND CONDIMENTS MARKET, BY REGION, 2018-2033 (USD MILLION)
13.6.1 ASIA-PACIFIC
13.6.2 NORTH AMERICA
13.6.3 EUROPE
13.6.4 SOUTH AMERICA
13.6.5 MIDDLE EAST & AFRICA
13.7 NORTH AMERICA OTHERS IN SAUCES, DRESSINGS AND CONDIMENTS MARKET, BY REGION, 2018-2033 (USD MILLION)
13.7.1 ASIA-PACIFIC
13.7.2 NORTH AMERICA
13.7.3 EUROPE
13.7.4 SOUTH AMERICA
13.7.5 MIDDLE EAST & AFRICA
14 NORTH AMERICA SAUCES, DRESSINGS AND CONDIMENTS MARKET, BY DISTRIBUTION CHANNEL
14.1 OVERVIEW
14.1.1 OFFLINE-TRADE
14.1.2 ONLINE TRADE
14.2 NORTH AMERICA OFFLINE-TRADE IN SAUCES, DRESSINGS AND CONDIMENTS MARKET, BY TYPE, 2018-2033 (USD MILLION)
14.2.1 STORE-BASED RETAILERS
14.2.2 NON-STORE BASED
14.3 NORTH AMERICA STORE-BASED RETAILERS IN SAUCES, DRESSINGS AND CONDIMENTS MARKET, BY TYPE, 2018-2033 (USD MILLION)
14.3.1 HYPERMARKETS/SUPERMARKETS
14.3.2 GROCERY STORES
14.3.3 CONVENIENCE STORES
14.3.4 SPECIALTY STORES
14.3.5 OTHERS
14.4 NORTH AMERICA NON-STORE BASED IN SAUCES, DRESSINGS AND CONDIMENTS MARKET, BY TYPE, 2018-2033 (USD MILLION)
14.4.1 VENDING MACHINES
14.4.2 OTHERS
14.5 NORTH AMERICA OFFLINE TRADE IN SAUCES, DRESSINGS AND CONDIMENTS MARKET, BY REGION, 2018-2033 (USD MILLION)
14.5.1 ASIA-PACIFIC
14.5.2 NORTH AMERICA
14.5.3 EUROPE
14.5.4 SOUTH AMERICA
14.5.5 MIDDLE EAST & AFRICA
14.6 NORTH AMERICA ONLINE TRADE IN SAUCES, DRESSINGS AND CONDIMENTS MARKET, BY TYPE, 2018-2033 (USD MILLION)
14.6.1 E-COMMERCE
14.6.2 COMPANY OWNED WEBSITE
14.7 NORTH AMERICA ONLINE TRADE IN SAUCES, DRESSINGS AND CONDIMENTS MARKET, BY REGION, 2018-2033 (USD MILLION)
14.7.1 ASIA-PACIFIC
14.7.2 NORTH AMERICA
14.7.3 EUROPE
14.7.4 SOUTH AMERICA
14.7.5 MIDDLE EAST & AFRICA
15 NORTH AMERICA SAUCES, DRESSINGS AND CONDIMENTS MARKET, BY REGION
15.1 NORTH AMERICA
15.1.1 U.S.
15.1.2 CANADA
15.1.3 MEXICO
16 NORTH AMERICA SAUCES, DRESSINGS AND CONDIMENTS MARKET
16.1 COMPANY SHARE ANALYSIS: GLOBAL
17 SWOT ANALYSIS
18 COMAPANY PROFILES
18.1 THE KRAFT HEINZ COMPANY (KRAFT HEINZ BRAND)
18.1.1 COMPANY SNAPSHOT
18.1.2 REVENUE ANALYSIS
18.1.3 COMPANY SHARE ANALYSIS
18.1.4 PRODUCT PORTFOLIO
18.1.5 RECENT DEVEOPMENT
18.2 UNILEVER.
18.2.1 COMPANY SNAPSHOT
18.2.2 REVENUE ANALYSIS
18.2.3 COMPANY SHARE ANALYSIS
18.2.4 PRODUCT PORTFOLIO
18.2.5 RECENT DEVELOPMENT
18.3 NESTLE
18.3.1 COMPANY SNAPSHOT
18.3.2 REVENUE ANALYSIS
18.3.3 COMPANY SHARE ANALYSIS
18.3.4 PRODUCT PORTFOLIO
18.3.5 RECENT DEVEOPMENT
18.4 MCCORMICK & COMPANY, INC.
18.4.1 COMPANY SNAPSHOT
18.4.2 REVENUE ANALYSIS
18.4.3 COMPANY SHARE ANALYSIS
18.4.4 PRODUCT PORTFOLIO
18.4.5 RECENT DEVEOPMENT
18.5 KIKKOMAN CORPORATION
18.5.1 COMPANY SNAPSHOT
18.5.2 REVENUE ANALYSIS
18.5.3 COMPANY SHARE ANALYSIS
18.5.4 PRODUCT PORTFOLIO
18.5.5 RECENT DEVEOPMENT
18.6 AFP ADVANCED FOOD PRODUCTS
18.6.1 COMPANY SNAPSHOT
18.6.2 PRODUCT PORTFOLIO
18.6.3 RECENT DEVEOPMENT
18.7 BARILLA G. E R. F.LLI S.P.A
18.7.1 COMPANY SNAPSHOT
18.7.2 PRODUCT PORTFOLIO
18.7.3 RECENT DEVELOPMENT
18.8 BAY VALLEY FOODS
18.8.1 COMPANY SNAPSHOT
18.8.2 PRODUCT PORTFOLIO
18.8.3 RECENT DEVEOPMENT
18.9 BEERENBERG PTY LTD
18.9.1 COMPANY SNAPSHOT
18.9.2 PRODUCT PORTFOLIO
18.9.3 RECENT DEVELOPMENT
18.1 BERNER FOODS
18.10.1 COMPANY SNAPSHOT
18.10.2 PRODUCT PORTFOLIO
18.10.3 RECENT DEVEOPMENT
18.11 BOLTON GROUP
18.11.1 COMPANY SNAPSHOT
18.11.2 PRODUCT PORTFOLIO
18.11.3 RECENT DEVEOPMENT
18.12 CAMPBELL
18.12.1 COMPANY SNAPSHOT
18.12.2 REVENUE ANALYSIS
18.12.3 PRODUCT PORTFOLIO
18.12.4 RECENT DEVEOPMENT
18.13 CONAGRA
18.13.1 COMPANY SNAPSHOT
18.13.2 REVENUE ANALYSIS
18.13.3 PRODUCT PORTFOLIO
18.13.4 RECENT DEVEOPMENT
18.14 DEL MONTE FOODS CORPORATION II INC.
18.14.1 COMPANY SNAPSHOT
18.14.2 PRODUCT PORTFOLIO
18.14.3 RECENT DEVEOPMENT
18.15 FUNACHO
18.15.1 COMPANY SNAPSHOT
18.15.2 PRODUCT PORTFOLIO
18.15.3 RECENT DEVEOPMENT
18.16 GENERAL MILLS INC..
18.16.1 COMPANY SNAPSHOT
18.16.2 REVENUE ANALYSIS
18.16.3 PRODUCT PORTFOLIO
18.16.4 RECENT DEVELOPMENT
18.17 KEWPIE CORPORATION
18.17.1 COMPANY SNAPSHOT
18.17.2 REVENUE ANALYSIS
18.17.3 PRODUCT PORTFOLIO
18.17.4 RECENT DEVEOPMENT
18.18 RAGU (MIZKAN AMERICA, INC)
18.18.1 COMPANY SNAPSHOT
18.18.2 PRODUCT PORTFOLIO
18.18.3 RECENT DEVEOPMENT
18.19 RICOS
18.19.1 COMPANY SNAPSHOT
18.19.2 PRODUCT PORTFOLIO
18.19.3 RECENT DEVEOPMENT
18.2 TASMANIAN GOURMET SAUCE CO.
18.20.1 COMPANY SNAPSHOT
18.20.2 PRODUCT PORTFOLIO
18.20.3 RECENT DEVEOPMENT
18.21 TATUA
18.21.1 COMPANY SNAPSHOT
18.21.2 PRODUCT PORTFOLIO
18.21.3 RECENT DEVEOPMENT
19 QUESTIONNAIRE
20 RELATED REPORTS
List of Table
TABLE 1 NORTH AMERICA SAUCES, DRESSINGS AND CONDIMENTS MARKET, BY TYPE, 2018-2033 (USD MILLION)
TABLE 2 NORTH AMERICA SAUCES, DRESSINGS AND CONDIMENTS MARKET, BY TYPE, 2018-2033 (KILO TONS)
TABLE 3 NORTH AMERICA SAUCES IN SAUCES, DRESSINGS AND CONDIMENTS MARKET, BY TYPE, 2018-2033 (USD MILLION)
TABLE 4 NORTH AMERICA TOMATO-BASED SAUCES IN SAUCES, DRESSINGS AND CONDIMENTS MARKET, BY TYPE, 2018-2033 (USD MILLION)
TABLE 5 NORTH AMERICA SOY-BASED SAUCESIN SAUCES, DRESSINGS AND CONDIMENTS MARKET, BY TYPE, 2018-2033 (USD MILLION)
TABLE 6 NORTH AMERICA SOY SAUCE IN SAUCES, DRESSINGS AND CONDIMENTS MARKET, BY TYPE, 2018-2033 (USD MILLION)
TABLE 7 NORTH AMERICA CHILI-BASED SAUCES IN SAUCES, DRESSINGS AND CONDIMENTS MARKET, BY TYPE, 2018-2033 (USD MILLION)
TABLE 8 NORTH AMERICA VINEGAR AND MUSTARD-BASED SAUCES IN SAUCES, DRESSINGS AND CONDIMENTS MARKET, BY TYPE, 2018-2033 (USD MILLION)
TABLE 9 NORTH AMERICA OIL-BASED SAUCES IN SAUCES, DRESSINGS AND CONDIMENTS MARKET, BY TYPE, 2018-2033 (USD MILLION)
TABLE 10 NORTH AMERICA DAIRY-BASED SAUCES IN SAUCES, DRESSINGS AND CONDIMENTS MARKET, BY TYPE, 2018-2033 (USD MILLION)
TABLE 11 NORTH AMERICA SAUCES IN SAUCES, DRESSINGS AND CONDIMENTS MARKET, BY REGION, 2018-2033 (USD MILLION)
TABLE 12 NORTH AMERICA SAUCES IN SAUCES, DRESSINGS AND CONDIMENTS MARKET, BY REGION, 2018-2033 (KILO TONS)
TABLE 13 NORTH AMERICA CONDIMENTS IN SAUCES, DRESSINGS AND CONDIMENTS MARKET, BY TYPE, 2018-2033 (USD MILLION)
TABLE 14 NORTH AMERICA AROMATIC IN SAUCES, DRESSINGS AND CONDIMENTS MARKET, BY TYPE, 2018-2033 (USD MILLION)
TABLE 15 NORTH AMERICA ACID IN SAUCES, DRESSINGS AND CONDIMENTS MARKET, BY TYPE, 2018-2033 (USD MILLION)
TABLE 16 NORTH AMERICA ACRID OR PEPPERY IN SAUCES, DRESSINGS AND CONDIMENTS MARKET, BY TYPE, 2018-2033 (USD MILLION)
TABLE 17 NORTH AMERICA ALLYLIC OR ALLIACEOUS IN SAUCES, DRESSINGS AND CONDIMENTS MARKET, BY TYPE, 2018-2033 (USD MILLION)
TABLE 18 NORTH AMERICA ANIMAL IN SAUCES, DRESSINGS AND CONDIMENTS MARKET, BY TYPE, 2018-2033 (USD MILLION)
TABLE 19 NORTH AMERICA CONDIMENTS IN SAUCES, DRESSINGS AND CONDIMENTS MARKET, BY REGION, 2018-2033 (USD MILLION)
TABLE 20 NORTH AMERICA CONDIMENTS IN SAUCES, DRESSINGS AND CONDIMENTS MARKET, BY REGION, 2018-2033 (KILO TONS)
TABLE 21 NORTH AMERICA DRESSINGS IN SAUCES, DRESSINGS AND CONDIMENTS MARKET, BY TYPE, 2018-2033 (USD MILLION)
TABLE 22 NORTH AMERICA DRESSINGS IN SAUCES, DRESSINGS AND CONDIMENTS MARKET, BY REGION, 2018-2033 (USD MILLION)
TABLE 23 NORTH AMERICA DRESSINGS IN SAUCES, DRESSINGS AND CONDIMENTS MARKET, BY REGION, 2018-2033 (KILO TONS)
TABLE 24 NORTH AMERICA SAUCES, DRESSINGS AND CONDIMENTS MARKET, BY INGREDIENTS, 2018-2033 (USD MILLION)
TABLE 25 NORTH AMERICA VEGETABLE IN SAUCES, DRESSINGS AND CONDIMENTS MARKET, BY TYPE, 2018-2033 (USD MILLION)
TABLE 26 NORTH AMERICA VEGETABLE IN SAUCES, DRESSINGS AND CONDIMENTS MARKET, BY REGION, 2018-2033 (USD MILLION)
TABLE 27 NORTH AMERICA FRUITS IN SAUCES, DRESSINGS AND CONDIMENTS MARKET, BY TYPE, 2018-2033 (USD MILLION)
TABLE 28 NORTH AMERICA CITRUS FRUITS IN SAUCES, DRESSINGS AND CONDIMENTS MARKET, BY TYPE, 2018-2033 (USD MILLION)
TABLE 29 NORTH AMERICA TROPICAL FRUITS IN SAUCES, DRESSINGS AND CONDIMENTS MARKET, BY TYPE, 2018-2033 (USD MILLION)
TABLE 30 NORTH AMERICA STONE FRUITS IN SAUCES, DRESSINGS AND CONDIMENTS MARKET, BY TYPE, 2018-2033 (USD MILLION)
TABLE 31 NORTH AMERICA BERRIES IN SAUCES, DRESSINGS AND CONDIMENTS MARKET, BY TYPE, 2018-2033 (USD MILLION)
TABLE 32 NORTH AMERICA FRUITS IN SAUCES, DRESSINGS AND CONDIMENTS MARKET, BY REGION, 2018-2033 (USD MILLION)
TABLE 33 NORTH AMERICA SPICES IN SAUCES, DRESSINGS AND CONDIMENTS MARKET, BY TYPE, 2018-2033 (USD MILLION)
TABLE 34 NORTH AMERICA SPICES IN SAUCES, DRESSINGS AND CONDIMENTS MARKET, BY REGION, 2018-2033 (USD MILLION)
TABLE 35 NORTH AMERICA FOOD ADDITIVES IN SAUCES, DRESSINGS AND CONDIMENTS MARKET, BY REGION, 2018-2033 (USD MILLION)
TABLE 36 NORTH AMERICA HERBS IN SAUCES, DRESSINGS AND CONDIMENTS MARKET, BY REGION, 2018-2033 (USD MILLION)
TABLE 37 NORTH AMERICA OTHERS IN SAUCES, DRESSINGS AND CONDIMENTS MARKET, BY REGION, 2018-2033 (USD MILLION)
TABLE 38 NORTH AMERICA SAUCES, DRESSINGS AND CONDIMENTS MARKET, BY PACKAGING TYPE , 2018-2033 (USD MILLION)
TABLE 39 NORTH AMERICA BOTTLES IN SAUCES, DRESSINGS AND CONDIMENTS MARKET, BY REGION, 2018-2033 (USD MILLION)
TABLE 40 NORTH AMERICA POUCH IN SAUCES, DRESSINGS AND CONDIMENTS MARKET, BY TYPE, 2018-2033 (USD MILLION)
TABLE 41 NORTH AMERICA STAND-UP POUCHES IN SAUCES, DRESSINGS AND CONDIMENTS MARKET, BY TYPE, 2018-2033 (USD MILLION)
TABLE 42 NORTH AMERICA POUCH IN SAUCES, DRESSINGS AND CONDIMENTS MARKET, BY REGION, 2018-2033 (USD MILLION)
TABLE 43 NORTH AMERICA SACHETS IN SAUCES, DRESSINGS AND CONDIMENTS MARKET, BY TYPE, 2018-2033 (USD MILLION)
TABLE 44 NORTH AMERICA FLAT SACHETS IN SAUCES, DRESSINGS AND CONDIMENTS MARKET, BY TYPE, 2018-2033 (USD MILLION)
TABLE 45 NORTH AMERICA SEALED IN SAUCES, DRESSINGS AND CONDIMENTS MARKET, BY TYPE, 2018-2033 (USD MILLION)
TABLE 46 NORTH AMERICA FLAT IN SAUCES, DRESSINGS AND CONDIMENTS MARKET, BY TYPE, 2018-2033 (USD MILLION)
TABLE 47 NORTH AMERICA SACHETS IN SAUCES, DRESSINGS AND CONDIMENTS MARKET, BY REGION, 2018-2033 (USD MILLION)
TABLE 48 NORTH AMERICA CONTAINERS IN SAUCES, DRESSINGS AND CONDIMENTS MARKET, BY REGION, 2018-2033 (USD MILLION)
TABLE 49 NORTH AMERICA CANS IN SAUCES, DRESSINGS AND CONDIMENTS MARKET, BY REGION, 2018-2033 (USD MILLION)
TABLE 50 NORTH AMERICA BOXES IN SAUCES, DRESSINGS AND CONDIMENTS MARKET, BY REGION, 2018-2033 (USD MILLION)
TABLE 51 NORTH AMERICA CUPS IN SAUCES, DRESSINGS AND CONDIMENTS MARKET, BY REGION, 2018-2033 (USD MILLION)
TABLE 52 NORTH AMERICA BAG IN BOX IN SAUCES, DRESSINGS AND CONDIMENTS MARKET, BY REGION, 2018-2033 (USD MILLION)
TABLE 53 NORTH AMERICA PACKS IN SAUCES, DRESSINGS AND CONDIMENTS MARKET, BY TYPE, 2018-2033 (USD MILLION)
TABLE 54 NORTH AMERICA PACKS IN SAUCES, DRESSINGS AND CONDIMENTS MARKET, BY REGION, 2018-2033 (USD MILLION)
TABLE 55 NORTH AMERICA OTHERS IN SAUCES, DRESSINGS AND CONDIMENTS MARKET, BY REGION, 2018-2033 (USD MILLION)
TABLE 56 NORTH AMERICA SAUCES, DRESSINGS AND CONDIMENTS MARKET, BY PACKAGING MATERIAL, 2018-2033 (USD MILLION)
TABLE 57 NORTH AMERICA PLASTIC IN SAUCES, DRESSINGS AND CONDIMENTS MARKET, BY PACKAGING MATERIAL, 2018-2033 (USD MILLION)
TABLE 58 NORTH AMERICA POLYETHYLENE (PE) IN SAUCES, DRESSINGS AND CONDIMENTS MARKET, BY PACKAGING MATERIAL, 2018-2033 (USD MILLION)
TABLE 59 NORTH AMERICA PLASTIC IN SAUCES, DRESSINGS AND CONDIMENTS MARKET, BY REGION, 2018-2033 (USD MILLION)
TABLE 60 NORTH AMERICA GLASS IN SAUCES, DRESSINGS AND CONDIMENTS MARKET, BY REGION, 2018-2033 (USD MILLION)
TABLE 61 NORTH AMERICA PAPER AND PAPERBOARD IN SAUCES, DRESSINGS AND CONDIMENTS MARKET, BY PACKAGING MATERIAL, 2018-2033 (USD MILLION)
TABLE 62 NORTH AMERICA PAPER AND PAPERBOARD IN SAUCES, DRESSINGS AND CONDIMENTS MARKET, BY REGION, 2018-2033 (USD MILLION)
TABLE 63 NORTH AMERICA METAL IN SAUCES, DRESSINGS AND CONDIMENTS MARKET, BY PACKAGING MATERIAL, 2018-2033 (USD MILLION)
TABLE 64 NORTH AMERICA METAL IN SAUCES, DRESSINGS AND CONDIMENTS MARKET, BY REGION, 2018-2033 (USD MILLION)
TABLE 65 NORTH AMERICA OTHERS IN SAUCES, DRESSINGS AND CONDIMENTS MARKET, BY REGION, 2018-2033 (USD MILLION)
TABLE 66 NORTH AMERICA SAUCES, DRESSINGS AND CONDIMENTS MARKET, BY PACKAGING SIZE, 2018-2033 (USD MILLION)
TABLE 67 NORTH AMERICA 250 ML – 500 ML IN SAUCES, DRESSINGS AND CONDIMENTS MARKET, BY REGION, 2018-2033 (USD MILLION)
TABLE 68 NORTH AMERICA 50 ML – 250 ML IN SAUCES, DRESSINGS AND CONDIMENTS MARKET, BY REGION, 2018-2033 (USD MILLION)
TABLE 69 NORTH AMERICA 500 ML – 1L IN SAUCES, DRESSINGS AND CONDIMENTS MARKET, BY REGION, 2018-2033 (USD MILLION)
TABLE 70 NORTH AMERICA 1L – 5L IN SAUCES, DRESSINGS AND CONDIMENTS MARKET, BY REGION, 2018-2033 (USD MILLION)
TABLE 71 NORTH AMERICA LESS THAN 50 ML IN SAUCES, DRESSINGS AND CONDIMENTS MARKET, BY REGION, 2018-2033 (USD MILLION)
TABLE 72 NORTH AMERICA MORE THAN 5L IN SAUCES, DRESSINGS AND CONDIMENTS MARKET, BY REGION, 2018-2033 (USD MILLION)
TABLE 73 NORTH AMERICA SAUCES, DRESSINGS AND CONDIMENTS MARKET, BY END USER, 2018-2033 (USD MILLION)
TABLE 74 NORTH AMERICA RETAIL FOOD IN SAUCES, DRESSINGS AND CONDIMENTS MARKET, BY REGION, 2018-2033 (USD MILLION)
TABLE 75 NORTH AMERICA FOOD SERVICES IN SAUCES, DRESSINGS AND CONDIMENTS MARKET, BY TYPE, 2018-2033 (USD MILLION)
TABLE 76 NORTH AMERICA QUICK SERVICE RESTAURANTS IN SAUCES, DRESSINGS AND CONDIMENTS MARKET, BY TYPE, 2018-2033 (USD MILLION)
TABLE 77 NORTH AMERICA FOOD SERVICES IN SAUCES, DRESSINGS AND CONDIMENTS MARKET, BY REGION, 2018-2033 (USD MILLION)
TABLE 78 NORTH AMERICA FOOD PROCESSORS IN SAUCES, DRESSINGS AND CONDIMENTS MARKET, BY REGION, 2018-2033 (USD MILLION)
TABLE 79 NORTH AMERICA OTHERS IN SAUCES, DRESSINGS AND CONDIMENTS MARKET, BY REGION, 2018-2033 (USD MILLION)
TABLE 80 NORTH AMERICA SAUCES, DRESSINGS AND CONDIMENTS MARKET, BY DISTRIBUTION CHANNEL, 2018-2033 (USD MILLION)
TABLE 81 NORTH AMERICA OFFLINE-TRADE IN SAUCES, DRESSINGS AND CONDIMENTS MARKET, BY TYPE, 2018-2033 (USD MILLION)
TABLE 82 NORTH AMERICA STORE-BASED RETAILERS IN SAUCES, DRESSINGS AND CONDIMENTS MARKET, BY TYPE, 2018-2033 (USD MILLION)
TABLE 83 NORTH AMERICA NON-STORE BASED IN SAUCES, DRESSINGS AND CONDIMENTS MARKET, BY TYPE, 2018-2033 (USD MILLION)
TABLE 84 NORTH AMERICA OFFLINE TRADE IN SAUCES, DRESSINGS AND CONDIMENTS MARKET, BY REGION, 2018-2033 (USD MILLION)
TABLE 85 NORTH AMERICA ONLINE TRADE IN SAUCES, DRESSINGS AND CONDIMENTS MARKET, BY TYPE, 2018-2033 (USD MILLION)
TABLE 86 NORTH AMERICA ONLINE TRADE IN SAUCES, DRESSINGS AND CONDIMENTS MARKET, BY REGION, 2018-2033 (USD MILLION)
TABLE 87 NORTH AMERICA SAUCES, DRESSINGS AND CONDIMENTS MARKET, BY COUNTRY, 2018-2033 (USD MILLION)
TABLE 88 NORTH AMERICA SAUCES, DRESSINGS AND CONDIMENTS MARKET, BY COUNTRY, 2018-2033 (KILO TONS)
TABLE 89 USD MILLION
TABLE 90 NORTH AMERICA SAUCES, DRESSINGS AND CONDIMENTS MARKET, BY TYPE, 2018-2033 (USD MILLION)
TABLE 91 NORTH AMERICA SAUCES, DRESSINGS AND CONDIMENTS MARKET, BY TYPE, 2018-2033 (KILO TONS)
TABLE 92 NORTH AMERICA SAUCES IN SAUCES, DRESSINGS AND CONDIMENTS MARKET, BY TYPE, 2018-2033 (USD MILLION)
TABLE 93 NORTH AMERICA TOMATO-BASED SAUCES IN SAUCES, DRESSINGS AND CONDIMENTS MARKET, BY TYPE, 2018-2033 (USD MILLION)
TABLE 94 NORTH AMERICA SOY-BASED SAUCESIN SAUCES, DRESSINGS AND CONDIMENTS MARKET, BY TYPE, 2018-2033 (USD MILLION)
TABLE 95 NORTH AMERICA SOY SAUCE IN SAUCES, DRESSINGS AND CONDIMENTS MARKET, BY TYPE, 2018-2033 (USD MILLION)
TABLE 96 NORTH AMERICA CHILI-BASED SAUCES IN SAUCES, DRESSINGS AND CONDIMENTS MARKET, BY TYPE, 2018-2033 (USD MILLION)
TABLE 97 NORTH AMERICA VINEGAR AND MUSTARD-BASED SAUCES IN SAUCES, DRESSINGS AND CONDIMENTS MARKET, BY TYPE, 2018-2033 (USD MILLION)
TABLE 98 NORTH AMERICA OIL-BASED SAUCES IN SAUCES, DRESSINGS AND CONDIMENTS MARKET, BY TYPE, 2018-2033 (USD MILLION)
TABLE 99 NORTH AMERICA DAIRY-BASED SAUCES IN SAUCES, DRESSINGS AND CONDIMENTS MARKET, BY TYPE, 2018-2033 (USD MILLION)
TABLE 100 NORTH AMERICA CONDIMENTS IN SAUCES, DRESSINGS AND CONDIMENTS MARKET, BY TYPE, 2018-2033 (USD MILLION)
TABLE 101 NORTH AMERICA AROMATIC IN SAUCES, DRESSINGS AND CONDIMENTS MARKET, BY TYPE, 2018-2033 (USD MILLION)
TABLE 102 NORTH AMERICA ACID IN SAUCES, DRESSINGS AND CONDIMENTS MARKET, BY TYPE, 2018-2033 (USD MILLION)
TABLE 103 NORTH AMERICA ACRID OR PEPPERY IN SAUCES, DRESSINGS AND CONDIMENTS MARKET, BY TYPE, 2018-2033 (USD MILLION)
TABLE 104 NORTH AMERICA ALLYLIC OR ALLIACEOUS IN SAUCES, DRESSINGS AND CONDIMENTS MARKET, BY TYPE, 2018-2033 (USD MILLION)
TABLE 105 NORTH AMERICA ANIMAL IN SAUCES, DRESSINGS AND CONDIMENTS MARKET, BY TYPE, 2018-2033 (USD MILLION)
TABLE 106 NORTH AMERICA DRESSINGS IN SAUCES, DRESSINGS AND CONDIMENTS MARKET, BY TYPE, 2018-2033 (USD MILLION)
TABLE 107 NORTH AMERICA SAUCES, DRESSINGS AND CONDIMENTS MARKET, BY INGREDIENTS, 2018-2033 (USD MILLION)
TABLE 108 NORTH AMERICA VEGETABLE IN SAUCES, DRESSINGS AND CONDIMENTS MARKET, BY TYPE, 2018-2033 (USD MILLION)
TABLE 109 NORTH AMERICA FRUITS IN SAUCES, DRESSINGS AND CONDIMENTS MARKET, BY TYPE, 2018-2033 (USD MILLION)
TABLE 110 NORTH AMERICA CITRUS FRUITS IN SAUCES, DRESSINGS AND CONDIMENTS MARKET, BY TYPE, 2018-2033 (USD MILLION)
TABLE 111 NORTH AMERICA TROPICAL FRUITS IN SAUCES, DRESSINGS AND CONDIMENTS MARKET, BY TYPE, 2018-2033 (USD MILLION)
TABLE 112 NORTH AMERICA STONE FRUITS IN SAUCES, DRESSINGS AND CONDIMENTS MARKET, BY TYPE, 2018-2033 (USD MILLION)
TABLE 113 NORTH AMERICA BERRIES IN SAUCES, DRESSINGS AND CONDIMENTS MARKET, BY TYPE, 2018-2033 (USD MILLION)
TABLE 114 NORTH AMERICA SPICES IN SAUCES, DRESSINGS AND CONDIMENTS MARKET, BY TYPE, 2018-2033 (USD MILLION)
TABLE 115 NORTH AMERICA SAUCES, DRESSINGS AND CONDIMENTS MARKET, BY PACKAGING TYPE , 2018-2033 (USD MILLION)
TABLE 116 NORTH AMERICA POUCH IN SAUCES, DRESSINGS AND CONDIMENTS MARKET, BY TYPE, 2018-2033 (USD MILLION)
TABLE 117 NORTH AMERICA STAND-UP POUCHES IN SAUCES, DRESSINGS AND CONDIMENTS MARKET, BY TYPE, 2018-2033 (USD MILLION)
TABLE 118 NORTH AMERICA SACHETS IN SAUCES, DRESSINGS AND CONDIMENTS MARKET, BY TYPE, 2018-2033 (USD MILLION)
TABLE 119 NORTH AMERICA FLAT SACHETS IN SAUCES, DRESSINGS AND CONDIMENTS MARKET, BY TYPE, 2018-2033 (USD MILLION)
TABLE 120 NORTH AMERICA SEALED IN SAUCES, DRESSINGS AND CONDIMENTS MARKET, BY TYPE, 2018-2033 (USD MILLION)
TABLE 121 NORTH AMERICA FLAT IN SAUCES, DRESSINGS AND CONDIMENTS MARKET, BY TYPE, 2018-2033 (USD MILLION)
TABLE 122 NORTH AMERICA PACKS IN SAUCES, DRESSINGS AND CONDIMENTS MARKET, BY TYPE, 2018-2033 (USD MILLION)
TABLE 123 NORTH AMERICA SAUCES, DRESSINGS AND CONDIMENTS MARKET, BY PACKAGING MATERIAL, 2018-2033 (USD MILLION)
TABLE 124 NORTH AMERICA PLASTIC IN SAUCES, DRESSINGS AND CONDIMENTS MARKET, BY PACKAGING MATERIAL, 2018-2033 (USD MILLION)
TABLE 125 NORTH AMERICA POLYETHYLENE (PE) IN SAUCES, DRESSINGS AND CONDIMENTS MARKET, BY PACKAGING MATERIAL, 2018-2033 (USD MILLION)
TABLE 126 NORTH AMERICA PAPER AND PAPERBOARD IN SAUCES, DRESSINGS AND CONDIMENTS MARKET, BY PACKAGING MATERIAL, 2018-2033 (USD MILLION)
TABLE 127 NORTH AMERICA METAL IN SAUCES, DRESSINGS AND CONDIMENTS MARKET, BY PACKAGING MATERIAL, 2018-2033 (USD MILLION)
TABLE 128 NORTH AMERICA SAUCES, DRESSINGS AND CONDIMENTS MARKET, BY PACKAGING SIZE, 2018-2033 (USD MILLION)
TABLE 129 NORTH AMERICA SAUCES, DRESSINGS AND CONDIMENTS MARKET, BY END USER, 2018-2033 (USD MILLION)
TABLE 130 NORTH AMERICA FOOD SERVICES IN SAUCES, DRESSINGS AND CONDIMENTS MARKET, BY TYPE, 2018-2033 (USD MILLION)
TABLE 131 NORTH AMERICA QUICK SERVICE RESTAURANTS IN SAUCES, DRESSINGS AND CONDIMENTS MARKET, BY TYPE, 2018-2033 (USD MILLION)
TABLE 132 NORTH AMERICA SAUCES, DRESSINGS AND CONDIMENTS MARKET, BY DISTRIBUTION CHANNEL, 2018-2033 (USD MILLION)
TABLE 133 NORTH AMERICA OFFLINE-TRADE IN SAUCES, DRESSINGS AND CONDIMENTS MARKET, BY TYPE, 2018-2033 (USD MILLION)
TABLE 134 NORTH AMERICA STORE-BASED RETAILERS IN SAUCES, DRESSINGS AND CONDIMENTS MARKET, BY TYPE, 2018-2033 (USD MILLION)
TABLE 135 NORTH AMERICA NON-STORE BASED IN SAUCES, DRESSINGS AND CONDIMENTS MARKET, BY TYPE, 2018-2033 (USD MILLION)
TABLE 136 NORTH AMERICA ONLINE TRADE IN SAUCES, DRESSINGS AND CONDIMENTS MARKET, BY TYPE, 2018-2033 (USD MILLION)
TABLE 137 USD MILLION
TABLE 138 U.S. SAUCES, DRESSINGS AND CONDIMENTS MARKET, BY TYPE, 2018-2033 (USD MILLION)
TABLE 139 U.S. SAUCES, DRESSINGS AND CONDIMENTS MARKET, BY TYPE, 2018-2033 (KILO TONS)
TABLE 140 U.S. SAUCES IN SAUCES, DRESSINGS AND CONDIMENTS MARKET, BY TYPE, 2018-2033 (USD MILLION)
TABLE 141 U.S. TOMATO-BASED SAUCES IN SAUCES, DRESSINGS AND CONDIMENTS MARKET, BY TYPE, 2018-2033 (USD MILLION)
TABLE 142 U.S. SOY-BASED SAUCESIN SAUCES, DRESSINGS AND CONDIMENTS MARKET, BY TYPE, 2018-2033 (USD MILLION)
TABLE 143 U.S. SOY SAUCE IN SAUCES, DRESSINGS AND CONDIMENTS MARKET, BY TYPE, 2018-2033 (USD MILLION)
TABLE 144 U.S. CHILI-BASED SAUCES IN SAUCES, DRESSINGS AND CONDIMENTS MARKET, BY TYPE, 2018-2033 (USD MILLION)
TABLE 145 U.S. VINEGAR AND MUSTARD-BASED SAUCES IN SAUCES, DRESSINGS AND CONDIMENTS MARKET, BY TYPE, 2018-2033 (USD MILLION)
TABLE 146 U.S. OIL-BASED SAUCES IN SAUCES, DRESSINGS AND CONDIMENTS MARKET, BY TYPE, 2018-2033 (USD MILLION)
TABLE 147 U.S. DAIRY-BASED SAUCES IN SAUCES, DRESSINGS AND CONDIMENTS MARKET, BY TYPE, 2018-2033 (USD MILLION)
TABLE 148 U.S. CONDIMENTS IN SAUCES, DRESSINGS AND CONDIMENTS MARKET, BY TYPE, 2018-2033 (USD MILLION)
TABLE 149 U.S. AROMATIC IN SAUCES, DRESSINGS AND CONDIMENTS MARKET, BY TYPE, 2018-2033 (USD MILLION)
TABLE 150 U.S. ACID IN SAUCES, DRESSINGS AND CONDIMENTS MARKET, BY TYPE, 2018-2033 (USD MILLION)
TABLE 151 U.S. ACRID OR PEPPERY IN SAUCES, DRESSINGS AND CONDIMENTS MARKET, BY TYPE, 2018-2033 (USD MILLION)
TABLE 152 U.S. ALLYLIC OR ALLIACEOUS IN SAUCES, DRESSINGS AND CONDIMENTS MARKET, BY TYPE, 2018-2033 (USD MILLION)
TABLE 153 U.S. ANIMAL IN SAUCES, DRESSINGS AND CONDIMENTS MARKET, BY TYPE, 2018-2033 (USD MILLION)
TABLE 154 U.S. DRESSINGS IN SAUCES, DRESSINGS AND CONDIMENTS MARKET, BY TYPE, 2018-2033 (USD MILLION)
TABLE 155 U.S. SAUCES, DRESSINGS AND CONDIMENTS MARKET, BY INGREDIENTS, 2018-2033 (USD MILLION)
TABLE 156 U.S. VEGETABLE IN SAUCES, DRESSINGS AND CONDIMENTS MARKET, BY TYPE, 2018-2033 (USD MILLION)
TABLE 157 U.S. FRUITS IN SAUCES, DRESSINGS AND CONDIMENTS MARKET, BY TYPE, 2018-2033 (USD MILLION)
TABLE 158 U.S. CITRUS FRUITS IN SAUCES, DRESSINGS AND CONDIMENTS MARKET, BY TYPE, 2018-2033 (USD MILLION)
TABLE 159 U.S. TROPICAL FRUITS IN SAUCES, DRESSINGS AND CONDIMENTS MARKET, BY TYPE, 2018-2033 (USD MILLION)
TABLE 160 U.S. STONE FRUITS IN SAUCES, DRESSINGS AND CONDIMENTS MARKET, BY TYPE, 2018-2033 (USD MILLION)
TABLE 161 U.S. BERRIES IN SAUCES, DRESSINGS AND CONDIMENTS MARKET, BY TYPE, 2018-2033 (USD MILLION)
TABLE 162 U.S. SPICES IN SAUCES, DRESSINGS AND CONDIMENTS MARKET, BY TYPE, 2018-2033 (USD MILLION)
TABLE 163 U.S. SAUCES, DRESSINGS AND CONDIMENTS MARKET, BY PACKAGING TYPE , 2018-2033 (USD MILLION)
TABLE 164 U.S. POUCH IN SAUCES, DRESSINGS AND CONDIMENTS MARKET, BY TYPE, 2018-2033 (USD MILLION)
TABLE 165 U.S. STAND-UP POUCHES IN SAUCES, DRESSINGS AND CONDIMENTS MARKET, BY TYPE, 2018-2033 (USD MILLION)
TABLE 166 U.S. SACHETS IN SAUCES, DRESSINGS AND CONDIMENTS MARKET, BY TYPE, 2018-2033 (USD MILLION)
TABLE 167 U.S. FLAT SACHETS IN SAUCES, DRESSINGS AND CONDIMENTS MARKET, BY TYPE, 2018-2033 (USD MILLION)
TABLE 168 U.S. SEALED IN SAUCES, DRESSINGS AND CONDIMENTS MARKET, BY TYPE, 2018-2033 (USD MILLION)
TABLE 169 U.S. FLAT IN SAUCES, DRESSINGS AND CONDIMENTS MARKET, BY TYPE, 2018-2033 (USD MILLION)
TABLE 170 U.S. PACKS IN SAUCES, DRESSINGS AND CONDIMENTS MARKET, BY TYPE, 2018-2033 (USD MILLION)
TABLE 171 U.S. SAUCES, DRESSINGS AND CONDIMENTS MARKET, BY PACKAGING MATERIAL, 2018-2033 (USD MILLION)
TABLE 172 U.S. PLASTIC IN SAUCES, DRESSINGS AND CONDIMENTS MARKET, BY PACKAGING MATERIAL, 2018-2033 (USD MILLION)
TABLE 173 U.S. POLYETHYLENE (PE) IN SAUCES, DRESSINGS AND CONDIMENTS MARKET, BY PACKAGING MATERIAL, 2018-2033 (USD MILLION)
TABLE 174 U.S. PAPER AND PAPERBOARD IN SAUCES, DRESSINGS AND CONDIMENTS MARKET, BY PACKAGING MATERIAL, 2018-2033 (USD MILLION)
TABLE 175 U.S. METAL IN SAUCES, DRESSINGS AND CONDIMENTS MARKET, BY PACKAGING MATERIAL, 2018-2033 (USD MILLION)
TABLE 176 U.S. SAUCES, DRESSINGS AND CONDIMENTS MARKET, BY PACKAGING SIZE, 2018-2033 (USD MILLION)
TABLE 177 U.S. SAUCES, DRESSINGS AND CONDIMENTS MARKET, BY END USER, 2018-2033 (USD MILLION)
TABLE 178 U.S. FOOD SERVICES IN SAUCES, DRESSINGS AND CONDIMENTS MARKET, BY TYPE, 2018-2033 (USD MILLION)
TABLE 179 U.S. QUICK SERVICE RESTAURANTS IN SAUCES, DRESSINGS AND CONDIMENTS MARKET, BY TYPE, 2018-2033 (USD MILLION)
TABLE 180 U.S. SAUCES, DRESSINGS AND CONDIMENTS MARKET, BY DISTRIBUTION CHANNEL, 2018-2033 (USD MILLION)
TABLE 181 U.S. OFFLINE-TRADE IN SAUCES, DRESSINGS AND CONDIMENTS MARKET, BY TYPE, 2018-2033 (USD MILLION)
TABLE 182 U.S. STORE-BASED RETAILERS IN SAUCES, DRESSINGS AND CONDIMENTS MARKET, BY TYPE, 2018-2033 (USD MILLION)
TABLE 183 U.S. NON-STORE BASED IN SAUCES, DRESSINGS AND CONDIMENTS MARKET, BY TYPE, 2018-2033 (USD MILLION)
TABLE 184 U.S. ONLINE TRADE IN SAUCES, DRESSINGS AND CONDIMENTS MARKET, BY TYPE, 2018-2033 (USD MILLION)
TABLE 185 USD MILLION
TABLE 186 CANADA SAUCES, DRESSINGS AND CONDIMENTS MARKET, BY TYPE, 2018-2033 (USD MILLION)
TABLE 187 CANADA SAUCES, DRESSINGS AND CONDIMENTS MARKET, BY TYPE, 2018-2033 (KILO TONS)
TABLE 188 CANADA SAUCES IN SAUCES, DRESSINGS AND CONDIMENTS MARKET, BY TYPE, 2018-2033 (USD MILLION)
TABLE 189 CANADA TOMATO-BASED SAUCES IN SAUCES, DRESSINGS AND CONDIMENTS MARKET, BY TYPE, 2018-2033 (USD MILLION)
TABLE 190 CANADA SOY-BASED SAUCESIN SAUCES, DRESSINGS AND CONDIMENTS MARKET, BY TYPE, 2018-2033 (USD MILLION)
TABLE 191 CANADA SOY SAUCE IN SAUCES, DRESSINGS AND CONDIMENTS MARKET, BY TYPE, 2018-2033 (USD MILLION)
TABLE 192 CANADA CHILI-BASED SAUCES IN SAUCES, DRESSINGS AND CONDIMENTS MARKET, BY TYPE, 2018-2033 (USD MILLION)
TABLE 193 CANADA VINEGAR AND MUSTARD-BASED SAUCES IN SAUCES, DRESSINGS AND CONDIMENTS MARKET, BY TYPE, 2018-2033 (USD MILLION)
TABLE 194 CANADA OIL-BASED SAUCES IN SAUCES, DRESSINGS AND CONDIMENTS MARKET, BY TYPE, 2018-2033 (USD MILLION)
TABLE 195 CANADA DAIRY-BASED SAUCES IN SAUCES, DRESSINGS AND CONDIMENTS MARKET, BY TYPE, 2018-2033 (USD MILLION)
TABLE 196 CANADA CONDIMENTS IN SAUCES, DRESSINGS AND CONDIMENTS MARKET, BY TYPE, 2018-2033 (USD MILLION)
TABLE 197 CANADA AROMATIC IN SAUCES, DRESSINGS AND CONDIMENTS MARKET, BY TYPE, 2018-2033 (USD MILLION)
TABLE 198 CANADA ACID IN SAUCES, DRESSINGS AND CONDIMENTS MARKET, BY TYPE, 2018-2033 (USD MILLION)
TABLE 199 CANADA ACRID OR PEPPERY IN SAUCES, DRESSINGS AND CONDIMENTS MARKET, BY TYPE, 2018-2033 (USD MILLION)
TABLE 200 CANADA ALLYLIC OR ALLIACEOUS IN SAUCES, DRESSINGS AND CONDIMENTS MARKET, BY TYPE, 2018-2033 (USD MILLION)
TABLE 201 CANADA ANIMAL IN SAUCES, DRESSINGS AND CONDIMENTS MARKET, BY TYPE, 2018-2033 (USD MILLION)
TABLE 202 CANADA DRESSINGS IN SAUCES, DRESSINGS AND CONDIMENTS MARKET, BY TYPE, 2018-2033 (USD MILLION)
TABLE 203 CANADA SAUCES, DRESSINGS AND CONDIMENTS MARKET, BY INGREDIENTS, 2018-2033 (USD MILLION)
TABLE 204 CANADA VEGETABLE IN SAUCES, DRESSINGS AND CONDIMENTS MARKET, BY TYPE, 2018-2033 (USD MILLION)
TABLE 205 CANADA FRUITS IN SAUCES, DRESSINGS AND CONDIMENTS MARKET, BY TYPE, 2018-2033 (USD MILLION)
TABLE 206 CANADA CITRUS FRUITS IN SAUCES, DRESSINGS AND CONDIMENTS MARKET, BY TYPE, 2018-2033 (USD MILLION)
TABLE 207 CANADA TROPICAL FRUITS IN SAUCES, DRESSINGS AND CONDIMENTS MARKET, BY TYPE, 2018-2033 (USD MILLION)
TABLE 208 CANADA STONE FRUITS IN SAUCES, DRESSINGS AND CONDIMENTS MARKET, BY TYPE, 2018-2033 (USD MILLION)
TABLE 209 CANADA BERRIES IN SAUCES, DRESSINGS AND CONDIMENTS MARKET, BY TYPE, 2018-2033 (USD MILLION)
TABLE 210 CANADA SPICES IN SAUCES, DRESSINGS AND CONDIMENTS MARKET, BY TYPE, 2018-2033 (USD MILLION)
TABLE 211 CANADA SAUCES, DRESSINGS AND CONDIMENTS MARKET, BY PACKAGING TYPE , 2018-2033 (USD MILLION)
TABLE 212 CANADA POUCH IN SAUCES, DRESSINGS AND CONDIMENTS MARKET, BY TYPE, 2018-2033 (USD MILLION)
TABLE 213 CANADA STAND-UP POUCHES IN SAUCES, DRESSINGS AND CONDIMENTS MARKET, BY TYPE, 2018-2033 (USD MILLION)
TABLE 214 CANADA SACHETS IN SAUCES, DRESSINGS AND CONDIMENTS MARKET, BY TYPE, 2018-2033 (USD MILLION)
TABLE 215 CANADA FLAT SACHETS IN SAUCES, DRESSINGS AND CONDIMENTS MARKET, BY TYPE, 2018-2033 (USD MILLION)
TABLE 216 CANADA SEALED IN SAUCES, DRESSINGS AND CONDIMENTS MARKET, BY TYPE, 2018-2033 (USD MILLION)
TABLE 217 CANADA FLAT IN SAUCES, DRESSINGS AND CONDIMENTS MARKET, BY TYPE, 2018-2033 (USD MILLION)
TABLE 218 CANADA PACKS IN SAUCES, DRESSINGS AND CONDIMENTS MARKET, BY TYPE, 2018-2033 (USD MILLION)
TABLE 219 CANADA SAUCES, DRESSINGS AND CONDIMENTS MARKET, BY PACKAGING MATERIAL, 2018-2033 (USD MILLION)
TABLE 220 CANADA PLASTIC IN SAUCES, DRESSINGS AND CONDIMENTS MARKET, BY PACKAGING MATERIAL, 2018-2033 (USD MILLION)
TABLE 221 CANADA POLYETHYLENE (PE) IN SAUCES, DRESSINGS AND CONDIMENTS MARKET, BY PACKAGING MATERIAL, 2018-2033 (USD MILLION)
TABLE 222 CANADA PAPER AND PAPERBOARD IN SAUCES, DRESSINGS AND CONDIMENTS MARKET, BY PACKAGING MATERIAL, 2018-2033 (USD MILLION)
TABLE 223 CANADA METAL IN SAUCES, DRESSINGS AND CONDIMENTS MARKET, BY PACKAGING MATERIAL, 2018-2033 (USD MILLION)
TABLE 224 CANADA SAUCES, DRESSINGS AND CONDIMENTS MARKET, BY PACKAGING SIZE, 2018-2033 (USD MILLION)
TABLE 225 CANADA SAUCES, DRESSINGS AND CONDIMENTS MARKET, BY END USER, 2018-2033 (USD MILLION)
TABLE 226 CANADA FOOD SERVICES IN SAUCES, DRESSINGS AND CONDIMENTS MARKET, BY TYPE, 2018-2033 (USD MILLION)
TABLE 227 CANADA QUICK SERVICE RESTAURANTS IN SAUCES, DRESSINGS AND CONDIMENTS MARKET, BY TYPE, 2018-2033 (USD MILLION)
TABLE 228 CANADA SAUCES, DRESSINGS AND CONDIMENTS MARKET, BY DISTRIBUTION CHANNEL, 2018-2033 (USD MILLION)
TABLE 229 CANADA OFFLINE-TRADE IN SAUCES, DRESSINGS AND CONDIMENTS MARKET, BY TYPE, 2018-2033 (USD MILLION)
TABLE 230 CANADA STORE-BASED RETAILERS IN SAUCES, DRESSINGS AND CONDIMENTS MARKET, BY TYPE, 2018-2033 (USD MILLION)
TABLE 231 CANADA NON-STORE BASED IN SAUCES, DRESSINGS AND CONDIMENTS MARKET, BY TYPE, 2018-2033 (USD MILLION)
TABLE 232 CANADA ONLINE TRADE IN SAUCES, DRESSINGS AND CONDIMENTS MARKET, BY TYPE, 2018-2033 (USD MILLION)
TABLE 233 USD MILLION
TABLE 234 MEXICO SAUCES, DRESSINGS AND CONDIMENTS MARKET, BY TYPE, 2018-2033 (USD MILLION)
TABLE 235 MEXICO SAUCES, DRESSINGS AND CONDIMENTS MARKET, BY TYPE, 2018-2033 (KILO TONS)
TABLE 236 MEXICO SAUCES IN SAUCES, DRESSINGS AND CONDIMENTS MARKET, BY TYPE, 2018-2033 (USD MILLION)
TABLE 237 MEXICO TOMATO-BASED SAUCES IN SAUCES, DRESSINGS AND CONDIMENTS MARKET, BY TYPE, 2018-2033 (USD MILLION)
TABLE 238 MEXICO SOY-BASED SAUCESIN SAUCES, DRESSINGS AND CONDIMENTS MARKET, BY TYPE, 2018-2033 (USD MILLION)
TABLE 239 MEXICO SOY SAUCE IN SAUCES, DRESSINGS AND CONDIMENTS MARKET, BY TYPE, 2018-2033 (USD MILLION)
TABLE 240 MEXICO CHILI-BASED SAUCES IN SAUCES, DRESSINGS AND CONDIMENTS MARKET, BY TYPE, 2018-2033 (USD MILLION)
TABLE 241 MEXICO VINEGAR AND MUSTARD-BASED SAUCES IN SAUCES, DRESSINGS AND CONDIMENTS MARKET, BY TYPE, 2018-2033 (USD MILLION)
TABLE 242 MEXICO OIL-BASED SAUCES IN SAUCES, DRESSINGS AND CONDIMENTS MARKET, BY TYPE, 2018-2033 (USD MILLION)
TABLE 243 MEXICO DAIRY-BASED SAUCES IN SAUCES, DRESSINGS AND CONDIMENTS MARKET, BY TYPE, 2018-2033 (USD MILLION)
TABLE 244 MEXICO CONDIMENTS IN SAUCES, DRESSINGS AND CONDIMENTS MARKET, BY TYPE, 2018-2033 (USD MILLION)
TABLE 245 MEXICO AROMATIC IN SAUCES, DRESSINGS AND CONDIMENTS MARKET, BY TYPE, 2018-2033 (USD MILLION)
TABLE 246 MEXICO ACID IN SAUCES, DRESSINGS AND CONDIMENTS MARKET, BY TYPE, 2018-2033 (USD MILLION)
TABLE 247 MEXICO ACRID OR PEPPERY IN SAUCES, DRESSINGS AND CONDIMENTS MARKET, BY TYPE, 2018-2033 (USD MILLION)
TABLE 248 MEXICO ALLYLIC OR ALLIACEOUS IN SAUCES, DRESSINGS AND CONDIMENTS MARKET, BY TYPE, 2018-2033 (USD MILLION)
TABLE 249 MEXICO ANIMAL IN SAUCES, DRESSINGS AND CONDIMENTS MARKET, BY TYPE, 2018-2033 (USD MILLION)
TABLE 250 MEXICO DRESSINGS IN SAUCES, DRESSINGS AND CONDIMENTS MARKET, BY TYPE, 2018-2033 (USD MILLION)
TABLE 251 MEXICO SAUCES, DRESSINGS AND CONDIMENTS MARKET, BY INGREDIENTS, 2018-2033 (USD MILLION)
TABLE 252 MEXICO VEGETABLE IN SAUCES, DRESSINGS AND CONDIMENTS MARKET, BY TYPE, 2018-2033 (USD MILLION)
TABLE 253 MEXICO FRUITS IN SAUCES, DRESSINGS AND CONDIMENTS MARKET, BY TYPE, 2018-2033 (USD MILLION)
TABLE 254 MEXICO CITRUS FRUITS IN SAUCES, DRESSINGS AND CONDIMENTS MARKET, BY TYPE, 2018-2033 (USD MILLION)
TABLE 255 MEXICO TROPICAL FRUITS IN SAUCES, DRESSINGS AND CONDIMENTS MARKET, BY TYPE, 2018-2033 (USD MILLION)
TABLE 256 MEXICO STONE FRUITS IN SAUCES, DRESSINGS AND CONDIMENTS MARKET, BY TYPE, 2018-2033 (USD MILLION)
TABLE 257 MEXICO BERRIES IN SAUCES, DRESSINGS AND CONDIMENTS MARKET, BY TYPE, 2018-2033 (USD MILLION)
TABLE 258 MEXICO SPICES IN SAUCES, DRESSINGS AND CONDIMENTS MARKET, BY TYPE, 2018-2033 (USD MILLION)
TABLE 259 MEXICO SAUCES, DRESSINGS AND CONDIMENTS MARKET, BY PACKAGING TYPE , 2018-2033 (USD MILLION)
TABLE 260 MEXICO POUCH IN SAUCES, DRESSINGS AND CONDIMENTS MARKET, BY TYPE, 2018-2033 (USD MILLION)
TABLE 261 MEXICO STAND-UP POUCHES IN SAUCES, DRESSINGS AND CONDIMENTS MARKET, BY TYPE, 2018-2033 (USD MILLION)
TABLE 262 MEXICO SACHETS IN SAUCES, DRESSINGS AND CONDIMENTS MARKET, BY TYPE, 2018-2033 (USD MILLION)
TABLE 263 MEXICO FLAT SACHETS IN SAUCES, DRESSINGS AND CONDIMENTS MARKET, BY TYPE, 2018-2033 (USD MILLION)
TABLE 264 MEXICO SEALED IN SAUCES, DRESSINGS AND CONDIMENTS MARKET, BY TYPE, 2018-2033 (USD MILLION)
TABLE 265 MEXICO FLAT IN SAUCES, DRESSINGS AND CONDIMENTS MARKET, BY TYPE, 2018-2033 (USD MILLION)
TABLE 266 MEXICO PACKS IN SAUCES, DRESSINGS AND CONDIMENTS MARKET, BY TYPE, 2018-2033 (USD MILLION)
TABLE 267 MEXICO SAUCES, DRESSINGS AND CONDIMENTS MARKET, BY PACKAGING MATERIAL, 2018-2033 (USD MILLION)
TABLE 268 MEXICO PLASTIC IN SAUCES, DRESSINGS AND CONDIMENTS MARKET, BY PACKAGING MATERIAL, 2018-2033 (USD MILLION)
TABLE 269 MEXICO POLYETHYLENE (PE) IN SAUCES, DRESSINGS AND CONDIMENTS MARKET, BY PACKAGING MATERIAL, 2018-2033 (USD MILLION)
TABLE 270 MEXICO PAPER AND PAPERBOARD IN SAUCES, DRESSINGS AND CONDIMENTS MARKET, BY PACKAGING MATERIAL, 2018-2033 (USD MILLION)
TABLE 271 MEXICO METAL IN SAUCES, DRESSINGS AND CONDIMENTS MARKET, BY PACKAGING MATERIAL, 2018-2033 (USD MILLION)
TABLE 272 MEXICO SAUCES, DRESSINGS AND CONDIMENTS MARKET, BY PACKAGING SIZE, 2018-2033 (USD MILLION)
TABLE 273 MEXICO SAUCES, DRESSINGS AND CONDIMENTS MARKET, BY END USER, 2018-2033 (USD MILLION)
TABLE 274 MEXICO FOOD SERVICES IN SAUCES, DRESSINGS AND CONDIMENTS MARKET, BY TYPE, 2018-2033 (USD MILLION)
TABLE 275 MEXICO QUICK SERVICE RESTAURANTS IN SAUCES, DRESSINGS AND CONDIMENTS MARKET, BY TYPE, 2018-2033 (USD MILLION)
TABLE 276 MEXICO SAUCES, DRESSINGS AND CONDIMENTS MARKET, BY DISTRIBUTION CHANNEL, 2018-2033 (USD MILLION)
TABLE 277 MEXICO OFFLINE-TRADE IN SAUCES, DRESSINGS AND CONDIMENTS MARKET, BY TYPE, 2018-2033 (USD MILLION)
TABLE 278 MEXICO STORE-BASED RETAILERS IN SAUCES, DRESSINGS AND CONDIMENTS MARKET, BY TYPE, 2018-2033 (USD MILLION)
TABLE 279 MEXICO NON-STORE BASED IN SAUCES, DRESSINGS AND CONDIMENTS MARKET, BY TYPE, 2018-2033 (USD MILLION)
TABLE 280 MEXICO ONLINE TRADE IN SAUCES, DRESSINGS AND CONDIMENTS MARKET, BY TYPE, 2018-2033 (USD MILLION)
List of Figure
FIGURE 1 NORTH AMERICA SAUCES, DRESSINGS AND CONDIMENTS MARKET: SEGMENTATION
FIGURE 2 NORTH AMERICA SAUCES, DRESSINGS AND CONDIMENTS MARKET: DATA TRIANGULATION
FIGURE 3 NORTH AMERICA SAUCES, DRESSINGS AND CONDIMENTS MARKET: DROC ANALYSIS
FIGURE 4 NORTH AMERICA SAUCES, DRESSINGS AND CONDIMENTS MARKET: NORTH AMERICA VS REGIONAL ANALYSIS
FIGURE 5 NORTH AMERICA SAUCES, DRESSINGS AND CONDIMENTS MARKET: COMPANY RESEARCH ANALYSIS
FIGURE 6 NORTH AMERICA SAUCES, DRESSINGS AND CONDIMENTS MARKET: INTERVIEW DEMOGRAPHICS
FIGURE 7 NORTH AMERICA SAUCES, DRESSINGS AND CONDIMENTS MARKET: DBMR MARKET POSITION GRID
FIGURE 8 NORTH AMERICA SAUCES, DRESSINGS AND CONDIMENTS MARKET: VENDOR SHARE ANALYSIS
FIGURE 9 NORTH AMERICA SAUCES, DRESSINGS AND CONDIMENTS MARKET: SEGMENTATION
FIGURE 10 STRATEGIC DECISIONS
FIGURE 11 THREE SEGMENTS COMPRISE THE NORTH AMERICA SAUCES, DRESSINGS AND CONDIMENTS MARKET, BY TYPE (2025)
FIGURE 12 EXECUTIVE SUMMARY
FIGURE 13 RISING PREFERENCE FOR NORTH AMERICA FLAVOR EXPLORATION ARE EXPECTED TO DRIVE THE NORTH AMERICA SAUCES, DRESSINGS AND CONDIMENTS MARKET DURING THE FORECAST PERIOD OF 2026 TO 2033
FIGURE 14 SAUCES SEGMENT IS EXPECTED TO ACCOUNT FOR THE LARGEST SHARE OF THE NORTH AMERICA SAUCES, DRESSINGS AND CONDIMENTS MARKET IN 2026 & 2033
FIGURE 15 PATENT ANALYSIS BY APPLICANTS
FIGURE 16 PATENT ANALYSIS BY COUNTRY
FIGURE 17 PATENT ANALYSIS BY YEAR
FIGURE 18 VENDOR SELECTION CRITERIA
FIGURE 19 NORTH AMERICA SAUCES, DRESSINGS AND CONDIMENTS MARKET, AVERAGE SELLING PRICE (USD/KG)
FIGURE 20 DROC ANALYSIS
FIGURE 21 NORTH AMERICA SAUCES, DRESSINGS AND CONDIMENTS MARKET: BY TYPE, 2025
FIGURE 22 SAUCES, DRESSINGS AND CONDIMENTS MARKET: BY INGREDIENTS, 2025
FIGURE 23 SAUCES, DRESSINGS AND CONDIMENTS MARKET: BY PACKAGING TYPE, 2025
FIGURE 24 NORTH AMERICA SAUCES, DRESSINGS AND CONDIMENTS MARKET: BY PACKAGING MATERIAL, 2025
FIGURE 25 NORTH AMERICA SAUCES, DRESSINGS AND CONDIMENTS MARKET: BY PACKAGING SIZE, 2025
FIGURE 26 NORTH AMERICA SAUCES, DRESSINGS AND CONDIMENTS MARKET: BY END USER, 2025
FIGURE 27 NORTH AMERICA SAUCES, DRESSINGS AND CONDIMENTS MARKET: BY DISTRIBUTION CHANNEL, 2025
FIGURE 28 NORTH AMERICA SAUCES, DRESSINGS AND CONDIMENTS MARKET, BY REGION
FIGURE 29 NORTH AMERICA SAUCES, DRESSINGS AND CONDIMENTS MARKET: COMPANY SHARE 2025 (%)
North America Sauces Dressings And Condiments Market, Supply Chain Analysis and Ecosystem Framework
To support market growth and help clients navigate the impact of geopolitical shifts, DBMR has integrated in-depth supply chain analysis into its North America Sauces Dressings And Condiments Market research reports. This addition empowers clients to respond effectively to global changes affecting their industries. The supply chain analysis section includes detailed insights such as North America Sauces Dressings And Condiments Market consumption and production by country, price trend analysis, the impact of tariffs and geopolitical developments, and import and export trends by country and HSN code. It also highlights major suppliers with data on production capacity and company profiles, as well as key importers and exporters. In addition to research, DBMR offers specialized supply chain consulting services backed by over a decade of experience, providing solutions like supplier discovery, supplier risk assessment, price trend analysis, impact evaluation of inflation and trade route changes, and comprehensive market trend analysis.
Data collection and base year analysis are done using data collection modules with large sample sizes. The stage includes obtaining market information or related data through various sources and strategies. It includes examining and planning all the data acquired from the past in advance. It likewise envelops the examination of information inconsistencies seen across different information sources. The market data is analysed and estimated using market statistical and coherent models. Also, market share analysis and key trend analysis are the major success factors in the market report. To know more, please request an analyst call or drop down your inquiry.
The key research methodology used by DBMR research team is data triangulation which involves data mining, analysis of the impact of data variables on the market and primary (industry expert) validation. Data models include Vendor Positioning Grid, Market Time Line Analysis, Market Overview and Guide, Company Positioning Grid, Patent Analysis, Pricing Analysis, Company Market Share Analysis, Standards of Measurement, Global versus Regional and Vendor Share Analysis. To know more about the research methodology, drop in an inquiry to speak to our industry experts.
Data Bridge Market Research is a leader in advanced formative research. We take pride in servicing our existing and new customers with data and analysis that match and suits their goal. The report can be customized to include price trend analysis of target brands understanding the market for additional countries (ask for the list of countries), clinical trial results data, literature review, refurbished market and product base analysis. Market analysis of target competitors can be analyzed from technology-based analysis to market portfolio strategies. We can add as many competitors that you require data about in the format and data style you are looking for. Our team of analysts can also provide you data in crude raw excel files pivot tables (Fact book) or can assist you in creating presentations from the data sets available in the report.


