
North America Sip Trunking Services Market
Market Size in USD Billion
 USD
5.95 Billion
USD
19.03 Billion
2024
2032
USD
5.95 Billion
USD
19.03 Billion
2024
2032
| 2025 - 2032 | |
| USD 5.95 Billion | |
| USD 19.03 Billion | |
| % | |
|
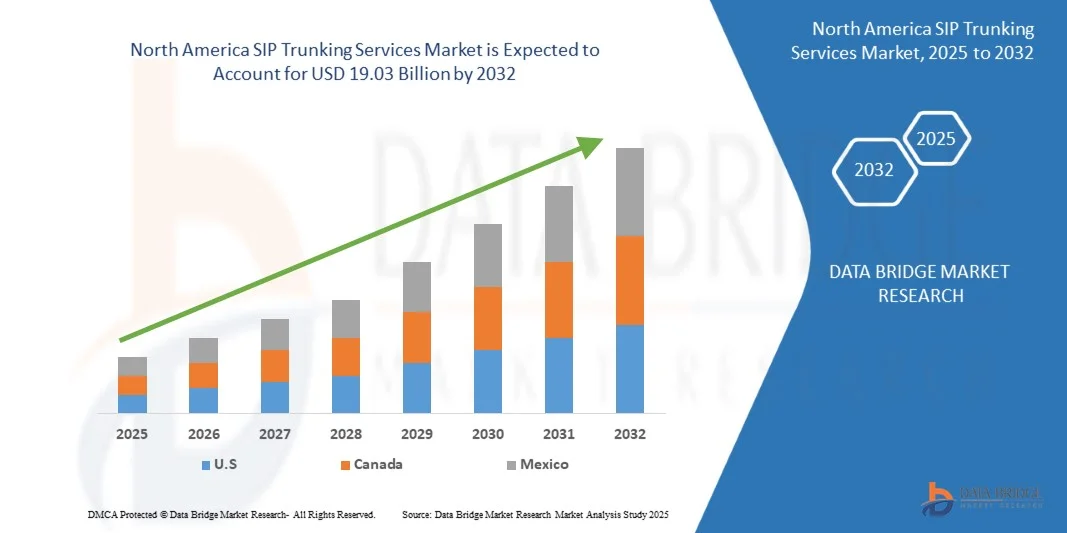
North America SIP Trunking Services Market Size
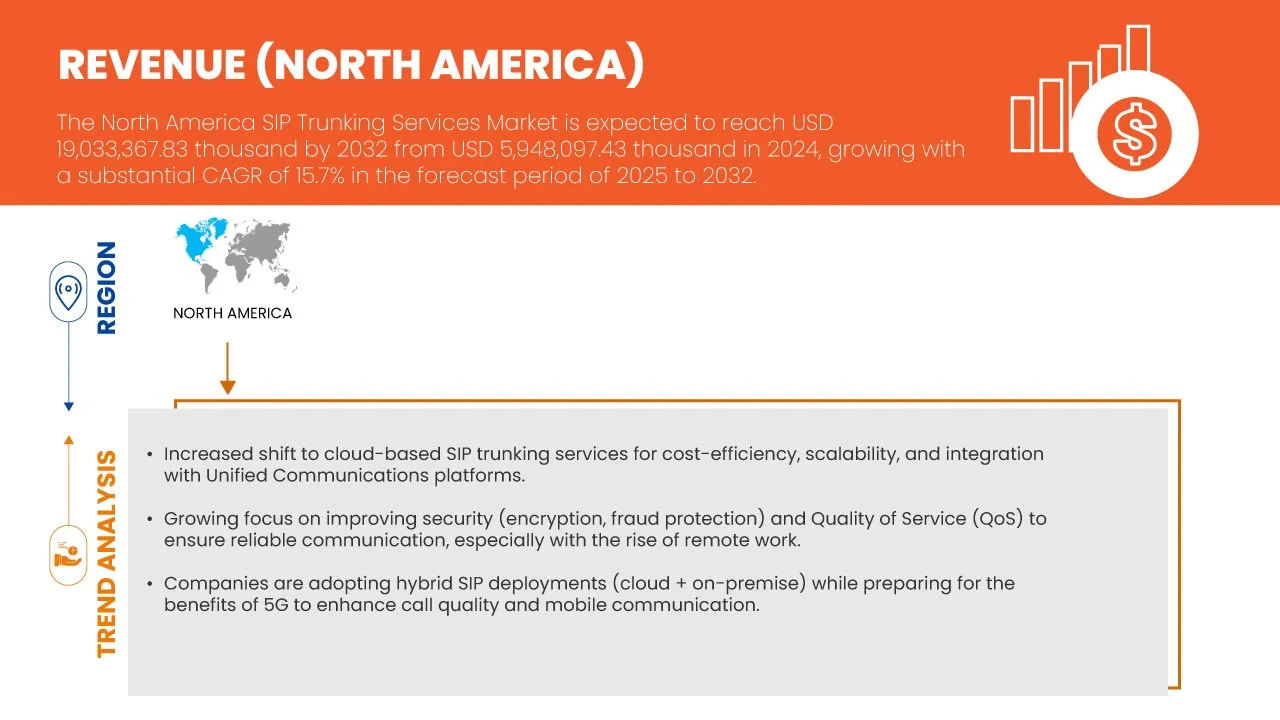
- The North America SIP trunking services market size was valued at USD 5.95 billion in 2024 and is expected to reach USD 19.03 billion by 2032, at a CAGR of 15.7% during the forecast period
- SIP Trunking Services refer to a digital communication technology that uses the Session Initiation Protocol (SIP) to deliver voice, video, and messaging services over an internet connection instead of traditional telephone lines
- Unlike legacy Public Switched Telephone Network (PSTN) systems, SIP trunking allows businesses to connect their private branch exchange (PBX) directly to the internet, enabling Voice over Internet Protocol (VoIP) calling and integration with unified communications platforms. This eliminates the need for separate physical phone lines, offering more flexibility, scalability, and cost-efficiency for organizations of all sizes
North America SIP Trunking Services Market Analysis
- SIP trunking services provide the “virtual phone lines” that carry concurrent voice calls, making them an essential backbone for enterprises shifting to cloud-based communication. Providers bundle features such as call routing, disaster recovery, toll-free services, and international calling, while ensuring regulatory compliance and security standards
- Digital transformation initiatives, regulatory compliance requirements, and the integration of advanced technologies such as AI-driven call routing and cloud-based PBX systems are key market drivers. SIP trunking eliminates the complexity and cost of maintaining multiple phone lines, offering organizations predictable performance, scalability, and seamless global connectivity
- U.S. is expected to dominate the North America SIP trunking services market with a market share of 81.50% in 2025 and it is anticipated to show the fastest growth with a CAGR of 15.9% during the forecast period. Due to advanced telecom infrastructure, high cloud adoption, enterprise digital transformation, cost efficiency demands, regulatory support, and presence of major providers. Strong IT ecosystems and hybrid work trends further accelerate SIP migration over legacy PSTN systems nationwide
- On-premise server segment dominated the North America SIP trunking services market with 60.04% revenue share in 2024, due to the continued reliance of large enterprises and regulated industries on in-house infrastructure for greater control, compliance, and security. Many organizations in sectors such as healthcare, finance, and government prefer on-premise SIP trunking integrated with existing PBX and UC systems to maintain data sovereignty and reduce external dependency
Report Scope and North America SIP Trunking Services Market Segmentation
|
Attributes |
North America SIP Trunking Services Key Market Insights |
|
Segments Covered |
|
|
Countries Covered |
North America
|
|
Key Market Players |
|
|
Market Opportunities |
|
|
Value Added Data Infosets |
In addition to the insights on market scenarios such as market value, growth rate, segmentation, geographical coverage, and major players, the market reports curated by the Data Bridge Market Research also include in-depth expert analysis, pricing analysis, brand share analysis, consumer survey, demography analysis, supply chain analysis, value chain analysis, raw material/consumables overview, vendor selection criteria, PESTLE Analysis, Porter Analysis, and regulatory framework. |
North America SIP Trunking Services Market Trends
“Shift Toward Cloud Integration, Unified Communications, and AI-Driven Call Management”
- The North America SIP Trunking Services market is undergoing a major transformation with enterprises moving away from legacy PBX systems toward cloud-based SIP trunking solutions integrated with unified communications platforms
- Businesses are leveraging SIP trunks to enable seamless voice, video, and data convergence, supporting remote workforces and hybrid office models
- Service providers are expanding portfolios with AI-driven call routing, fraud prevention, and real-time analytics to improve enterprise communications efficiency
- For instance, regional telecom operators have introduced SIP trunking solutions bundled with collaboration tools, APIs, and advanced security protocols to meet enterprise demand for scalable and resilient communication infrastructure
- This trend reflects the broader shift toward digital transformation, supporting enterprises in reducing communication costs, enhancing flexibility, and enabling future-ready, cloud-based connectivity across North America
North America SIP Trunking Services Market Dynamics
Driver
“Rising Demand for Cloud-Based Communication and Unified Connectivity”
- Enterprises are increasingly adopting SIP trunking to unify voice and data communications, integrate with collaboration platforms, and reduce dependence on traditional PRI lines
- Growing remote work and hybrid workforce models are accelerating the deployment of SIP trunks for scalable, location-independent communication
- The integration of SIP trunking with collaboration suites such as Microsoft Teams and Zoom Phone is strengthening enterprise adoption
- Telecom operators are partnering with cloud providers to deliver managed SIP solutions that ensure high reliability, security, and interoperability with existing enterprise IT infrastructure.
- These developments highlight how enterprises across North America are embracing SIP trunking to enable cost efficiency, business continuity, and flexible communication strategies
Restraint/Challenge
“Security Risks and Regulatory Compliance Complexities”
- Despite rapid adoption, SIP trunking faces challenges linked to cyber threats such as call fraud, denial-of-service attacks, and data interception
- Enterprises must invest in advanced encryption, firewalls, and monitoring systems to secure SIP trunk deployments, increasing implementation complexity
- Regulatory frameworks governing voice over IP (VoIP) services, including lawful intercept requirements, emergency service routing (E911), and cross-border communication compliance, pose operational hurdles for providers
- Small and medium enterprises often lack the expertise or resources to manage these compliance and security demands, creating reliance on managed service providers
- These barriers can slow adoption, particularly among highly regulated sectors, but also open opportunities for providers offering secure, compliant, and fully managed SIP trunking solutions
North America SIP Trunking Services Market Scope
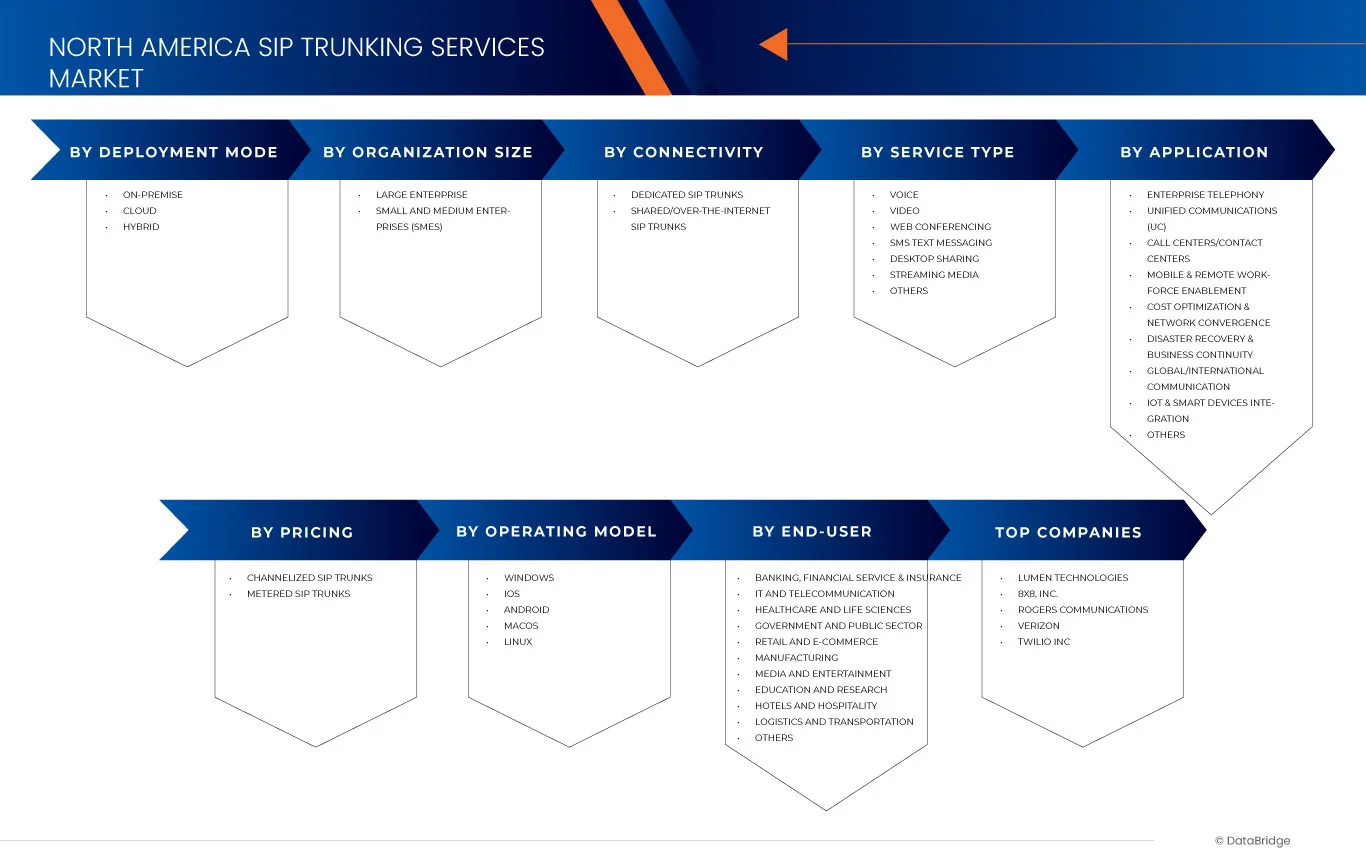
The market is segmented on the basis of deployment type, organization size, connectivity, service type, application, pricing, operating model, and end user.
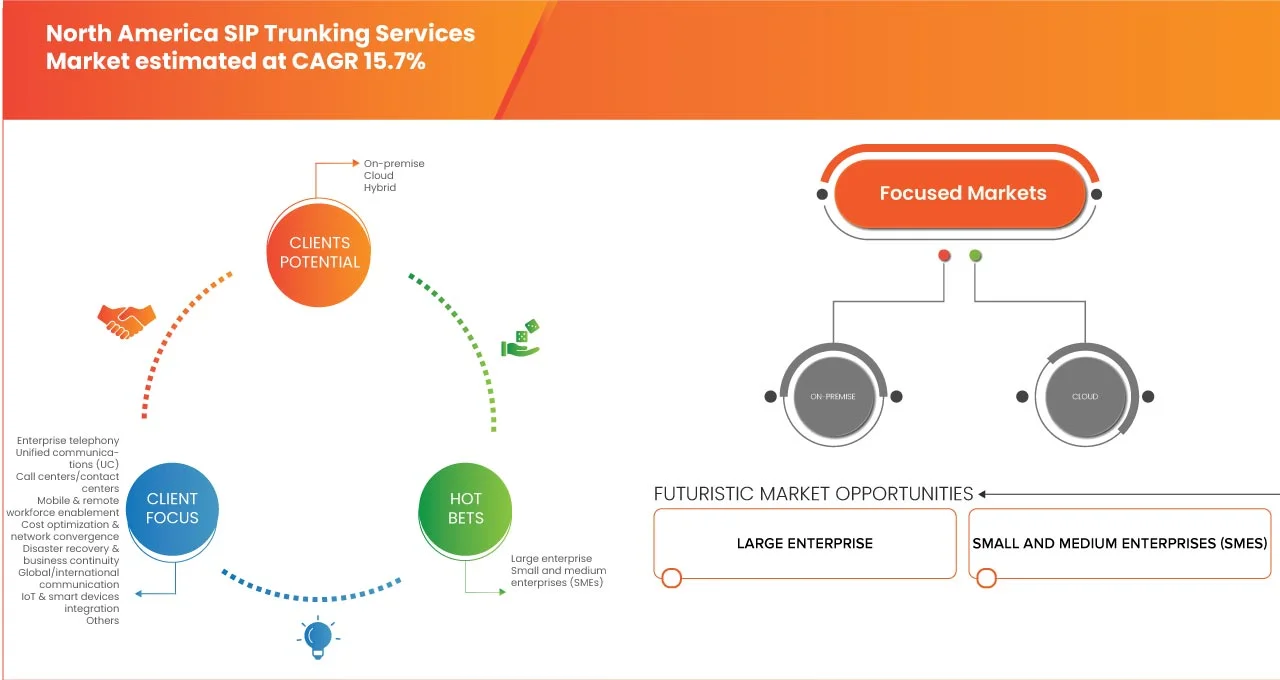
- By Deployment Type
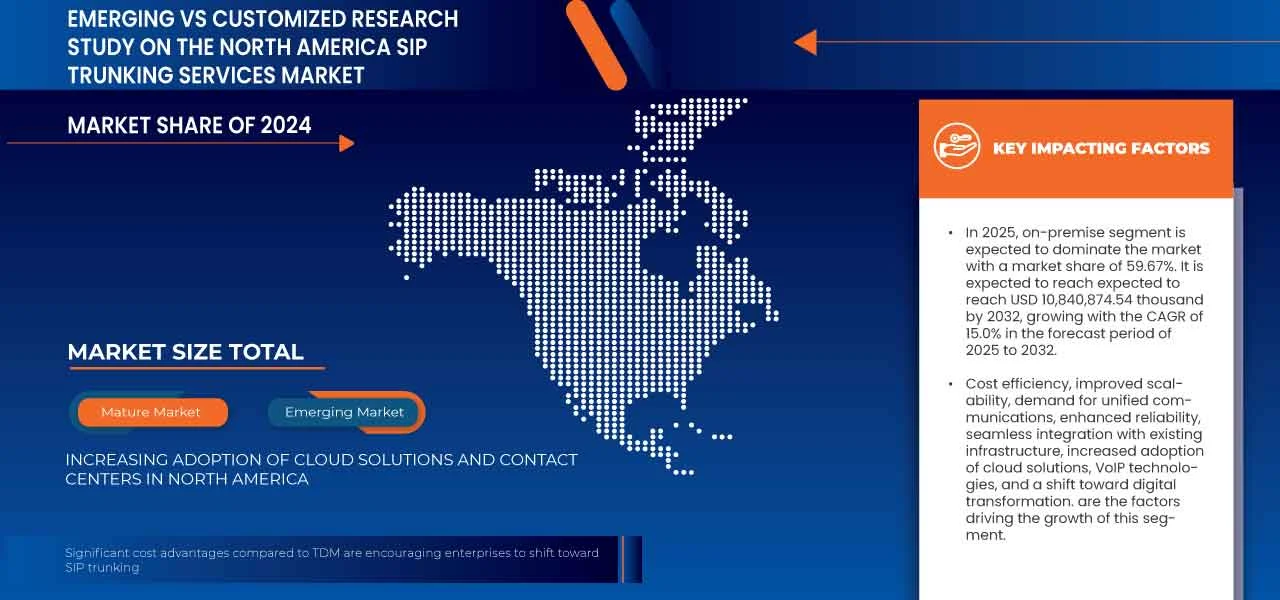
On the basis of deployment type, the North America SIP trunking services market is segmented into on-premise, cloud, and hybrid. In 2025, the on-premise server segment is expected to dominate the market with a share 59.67% This dominance stems from the reliance of large enterprises and regulated industries on in-house infrastructure for control, compliance, and security. Organizations in healthcare, finance, and government prefer on-premise SIP trunking integrated with existing PBX and UC systems to ensure data sovereignty and minimize external dependency. This strong alignment with regulatory and operational priorities sustains segment leadership.
The cloud segment is anticipated to register the fastest growth at a CAGR of 17.1% during the forecast period. Growing digital transformation initiatives and adoption of cloud-based communication models across enterprises are driving demand. SMEs, in particular, are rapidly shifting to cloud SIP trunking for cost-effectiveness, scalability, and minimal infrastructure requirements. Cloud solutions enable remote collaboration, seamless integration with UC platforms, and flexibility in managing high-volume communication workloads. This trend highlights cloud’s strategic role in reshaping enterprise communication.
- By Organization Size
On the basis of organization size, the North America SIP trunking services market is segmented into large enterprises and Small and Medium Enterprises (SMEs). In 2025, the large enterprises segment is expected to dominate the market with a revenue share of 65.20%. High demand for scalable, reliable, and secure communication solutions drives this segment, particularly across industries such as finance, government, and healthcare. Integration with existing PBX and UC systems enables enterprises to support complex, high-volume workloads. Large enterprises prioritize SIP trunking to enhance operational efficiency, regulatory compliance, and customer engagement. Their significant communication needs, coupled with advanced infrastructure investments, ensure continued dominance in the regional SIP trunking landscape.
The Small and Medium Enterprises (SMEs) segment is anticipated to witness the fastest growth with a CAGR of 16.7% during the forecast period. SMEs increasingly adopt SIP trunking to replace traditional telephony systems with cost-efficient, flexible, and scalable solutions. Cloud-based SIP trunks are particularly attractive to SMEs due to low upfront investments and quick deployment. These solutions allow businesses to streamline communication, support remote workforces, and expand reach while maintaining affordability. Rising digital adoption among SMEs strongly supports rapid segment growth across North America.
- By Connectivity
On the basis of connectivity, the North America SIP trunking services market is segmented into dedicated SIP trunks and shared/over-the-internet SIP trunks. In 2025, the dedicated SIP trunks segment is expected to dominate the market with a share of 58.46% and it is anticipated to show the fastest growth with a CAGR of 16.2% during the forecast period due to higher reliability, guaranteed bandwidth, enhanced security, and consistent quality of service, which are critical for large enterprises and mission-critical communication applications across industries such as finance, healthcare, and government. Enterprises rely on dedicated SIP trunks due to their guaranteed bandwidth, consistent quality of service, and enhanced security, critical for sectors such as finance, healthcare, and government. The assurance of high reliability and uptime makes dedicated SIP trunks ideal for mission-critical communication. This preference highlights the growing enterprise need for secure, high-performance solutions to maintain operational continuity and customer trust.
- By Service Type
On the basis of service type, the North America SIP trunking services market is segmented into voice, video, web conferencing, SMS/text messaging, desktop sharing, streaming media, and others. In 2025, the voice segment is expected to dominate the market with a share of 49.96% due to Voice remains central to enterprise communication due to high call volumes and its critical role in unified communication systems. SIP trunking delivers cost savings compared to traditional PSTN lines and ensures flexibility for large organizations across finance, healthcare, and IT. Enterprises continue to prioritize robust voice infrastructure to support regulatory compliance, emergency services, and seamless collaboration, ensuring the segment’s sustained leadership.
The web conferencing segment is projected to grow the fastest with a CAGR of 16.2% during the forecast period. Businesses are increasingly leveraging web conferencing as part of their SIP trunking solutions to support hybrid work models, remote collaboration, and virtual events. Rising demand for real-time communication, integrated video, and desktop sharing is fueling adoption. Enhanced bandwidth and quality improvements are boosting user experience. As organizations prioritize productivity and seamless connectivity, web conferencing emerges as a critical growth driver in the SIP trunking landscape.
- By Application
On the basis of application, the North America SIP Trunking services market is segmented into enterprise telephony, Unified Communications (UC), call centers / contact centers, mobile & remote workforce enablement, cost optimization & network convergence, disaster recovery & business continuity, global/international communication, IoT & smart devices integration, and others. In 2025, the enterprise telephony segment is expected to dominate the market with a share of 29.70%. Telephony continues to form the backbone of daily business operations, particularly in large enterprises. High adoption across finance, government, and healthcare reflects the need for secure, compliant, and reliable voice solutions. SIP trunking ensures E911 compliance, supports international communication, and integrates with UC platforms to streamline workflows. Its central role in enabling critical enterprise communication sustains the segment’s dominant position in the market.
The IoT & smart devices integration segment is anticipated to expand at the fastest CAGR of 16.8% during the forecast period. Growing deployment of connected devices across enterprises is driving demand for SIP trunking to enable seamless communication between IoT systems and enterprise platforms. Integration enhances operational efficiency, real-time monitoring, and automation capabilities. As industries adopt smart devices for healthcare, manufacturing, and logistics, SIP trunking ensures scalable, secure, and cost-effective connectivity, positioning this segment as a major growth driver during the forecast period.
- By Pricing
On the basis of pricing the North America SIP Trunking services market is segmented into Channelized SIP Trunks and Metered SIP Trunks. In 2025, the channelized SIP trunks segment is expected to dominate the market with a share of 66.97%, due to Enterprises favor channelized trunks for predictable pricing, fixed capacity, and consistent service quality. This model ensures uninterrupted communication, making it ideal for businesses with high call volumes in regulated sectors such as finance and healthcare. Channelized SIP trunks align with enterprises’ need for stable, secure, and compliant communication solutions, solidifying their dominance in the regional SIP trunking services market.
The metered SIP trunks segment is forecast to register the fastest growth at a CAGR of 16.0% during the forecast period. Metered pricing appeals to SMEs and cost-conscious enterprises that prefer paying based on actual usage. This model provides flexibility, scalability, and affordability, particularly for businesses with fluctuating communication needs. With enterprises increasingly seeking cost-optimized solutions, metered SIP trunks allow them to scale communication infrastructure without heavy fixed costs, driving strong adoption throughout the forecast period in North America.
- By Operating Model
On the basis of pricing the North America SIP Trunking services market is segmented into Windows, iOS, Android, Mac OS, and Linux. In 2025, the Windows segment is expected to dominate the market with a share of 51.90%, due to Enterprises widely use Windows-based systems for unified communication due to their compatibility, reliability, and extensive integration with PBX and UC platforms. Large-scale adoption across finance, healthcare, and IT industries underpins the segment’s dominance. Windows SIP trunking services enable enterprises to optimize legacy systems, ensure regulatory compliance, and achieve seamless communication, reinforcing their position as the most preferred operating model in the market.
The Android segment is anticipated to grow the fastest at a CAGR of 16.4% during the forecast period. The rise of mobile workforces and BYOD (Bring Your Own Device) culture is fueling adoption of Android-based SIP trunking. Android offers flexibility, affordability, and compatibility with diverse applications, making it popular among SMEs and remote teams. As enterprises accelerate mobility strategies and demand portable communication solutions, Android SIP trunking gains momentum, positioning the segment for rapid expansion during the forecast period in North America.
- By End User
On the basis of pricing the North America SIP Trunking services market is segmented into banking, financial services & insurance (BFSI), IT and telecommunication, healthcare and life sciences, government and public sector, retail and e-commerce, manufacturing, media and entertainment, education and research, hotels and hospitality, logistics and transportation, and others. In 2025, the banking, financial service & insurance segment is expected to dominate the market with a share of 51.90%. BFSI organizations require secure, reliable, and scalable communication systems to handle high transaction volumes, regulatory compliance, and customer interactions. SIP trunking helps optimize costs, enhance call quality, and ensure compliance with emergency services such as E911. Given the sector’s focus on data protection, operational efficiency, and customer trust, SIP trunking solutions remain indispensable, ensuring BFSI’s leadership in market adoption.
The Healthcare and Life Sciences segment is forecast to record the fastest growth at a CAGR of 16.4% during the forecast period. Rising demand for secure, high-quality communication in healthcare is driving adoption of SIP trunking. The need to support telemedicine, remote patient monitoring, and collaboration among healthcare professionals is accelerating deployment. SIP trunking ensures compliance with healthcare regulations, data security, and reliability. Growing digitalization of healthcare services and increasing patient engagement further position this segment for rapid growth during the forecast period.
North America SIP Trunking Services Market Regional Analysis
- U.S. is expected to dominate the North America SIP Trunking Services market with a market share of 81.50% in 2025 and it is anticipated to show the fastest growth with a CAGR of 15.9% during the forecast period, due to advanced telecom infrastructure, high cloud adoption, enterprise digital transformation, cost efficiency demands, regulatory support, and presence of major providers. Strong IT ecosystems and hybrid work trends further accelerate SIP migration over legacy PSTN systems nationwide
- The U.S. market for SIP trunking services is driven by rapid enterprise cloud adoption and the need to modernize outdated PRI-based systems. Businesses are migrating to SIP to enable unified communications, integrate with collaboration tools such as Microsoft Teams and Zoom, and support hybrid workforces
- Strong demand for scalable, secure, and cost-efficient connectivity, coupled with telecom providers’ focus on AI-powered call management and cybersecurity, positions the U.S. as the largest growth engine for SIP trunking in North America
Canada SIP Trunking Services Market Insight
The Canada SIP trunking market expected to dominate the Market with the second largest revenue share 11.67% in 2025, fueled by the rising adoption of cloud-first business strategies and regulatory support for advanced VoIP services. Enterprises are shifting to SIP to streamline communications, enhance disaster recovery, and reduce telephony costs across dispersed operations. The increasing popularity of hybrid workplaces and remote service delivery in healthcare, education, and financial services accelerates adoption. Telecom operators are expanding nationwide SIP networks with managed security and compliance features, driving robust market growth across Canada’s enterprise and mid-market sectors.
Mexico SIP Trunking Services Market Insight
The Mexico SIP trunking services market held a market share of 6.85% in 2024, driven by the digitalization of enterprises, the rise of nearshoring manufacturing hubs, and the need to modernize communication infrastructure. Businesses are replacing legacy PBX systems with SIP trunks to achieve cost-effective scalability, enhance cross-border connectivity, and integrate voice with data services. Telecom operators are partnering with cloud providers to deliver secure, compliant SIP offerings. Growing investment in IT infrastructure and increasing demand for unified communications in banking, retail, and industrial sectors further fuel adoption in Mexico.
North America SIP Trunking Services Market Share
The North America SIP Trunking Services industry is primarily led by well-established companies, including
- Lumen Technologies (U.S.)
- 8x8, Inc. (U.S.)
- Rogers Communications (Canada)
- Verizon (U.S.)
- Twilio Inc. (U.S.)
- GTT Communications, Inc. (U.S.)
- net2phone (U.S.)
- Vonage America, LLC (U.S.)
- Telstra (Australia)
- Intrado Life & Safety, Inc. (U.S.)
- Nextiva (U.S.)
- Sinch AB (Sweden)
- Mitel Networks Corp. (Canada)
- Colt Technology Services Group Limited (U.K.)
- Fusion Connect (U.S.)
- BT (U.K.)
- Orange (France)
- IntelePeer Cloud Communications LLC (U.S.)
- Wildix Inc. (Italy)
- AVOXI, Inc. (U.S.)
- 3CX (Cyprus)
- SIP.US (U.S.)
- G12 Communications LLC (U.S.)
Latest Developments in North America SIP Trunking Services Market
- In June 2025, AVOXI integrated artificial intelligence into its cloud voice platform, introducing features such as Proactive Services, AVOXI Digest, and Intelligent Caller ID. These enhancements aim to provide proactive, personalized, and intelligent services, transforming enterprise contact centers by anticipating issues and optimizing voice infrastructure
- In March 2025, 8x8, Inc. launched 8x8 Smart Assist and Conversation Intelligence, enhancing its AI-powered contact center platform to provide real-time agent support, automated quality assurance, and sentiment analysis, helping businesses improve customer interactions and reduce churn
- In July 2025, Verizon raised its full-year financial guidance for adjusted EBITDA, adjusted EPS, and free cash flow following a strong performance in its wireless and broadband businesses, driven by increased revenue, new customer additions, and successful product innovations
- In September 2025, Verizon updated its broadband strategy to accelerate fiber and fixed wireless rollout, aiming to double fixed wireless access subscribers by 2028, expand fiber network passings to 35–40 million households, and extend its broadband reach, including through the planned acquisition of Frontier
SKU-

- Interactive Data Analysis Dashboard
- Company Analysis Dashboard for high growth potential opportunities
- Research Analyst Access for customization & queries
- Competitor Analysis with Interactive dashboard
- Latest News, Updates & Trend analysis
- Harness the Power of Benchmark Analysis for Comprehensive Competitor Tracking
Table of Content
1 INTRODUCTION
1.1 OBJECTIVES OF THE STUDY
1.2 MARKET DEFINITION
1.3 OVERVIEW
1.4 LIMITATIONS
1.5 MARKETS COVERED
2 MARKET SEGMENTATION
2.1 MARKETS COVERED
2.2 GEOGRAPHICAL SCOPE
2.3 YEARS CONSIDERED FOR THE STUDY
2.4 CURRENCY AND PRICING
2.5 DBMR TRIPOD DATA VALIDATION MODEL
2.6 MULTIVARIATE MODELING
2.7 PRIMARY INTERVIEWS WITH KEY OPINION LEADERS
2.8 DBMR MARKET POSITION GRID
2.9 MARKET END USER COVERAGE GRID
2.1 SECONDARY SOURCES
2.11 ASSUMPTIONS
3 EXECUTIVE SUMMARY
4 PREMIUM INSIGHTS
5 USE CASE CATEGORIES WITH APPLICATIONS AND EXAMPLES
6 TARIFFS & IMPACT
6.1 UNITED STATES
6.2 CANADA
6.3 MEXICO
7 MARKET OVERVIEW
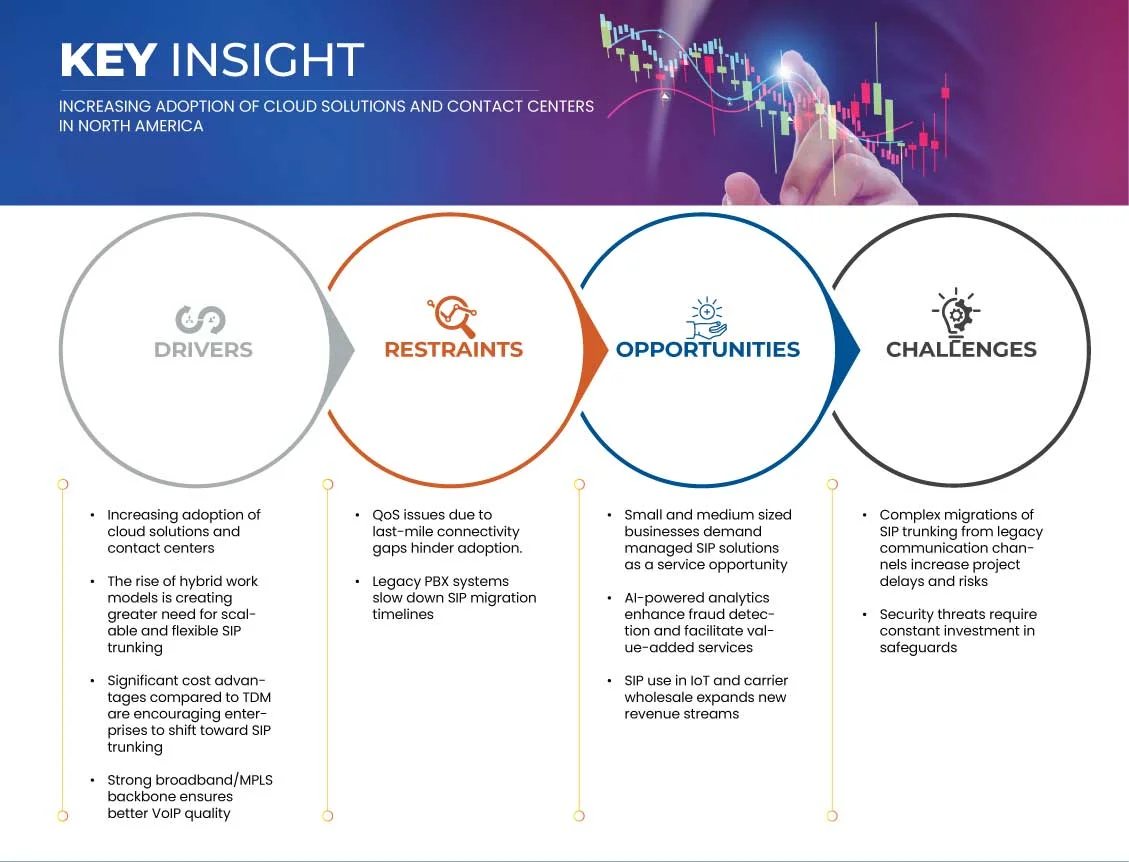
7.1 DRIVERS
7.1.1 INCREASING ADOPTION OF CLOUD SOLUTIONS AND CONTACT CENTERS
7.1.2 THE RISE OF HYBRID WORK MODELS IS CREATING GREATER NEED FOR SCALABLE AND FLEXIBLE SIP TRUNKING
7.1.3 SIGNIFICANT COST ADVANTAGES COMPARED TO TDM ARE ENCOURAGING ENTERPRISES TO SHIFT TOWARD SIP TRUNKING
7.1.4 STRONG BROADBAND/MPLS BACKBONE ENSURES BETTER VOIP QUALITY
7.2 RESTRAINTS
7.2.1 QOS ISSUES DUE TO LAST-MILE CONNECTIVITY GAPS HINDER ADOPTION
7.2.2 LEGACY PBX SYSTEMS SLOW DOWN SIP MIGRATION TIMELINES
7.3 OPPORTUNITIES
7.3.1 SMALL AND MEDIUM SIZED BUSINESSES DEMAND MANAGED SIP SOLUTIONS AS A SERVICE OPPORTUNITY
7.3.2 AI-POWERED ANALYTICS ENHANCE FRAUD DETECTION AND FACILITATE VALUE-ADDED SERVICES
7.3.3 SIP USE IN IOT AND CARRIER WHOLESALE EXPANDS NEW REVENUE STREAMS
7.4 CHALLENGES
7.4.1 COMPLEX MIGRATIONS OF SIP TRUNKING FROM LEGACY COMMUNICATION CHANNELS INCREASE PROJECT DELAYS AND RISKS
7.4.2 SECURITY THREATS REQUIRE CONSTANT INVESTMENT IN SAFEGUARDS
8 NORTH AMERICA SIP TRUNKING SERVICES MARKET, BY DEPLOYMENT MODEL
8.1 OVERVIEW
8.2 ON PREMISE
8.3 CLOUD
8.4 HYBRID
9 NORTH AMERICA SIP TRUNKING SERVICES MARKET, BY ORGANIZATION SIZE
9.1 OVERVIEW
9.2 LARGE ENTERPRISE
9.2.1 LARGE ENTERPRISE, BY TYPE
9.2.1.1 ON PRIMES
9.2.1.2 CLOUD
9.3 SMALL AND MEDIUM ENTERPRISES (SMES)
9.3.1 SMALL AND MEDIUM ENTERPRISES (SMES), BY TYPE
9.3.1.1 ON PRIMES
9.3.1.2 CLOUD
10 NORTH AMERICA SIP TRUNKING SERVICES MARKET, BY CONNECTIVITY
10.1 OVERVIEW
10.2 DEDICATED SIP TRUNKS
10.3 SHARED/OVER-THE-INTERNET SIP TRUNKS
11 NORTH AMERICA SIP TRUNKING SERVICES MARKET, BY SERVICE TYPE
11.1 OVERVIEW
11.2 VOICE
11.3 VIDEO
11.4 WEB CONFERENCING
11.5 SMS TEXT MESSAGING
11.6 DESKTOP SHARING
11.7 STREAMING MEDIA
11.8 OTHERS
12 NORTH AMERICA SIP TRUNKING SERVICES MARKET, BY APPLICATION
12.1 OVERVIEW
12.2 ENTERPRISE TELEPHONY
12.2.1 ENTERPRISE TELEPHONY, BY TYPE
12.2.1.1 REGULATORY COMPLIANCE / E911 SERVICES
12.2.1.2 OTHERS
12.3 UNIFIED COMMUNICATIONS (UC)
12.4 CALL CENTERS / CONTACT CENTERS
12.5 MOBILE & REMOTE WORKFORCE ENABLEMENT
12.6 COST OPTIMIZATION & NETWORK CONVERGENCE
12.7 DISASTER RECOVERY & BUSINESS CONTINUITY
12.7.1 DISASTER RECOVERY & BUSINESS CONTINUITY, BY TYPE
12.7.1.1 BACKUP TRUNKING
12.7.1.2 BCP PLANS
12.8 GLOBAL/INTERNATIONAL COMMUNICATION
12.8.1 GLOBAL/INTERNATIONAL COMMUNICATION
12.8.1.1 MULTINATIONAL DID ACCESS
12.8.1.2 PSTN COVERAGE
12.9 IOT & SMART DEVICES INTEGRATION
12.1 OTHERS
13 NORTH AMERICA SIP TRUNKING SERVICES MARKET, BY PRICING
13.1 OVERVIEW
13.2 CHANNELIZED SIP TRUNKS
13.3 METERED SIP TRUNKS
14 NORTH AMERICA SIP TRUNKING SERVICES MARKET, BY OPERATING MODEL
14.1 OVERVIEW
14.2 WINDOWS
14.3 IOS
14.4 ANDROID
14.5 MACOS
14.6 LINUX
15 NORTH AMERICA SIP TRUNKING SERVICES MARKET, BY END-USER
15.1 OVERVIEW
15.2 BANKING, FINANCIAL SERVICE & INSURANCE
15.2.1 BY USAGE
15.2.1.1 SECURE VOICE COMMUNICATION
15.2.1.2 CALL CENTER OPERATIONS
15.2.1.3 MULTI-SITE CALL ROUTING
15.2.2 BY CONNECTIVITY
15.2.2.1 DEDICATED SIP TRUNKS
15.2.2.2 SHARED/OVER-THE-INTERNET SIP TRUNKS
15.3 IT AND TELECOMMUNICATION
15.3.1 BY USAGE
15.3.1.1 ENTERPRISE VOIP DEPLOYMENTS
15.3.1.2 UNIFIED COMMUNICATIONS (UC) INTEGRATION
15.3.1.3 CLOUD PBX CONNECTIVITY
15.3.2 BY CONNECTIVITY
15.3.2.1 DEDICATED SIP TRUNKS
15.3.2.2 SHARED/OVER-THE-INTERNET SIP TRUNKS
15.4 HEALTHCARE AND LIFE SCIENCES
15.4.1 BY USAGE
15.4.1.1 TELEMEDICINE AND VIDEO CONSULTATIONS
15.4.1.2 REMOTE PATIENT MONITORING SYSTEMS
15.4.1.3 INTERNAL COMMUNICATION
15.4.2 BY CONNECTIVITY
15.4.2.1 DEDICATED SIP TRUNKS
15.4.2.2 SHARED/OVER-THE-INTERNET SIP TRUNKS
15.5 GOVERNMENT AND PUBLIC SECTOR
15.5.1 BY USAGE
15.5.1.1 PUBLIC SAFETY COMMUNICATION
15.5.1.2 SECURE GOVERNMENT VOIP NETWORKS
15.5.1.3 INTER-DEPARTMENT TELEPHONY
15.5.2 BY CONNECTIVITY
15.5.2.1 DEDICATED SIP TRUNKS
15.5.2.2 SHARED/OVER-THE-INTERNET SIP TRUNKS
15.6 RETAIL AND E-COMMERCE
15.6.1 BY USAGE
15.6.1.1 CUSTOMER SERVICE CALL CENTERS
15.6.1.2 ORDER AND SUPPORT HANDLING
15.6.1.3 UNIFIED COMMUNICATIONS
15.6.2 BY CONNECTIVITY
15.6.2.1 DEDICATED SIP TRUNKS
15.6.2.2 SHARED/OVER-THE-INTERNET SIP TRUNKS
15.7 MANUFACTURING
15.7.1 BY USAGE
15.7.1.1 PLANT FLOOR-TO-OFFICE COMMUNICATION
15.7.1.2 VIDEO COLLABORATION
15.7.1.3 INTEGRATION WITH IOT
15.7.2 BY CONNECTIVITY
15.7.2.1 DEDICATED SIP TRUNKS
15.7.2.2 SHARED/OVER-THE-INTERNET SIP TRUNKS
15.8 MEDIA AND ENTERTAINMENT
15.8.1 BY USAGE
15.8.1.1 REMOTE BROADCASTING
15.8.1.2 VIDEO COLLABORATION IN CREATIVE PRODUCTION
15.8.1.3 STREAMING AND INTERACTIVE CONTENT SUPPORT
15.8.2 BY CONNECTIVITY
15.8.2.1 DEDICATED SIP TRUNKS
15.8.2.2 SHARED/OVER-THE-INTERNET SIP TRUNKS
15.9 EDUCATION AND RESEARCH
15.9.1 BY USAGE
15.9.1.1 DISTANCE LEARNING AND VIRTUAL CLASSROOMS
15.9.1.2 VIDEO CONFERENCING FOR COLLABORATION
15.9.1.3 CAMPUS-WIDE COMMUNICATION SYSTEMS
15.9.2 BY CONNECTIVITY
15.9.2.1 DEDICATED SIP TRUNKS
15.9.2.2 SHARED/OVER-THE-INTERNET SIP TRUNKS
15.1 HOTELS AND HOSPITALITY
15.10.1 BY USAGE
15.10.1.1 HOTEL PBX SYSTEMS
15.10.1.2 BOOKINGS AND CALL CENTER SUPPORT
15.10.1.3 MOBILE APPS INTEGRATION
15.10.2 BY CONNECTIVITY
15.10.2.1 DEDICATED SIP TRUNKS
15.10.2.2 SHARED/OVER-THE-INTERNET SIP TRUNKS
15.11 LOGISTICS AND TRANSPORTATION
15.11.1 BY CONNECTIVITY
15.11.1.1 DEDICATED SIP TRUNKS
15.11.1.2 SHARED/OVER-THE-INTERNET SIP TRUNKS
15.12 OTHERS
16 NORTH AMERICA SIP TRUNKING SERVICES MARKET, BY COUNTRY
16.1 NORTH AMERICA
16.1.1 U.S.
16.1.2 CANADA
16.1.3 MEXICO
17 NORTH AMERICA SIP TRUNKING SERVICES MARKET: COMPANY LANDSCAPE
17.1 COMPANY SHARE ANALYSIS: NORTH AMERICA
18 SWOT ANALYSIS
19 COMPANY PROFILES
19.1 LUMEN TECHNOLOGIES
19.1.1 COMPANY SNAPSHOT
19.1.2 REVENUE ANALYSIS
19.1.3 SERVICE PORTFOLIO
19.1.4 RECENT DEVELOPMENT
19.2 8X8, INC.
19.2.1 COMPANY SNAPSHOT
19.2.2 REVENUE ANALYSIS
19.2.3 SERVICE PORTFOLIO
19.2.4 RECENT DEVELOPMENT
19.3 ROGERS COMMUNICATIONS
19.3.1 COMPANY SNAPSHOT
19.3.2 REVENUE ANALYSIS
19.3.3 PRODUCT PORTFOLIO
19.3.4 RECENT DEVELOPMENT
19.4 VERIZON
19.4.1 COMPANY SNAPSHOT
19.4.2 REVENUE ANALYSIS
19.4.3 SERVICE PORTFOLIO
19.4.4 RECENT DEVELOPMENT
19.5 TWILIO INC.
19.5.1 COMPANY SNAPSHOT
19.5.2 REVENUE ANALYSIS
19.5.3 PRODUCT PORTFOLIO
19.5.4 RECENT DEVELOPMENT
19.6 AVOXI
19.6.1 COMPANY SNAPSHOT
19.6.2 PRODUCT PORTFOLIO
19.6.3 RECENT DEVELOPMENTS
19.7 BT
19.7.1 COMPANY SNAPSHOT
19.7.2 REVENUE ANALYSIS
19.7.3 SERVICE PORTFOLIO
19.7.4 RECENT DEVELOPMENT
19.8 COIL TECHNOLOGY SERVICES GROUP
19.8.1 COMPANY SNAPSHOT
19.8.2 PRODUCT PORTFOLIO
19.8.3 RECENT DEVELOPMENT
19.9 FUSION CONNECT
19.9.1 COMPANY SNAPSHOT
19.9.2 SERVICE PORTFOLIO
19.9.3 RECENT DEVELOPMENT
19.1 GTT COMMUNICATION, INC.
19.10.1 COMPANY SNAPSHOT
19.10.2 PRODUCT PORTFOLIO
19.10.3 RECENT DEVELOPMENT
19.11 G12 COMMUNICATIONS LLC
19.11.1 COMPANY SNAPSHOT
19.11.2 PRODUCT PORTFOLIO
19.11.3 RECENT DEVELOPMENTS
19.12 INTRADO LIFE & SAFETY, INC.
19.12.1 COMPANY SNAPSHOT
19.12.2 PRODUCT PORTFOLIO
19.12.3 RECENT DEVELOPMENT
19.13 INTELE PEER CLOUD COMMUNICATION LLC
19.13.1 COMPANY SNAPSHOT
19.13.2 PRODUCT PORTFOLIO
19.13.3 RECENT DEVELOPMENT
19.14 MITEL NETWORKS CORP.
19.14.1 COMPANY SNAPSHOT
19.14.2 PRODUCT PORTFOLIO
19.14.3 RECENT DEVELOPMENT
19.15 NET2PHONE
19.15.1 COMPANY SNAPSHOT
19.15.2 PRODUCT PORTFOLIO
19.15.3 RECENT DEVELOPMENT
19.16 NEXTIVA
19.16.1 COMPANY SNAPSHOT
19.16.2 PRODUCT PORTFOLIO
19.16.3 RECENT DEVELOPMENT
19.17 ORANGE BUSINESS
19.17.1 COMPANY SNAPSHOT
19.17.2 REVENUE ANALYSIS
19.17.3 SERVICE PORTFOLIO
19.17.4 RECENT DEVELOPMENT
19.18 SINCH.
19.18.1 COMPANY SNAPSHOT
19.18.2 REVENUE ANALYSIS
19.18.3 PRODUCT PORTFOLIO
19.18.4 RECENT DEVELOPMENT
19.19 SIP.US
19.19.1 COMPANY SNAPSHOT
19.19.2 PRODUCT PORTFOLIO
19.19.3 RECENT DEVELOPMENTS
19.2 TELSTRA
19.20.1 COMPANY SNAPSHOT
19.20.2 REVENUE ANALYSIS
19.20.3 PRODUCT PORTFOLIO
19.20.4 RECENT DEVELOPMENTS
19.21 VONAGE
19.21.1 COMPANY SNAPSHOT
19.21.2 PRODUCT PORTFOLIO
19.21.3 RECENT DEVELOPMENTS
19.22 WILDIX
19.22.1 COMPANY SNAPSHOT
19.22.2 PRODUCT PORTFOLIO
19.22.3 RECENT DEVELOPMENT
19.23 3CX
19.23.1 COMPANY SNAPSHOT
19.23.2 PRODUCT PORTFOLIO
19.23.3 RECENT DEVELOPMENT
20 QUESTIONNAIRE
List of Table
TABLE 1 NORTH AMERICA SIP TRUNKING SERVICES MARKET, BY DEPLOYMENT MODEL, 2018-2032 (USD THOUSAND)
TABLE 2 NORTH AMERICA SIP TRUNKING SERVICES MARKET, BY ORGANIZATION SIZE, 2018-2032 (USD THOUSAND)
TABLE 3 NORTH AMERICA LARGE ENTERPRISE IN SIP TRUNKING SERVICES MARKET, BY TYPE, 2018-2032 (USD THOUSAND)
TABLE 4 NORTH AMERICA SMALL AND MEDIUM ENTERPRISES (SMES) IN SIP TRUNKING SERVICES MARKET, BY TYPE, 2018-2032 (USD THOUSAND)
TABLE 5 NORTH AMERICA SIP TRUNKING SERVICES MARKET, BY CONNECTIVITY, 2018-2032 (USD THOUSAND)
TABLE 6 NORTH AMERICA SIP TRUNKING SERVICES MARKET, BY SERVICE TYPE, 2018-2032 (USD THOUSAND)
TABLE 7 NORTH AMERICA SIP TRUNKING SERVICES MARKET, BY APPLICATION, 2018-2032 (USD THOUSAND)
TABLE 8 NORTH AMERICA ENTERPRISE TELEPHONY IN SIP TRUNKING SERVICES MARKET, BY TYPE, 2018-2032 (USD THOUSAND)
TABLE 9 NORTH AMERICA DISASTER RECOVERY & BUSINESS CONTINUITY IN SIP TRUNKING SERVICES MARKET, BY TYPE, 2018-2032 (USD THOUSAND)
TABLE 10 NORTH AMERICA GLOBAL/INTERNATIONAL COMMUNICATION IN SIP TRUNKING SERVICES MARKET, BY TYPE, 2018-2032 (USD THOUSAND)
TABLE 11 NORTH AMERICA SIP TRUNKING SERVICES MARKET, BY PRICING, 2018-2032, (USD THOUSAND)
TABLE 12 NORTH AMERICA SIP TRUNKING SERVICES MARKET, BY OPERATING MODEL, 2018-2032, (USD THOUSAND)
TABLE 13 NORTH AMERICA SIP TRUNKING SERVICES MARKET, BY END-USER, 2018-2032, (USD THOUSAND)
TABLE 14 NORTH AMERICA BANKING, FINANCIAL SERVICE & INSURANCE IN SIP TRUNKING SERVICES MARKET, BY USAGE, 2018-2032 (USD THOUSAND)
TABLE 15 NORTH AMERICA BANKING, FINANCIAL SERVICE & INSURANCE IN SIP TRUNKING SERVICES MARKET, BY CONNECTIVITY, 2018-2032 (USD THOUSAND)
TABLE 16 NORTH AMERICA IT AND TELECOMMUNICATION IN SIP TRUNKING SERVICES MARKET, BY USAGE, 2018-2032 (USD THOUSAND)
TABLE 17 NORTH AMERICA IT AND TELECOMMUNICATION IN SIP TRUNKING SERVICES MARKET, BY CONNECTIVITY, 2018-2032 (USD THOUSAND)
TABLE 18 NORTH AMERICA HEALTHCARE AND LIFE SCIENCES IN SIP TRUNKING SERVICES MARKET, BY USAGE, 2018-2032 (USD THOUSAND)
TABLE 19 NORTH AMERICA HEALTHCARE AND LIFE SCIENCES IN SIP TRUNKING SERVICES MARKET, BY CONNECTIVITY, 2018-2032 (USD THOUSAND)
TABLE 20 NORTH AMERICA GOVERNMENT AND PUBLIC SECTOR IN SIP TRUNKING SERVICES MARKET, BY USAGE, 2018-2032 (USD THOUSAND)
TABLE 21 NORTH AMERICA GOVERNMENT AND PUBLIC SECTOR IN SIP TRUNKING SERVICES MARKET, BY CONNECTIVITY, 2018-2032 (USD THOUSAND)
TABLE 22 NORTH AMERICA RETAIL AND E-COMMERCE IN SIP TRUNKING SERVICES MARKET, BY USAGE, 2018-2032 (USD THOUSAND)
TABLE 23 NORTH AMERICA RETAIL AND E-COMMERCE IN SIP TRUNKING SERVICES MARKET, BY CONNECTIVITY, 2018-2032 (USD THOUSAND)
TABLE 24 NORTH AMERICA MANUFACTURING IN SIP TRUNKING SERVICES MARKET, BY USAGE, 2018-2032 (USD THOUSAND)
TABLE 25 NORTH AMERICA MANUFACTURING IN SIP TRUNKING SERVICES MARKET, BY CONNECTIVITY, 2018-2032 (USD THOUSAND)
TABLE 26 NORTH AMERICA MEDIA AND ENTERTAINMENT IN SIP TRUNKING SERVICES MARKET, BY USAGE, 2018-2032 (USD THOUSAND)
TABLE 27 NORTH AMERICA MEDIA AND ENTERTAINMENT IN SIP TRUNKING SERVICES MARKET, BY CONNECTIVITY, 2018-2032 (USD THOUSAND)
TABLE 28 NORTH AMERICA EDUCATION AND RESEARCH IN SIP TRUNKING SERVICES MARKET, BY USAGE, 2018-2032 (USD THOUSAND)
TABLE 29 NORTH AMERICA EDUCATION AND RESEARCH IN SIP TRUNKING SERVICES MARKET, BY CONNECTIVITY, 2018-2032 (USD THOUSAND)
TABLE 30 NORTH AMERICA HOTELS AND HOSPITALITY IN SIP TRUNKING SERVICES MARKET, BY USAGE, 2018-2032 (USD THOUSAND)
TABLE 31 NORTH AMERICA HOTELS AND HOSPITALITY IN SIP TRUNKING SERVICES MARKET, BY CONNECTIVITY, 2018-2032 (USD THOUSAND)
TABLE 32 NORTH AMERICA LOGISTICS AND TRANSPORTATION IN SIP TRUNKING SERVICES MARKET, BY CONNECTIVITY, 2018-2032 (USD THOUSAND)
TABLE 33 NORTH AMERICA SIP TRUNKING SERVICES MARKET, BY COUNTRY, 2018-2032 (USD THOUSAND)
TABLE 34 U.S. SIP TRUNKING SERVICES MARKET, BY DEPLOYMENT TYPE, 2018-2032 (USD THOUSAND)
TABLE 35 U.S. SIP TRUNKING SERVICES MARKET, BY ORGANIZATION SIZE, 2018-2032 (USD THOUSAND)
TABLE 36 U.S. LARGE ENTERPRISE IN SIP TRUNKING SERVICES MARKET, BY TYPE, 2018-2032 (USD THOUSAND)
TABLE 37 U.S. SMALL AND MEDIUM ENTERPRISES (SMES) IN SIP TRUNKING SERVICES MARKET, BY TYPE, 2018-2032 (USD THOUSAND)
TABLE 38 U.S. SIP TRUNKING SERVICES MARKET, BY CONNECTIVITY, 2018-2032 (USD THOUSAND)
TABLE 39 U.S. COMMERCIAL IN SIP TRUNKING SERVICES MARKET, BY SERVICE TYPE, 2018-2032 (USD THOUSAND)
TABLE 40 U.S. SIP TRUNKING SERVICES MARKET, BY APPLICATION, 2018-2032 (USD THOUSAND)
TABLE 41 U.S. ENTERPRISE TELEPHONY IN SIP TRUNKING SERVICES MARKET, BY TYPE, 2018-2032 (USD THOUSAND)
TABLE 42 U.S. DISASTER RECOVERY & BUSINESS CONTINUITY IN SIP TRUNKING SERVICES MARKET, BY TYPE, 2018-2032 (USD THOUSAND)
TABLE 43 U.S. GLOBAL/INTERNATIONAL COMMUNICATION IN SIP TRUNKING SERVICES MARKET, BY TYPE, 2018-2032 (USD THOUSAND)
TABLE 44 U.S. SIP TRUNKING SERVICES MARKET, BY PRICING, 2018-2032 (USD THOUSAND)
TABLE 45 U.S. SIP TRUNKING SERVICES MARKET, BY OPERATING MODEL, 2018-2032 (USD THOUSAND)
TABLE 46 U.S. SIP TRUNKING SERVICES MARKET, BY END-USER, 2018-2032 (USD THOUSAND)
TABLE 47 U.S. BANKING, FINANCIAL SERVICE & INSURANCE IN SIP TRUNKING SERVICES MARKET, BY USAGE, 2018-2032 (USD THOUSAND)
TABLE 48 U.S. BANKING, FINANCIAL SERVICE & INSURANCE IN SIP TRUNKING SERVICES MARKET, BY CONNECTIVITY, 2018-2032 (USD THOUSAND)
TABLE 49 U.S. IT AND TELECOMMUNICATION IN SIP TRUNKING SERVICES MARKET, BY USAGE, 2018-2032 (USD THOUSAND)
TABLE 50 U.S. IT AND TELECOMMUNICATION IN SIP TRUNKING SERVICES MARKET, BY CONNECTIVITY, 2018-2032 (USD THOUSAND)
TABLE 51 U.S. HEALTHCARE AND LIFE SCIENCES IN SIP TRUNKING SERVICES MARKET, BY USAGE, 2018-2032 (USD THOUSAND)
TABLE 52 U.S. HEALTHCARE AND LIFE SCIENCES IN SIP TRUNKING SERVICES MARKET, BY CONNECTIVITY, 2018-2032 (USD THOUSAND)
TABLE 53 U.S. GOVERNMENT AND PUBLIC SECTOR IN SIP TRUNKING SERVICES MARKET, BY USAGE, 2018-2032 (USD THOUSAND)
TABLE 54 U.S. GOVERNMENT AND PUBLIC SECTOR IN SIP TRUNKING SERVICES MARKET, BY CONNECTIVITY, 2018-2032 (USD THOUSAND)
TABLE 55 U.S. RETAIL AND E-COMMERCE IN SIP TRUNKING SERVICES MARKET, BY USAGE, 2018-2032 (USD THOUSAND)
TABLE 56 U.S. RETAIL AND E-COMMERCE IN SIP TRUNKING SERVICES MARKET, BY CONNECTIVITY, 2018-2032 (USD THOUSAND)
TABLE 57 U.S. MANUFACTURING IN SIP TRUNKING SERVICES MARKET, BY USAGE, 2018-2032 (USD THOUSAND)
TABLE 58 U.S. MANUFACTURING IN SIP TRUNKING SERVICES MARKET, BY CONNECTIVITY, 2018-2032 (USD THOUSAND)
TABLE 59 U.S. MEDIA AND ENTERTAINMENT IN SIP TRUNKING SERVICES MARKET, BY USAGE, 2018-2032 (USD THOUSAND)
TABLE 60 U.S. MEDIA AND ENTERTAINMENT IN SIP TRUNKING SERVICES MARKET, BY CONNECTIVITY, 2018-2032 (USD THOUSAND)
TABLE 61 U.S. EDUCATION AND RESEARCH IN SIP TRUNKING SERVICES MARKET, BY USAGE, 2018-2032 (USD THOUSAND)
TABLE 62 U.S. EDUCATION AND RESEARCH IN SIP TRUNKING SERVICES MARKET, BY CONNECTIVITY, 2018-2032 (USD THOUSAND)
TABLE 63 U.S. HOTELS AND HOSPITALITY IN SIP TRUNKING SERVICES MARKET, BY USAGE, 2018-2032 (USD THOUSAND)
TABLE 64 U.S. HOTELS AND HOSPITALITY IN SIP TRUNKING SERVICES MARKET, BY CONNECTIVITY, 2018-2032 (USD THOUSAND)
TABLE 65 U.S. LOGISTICS AND TRANSPORTATION IN SIP TRUNKING SERVICES MARKET, BY CONNECTIVITY, 2018-2032 (USD THOUSAND)
TABLE 66 CANADA SIP TRUNKING SERVICES MARKET, BY DEPLOYMENT TYPE, 2018-2032 (USD THOUSAND)
TABLE 67 CANADA SIP TRUNKING SERVICES MARKET, BY ORGANIZATION SIZE, 2018-2032 (USD THOUSAND)
TABLE 68 CANADA LARGE ENTERPRISE IN SIP TRUNKING SERVICES MARKET, BY TYPE, 2018-2032 (USD THOUSAND)
TABLE 69 CANADA SMALL AND MEDIUM ENTERPRISES (SMES) IN SIP TRUNKING SERVICES MARKET, BY TYPE, 2018-2032 (USD THOUSAND)
TABLE 70 CANADA SIP TRUNKING SERVICES MARKET, BY CONNECTIVITY, 2018-2032 (USD THOUSAND)
TABLE 71 CANADA COMMERCIAL IN SIP TRUNKING SERVICES MARKET, BY SERVICE TYPE, 2018-2032 (USD THOUSAND)
TABLE 72 CANADA SIP TRUNKING SERVICES MARKET, BY APPLICATION, 2018-2032 (USD THOUSAND)
TABLE 73 CANADA ENTERPRISE TELEPHONY IN SIP TRUNKING SERVICES MARKET, BY TYPE, 2018-2032 (USD THOUSAND)
TABLE 74 CANADA DISASTER RECOVERY & BUSINESS CONTINUITY IN SIP TRUNKING SERVICES MARKET, BY TYPE, 2018-2032 (USD THOUSAND)
TABLE 75 CANADA GLOBAL/INTERNATIONAL COMMUNICATION IN SIP TRUNKING SERVICES MARKET, BY TYPE, 2018-2032 (USD THOUSAND)
TABLE 76 CANADA SIP TRUNKING SERVICES MARKET, BY PRICING, 2018-2032 (USD THOUSAND)
TABLE 77 CANADA SIP TRUNKING SERVICES MARKET, BY OPERATING MODEL, 2018-2032 (USD THOUSAND)
TABLE 78 CANADA SIP TRUNKING SERVICES MARKET, BY END-USER, 2018-2032 (USD THOUSAND)
TABLE 79 CANADA BANKING, FINANCIAL SERVICE & INSURANCE IN SIP TRUNKING SERVICES MARKET, BY USAGE, 2018-2032 (USD THOUSAND)
TABLE 80 CANADA BANKING, FINANCIAL SERVICE & INSURANCE IN SIP TRUNKING SERVICES MARKET, BY CONNECTIVITY, 2018-2032 (USD THOUSAND)
TABLE 81 CANADA IT AND TELECOMMUNICATION IN SIP TRUNKING SERVICES MARKET, BY USAGE, 2018-2032 (USD THOUSAND)
TABLE 82 CANADA IT AND TELECOMMUNICATION IN SIP TRUNKING SERVICES MARKET, BY CONNECTIVITY, 2018-2032 (USD THOUSAND)
TABLE 83 CANADA HEALTHCARE AND LIFE SCIENCES IN SIP TRUNKING SERVICES MARKET, BY USAGE, 2018-2032 (USD THOUSAND)
TABLE 84 CANADA HEALTHCARE AND LIFE SCIENCES IN SIP TRUNKING SERVICES MARKET, BY CONNECTIVITY, 2018-2032 (USD THOUSAND)
TABLE 85 CANADA GOVERNMENT AND PUBLIC SECTOR IN SIP TRUNKING SERVICES MARKET, BY USAGE, 2018-2032 (USD THOUSAND)
TABLE 86 CANADA GOVERNMENT AND PUBLIC SECTOR IN SIP TRUNKING SERVICES MARKET, BY CONNECTIVITY, 2018-2032 (USD THOUSAND)
TABLE 87 CANADA RETAIL AND E-COMMERCE IN SIP TRUNKING SERVICES MARKET, BY USAGE, 2018-2032 (USD THOUSAND)
TABLE 88 CANADA RETAIL AND E-COMMERCE IN SIP TRUNKING SERVICES MARKET, BY CONNECTIVITY, 2018-2032 (USD THOUSAND)
TABLE 89 CANADA MANUFACTURING IN SIP TRUNKING SERVICES MARKET, BY USAGE, 2018-2032 (USD THOUSAND)
TABLE 90 CANADA MANUFACTURING IN SIP TRUNKING SERVICES MARKET, BY CONNECTIVITY, 2018-2032 (USD THOUSAND)
TABLE 91 CANADA MEDIA AND ENTERTAINMENT IN SIP TRUNKING SERVICES MARKET, BY USAGE, 2018-2032 (USD THOUSAND)
TABLE 92 CANADA MEDIA AND ENTERTAINMENT IN SIP TRUNKING SERVICES MARKET, BY CONNECTIVITY, 2018-2032 (USD THOUSAND)
TABLE 93 CANADA EDUCATION AND RESEARCH IN SIP TRUNKING SERVICES MARKET, BY USAGE, 2018-2032 (USD THOUSAND)
TABLE 94 CANADA EDUCATION AND RESEARCH IN SIP TRUNKING SERVICES MARKET, BY CONNECTIVITY, 2018-2032 (USD THOUSAND)
TABLE 95 CANADA HOTELS AND HOSPITALITY IN SIP TRUNKING SERVICES MARKET, BY USAGE, 2018-2032 (USD THOUSAND)
TABLE 96 CANADA HOTELS AND HOSPITALITY IN SIP TRUNKING SERVICES MARKET, BY CONNECTIVITY, 2018-2032 (USD THOUSAND)
TABLE 97 CANADA LOGISTICS AND TRANSPORTATION IN SIP TRUNKING SERVICES MARKET, BY CONNECTIVITY, 2018-2032 (USD THOUSAND)
TABLE 98 MEXICO SIP TRUNKING SERVICES MARKET, BY DEPLOYMENT TYPE, 2018-2032 (USD THOUSAND)
TABLE 99 MEXICO SIP TRUNKING SERVICES MARKET, BY ORGANIZATION SIZE, 2018-2032 (USD THOUSAND)
TABLE 100 MEXICO LARGE ENTERPRISE IN SIP TRUNKING SERVICES MARKET, BY TYPE, 2018-2032 (USD THOUSAND)
TABLE 101 MEXICO SMALL AND MEDIUM ENTERPRISES (SMES) IN SIP TRUNKING SERVICES MARKET, BY TYPE, 2018-2032 (USD THOUSAND)
TABLE 102 MEXICO SIP TRUNKING SERVICES MARKET, BY CONNECTIVITY, 2018-2032 (USD THOUSAND)
TABLE 103 MEXICO COMMERCIAL IN SIP TRUNKING SERVICES MARKET, BY SERVICE TYPE, 2018-2032 (USD THOUSAND)
TABLE 104 MEXICO SIP TRUNKING SERVICES MARKET, BY APPLICATION, 2018-2032 (USD THOUSAND)
TABLE 105 MEXICO ENTERPRISE TELEPHONY IN SIP TRUNKING SERVICES MARKET, BY TYPE, 2018-2032 (USD THOUSAND)
TABLE 106 MEXICO DISASTER RECOVERY & BUSINESS CONTINUITY IN SIP TRUNKING SERVICES MARKET, BY TYPE, 2018-2032 (USD THOUSAND)
TABLE 107 MEXICO GLOBAL/INTERNATIONAL COMMUNICATION IN SIP TRUNKING SERVICES MARKET, BY TYPE, 2018-2032 (USD THOUSAND)
TABLE 108 MEXICO SIP TRUNKING SERVICES MARKET, BY PRICING, 2018-2032 (USD THOUSAND)
TABLE 109 MEXICO SIP TRUNKING SERVICES MARKET, BY OPERATING MODEL, 2018-2032 (USD THOUSAND)
TABLE 110 MEXICO SIP TRUNKING SERVICES MARKET, BY END-USER, 2018-2032 (USD THOUSAND)
TABLE 111 MEXICO BANKING, FINANCIAL SERVICE & INSURANCE IN SIP TRUNKING SERVICES MARKET, BY USAGE, 2018-2032 (USD THOUSAND)
TABLE 112 MEXICO BANKING, FINANCIAL SERVICE & INSURANCE IN SIP TRUNKING SERVICES MARKET, BY CONNECTIVITY, 2018-2032 (USD THOUSAND)
TABLE 113 MEXICO IT AND TELECOMMUNICATION IN SIP TRUNKING SERVICES MARKET, BY USAGE, 2018-2032 (USD THOUSAND)
TABLE 114 MEXICO IT AND TELECOMMUNICATION IN SIP TRUNKING SERVICES MARKET, BY CONNECTIVITY, 2018-2032 (USD THOUSAND)
TABLE 115 MEXICO HEALTHCARE AND LIFE SCIENCES IN SIP TRUNKING SERVICES MARKET, BY USAGE, 2018-2032 (USD THOUSAND)
TABLE 116 MEXICO HEALTHCARE AND LIFE SCIENCES IN SIP TRUNKING SERVICES MARKET, BY CONNECTIVITY, 2018-2032 (USD THOUSAND)
TABLE 117 MEXICO GOVERNMENT AND PUBLIC SECTOR IN SIP TRUNKING SERVICES MARKET, BY USAGE, 2018-2032 (USD THOUSAND)
TABLE 118 MEXICO GOVERNMENT AND PUBLIC SECTOR IN SIP TRUNKING SERVICES MARKET, BY CONNECTIVITY, 2018-2032 (USD THOUSAND)
TABLE 119 MEXICO RETAIL AND E-COMMERCE IN SIP TRUNKING SERVICES MARKET, BY USAGE, 2018-2032 (USD THOUSAND)
TABLE 120 MEXICO RETAIL AND E-COMMERCE IN SIP TRUNKING SERVICES MARKET, BY CONNECTIVITY, 2018-2032 (USD THOUSAND)
TABLE 121 MEXICO MANUFACTURING IN SIP TRUNKING SERVICES MARKET, BY USAGE, 2018-2032 (USD THOUSAND)
TABLE 122 MEXICO MANUFACTURING IN SIP TRUNKING SERVICES MARKET, BY CONNECTIVITY, 2018-2032 (USD THOUSAND)
TABLE 123 MEXICO MEDIA AND ENTERTAINMENT IN SIP TRUNKING SERVICES MARKET, BY USAGE, 2018-2032 (USD THOUSAND)
TABLE 124 MEXICO MEDIA AND ENTERTAINMENT IN SIP TRUNKING SERVICES MARKET, BY CONNECTIVITY, 2018-2032 (USD THOUSAND)
TABLE 125 MEXICO EDUCATION AND RESEARCH IN SIP TRUNKING SERVICES MARKET, BY USAGE, 2018-2032 (USD THOUSAND)
TABLE 126 MEXICO EDUCATION AND RESEARCH IN SIP TRUNKING SERVICES MARKET, BY CONNECTIVITY, 2018-2032 (USD THOUSAND)
TABLE 127 MEXICO HOTELS AND HOSPITALITY IN SIP TRUNKING SERVICES MARKET, BY USAGE, 2018-2032 (USD THOUSAND)
TABLE 128 MEXICO HOTELS AND HOSPITALITY IN SIP TRUNKING SERVICES MARKET, BY CONNECTIVITY, 2018-2032 (USD THOUSAND)
TABLE 129 MEXICO LOGISTICS AND TRANSPORTATION IN SIP TRUNKING SERVICES MARKET, BY CONNECTIVITY, 2018-2032 (USD THOUSAND)
List of Figure
FIGURE 1 NORTH AMERICA SIP TRUNKING SERVICES MARKET
FIGURE 2 NORTH AMERICA SIP TRUNKING SERVICES MARKET: DATA TRIANGULATION
FIGURE 3 NORTH AMERICA SIP TRUNKING SERVICES MARKET: DROC ANALYSIS
FIGURE 4 NORTH AMERICA SIP TRUNKING SERVICES MARKET: GLOBAL VS REGIONAL MARKET ANALYSIS
FIGURE 5 NORTH AMERICA SIP TRUNKING SERVICES MARKET: COMPANY RESEARCH ANALYSIS
FIGURE 6 NORTH AMERICA SIP TRUNKING SERVICES MARKET: MULTIVARIATE MODELLING
FIGURE 7 NORTH AMERICA SIP TRUNKING SERVICES MARKET: INTERVIEW DEMOGRAPHICS
FIGURE 8 NORTH AMERICA SIP TRUNKING SERVICES MARKET: DBMR MARKET POSITION GRID
FIGURE 9 NORTH AMERICA SIP TRUNKING SERVICES MARKET: MARKET END USER COVERAGE GRID
FIGURE 10 EXECUTIVE SUMMARY
FIGURE 11 NORTH AMERICA SIP TRUNKING SERVICES MARKET: SEGMENTATION
FIGURE 12 THREE SEGMENTS COMPRISE THE NORTH AMERICA SIP TRUNKING SERVICES MARKET, BY DEPLOYMENT TYPE
FIGURE 13 STRATEGIC DECISIONS
FIGURE 14 INCREASING ADOPTION OF CLOUD SOLUTIONS AND CONTACT CENTERS IS EXPECTED TO DRIVE THE NORTH AMERICA SIP TRUNKING SERVICES MARKET IN THE FORECAST PERIOD
FIGURE 15 ON-PREMISE SEGMENT IS EXPECTED TO ACCOUNT FOR THE LARGEST SHARE OF THE NORTH AMERICA SIP TRUNKING SERVICES MARKET IN 2025 AND 2032
FIGURE 16 DRIVERS, RESTRAINTS, OPPORTUNITIES AND CHALLENGES OF THE NORTH AMERICA SIP TRUNKING SERVICES MARKET
FIGURE 17 NORTH AMERICA SIP TRUNKING SERVICES MARKET: BY DEPLOYMENT MODEL, 2024..
FIGURE 18 NORTH AMERICA SIP TRUNKING SERVICES MARKET: BY ORGANIZATION SIZE, 2024
FIGURE 19 NORTH AMERICA SIP TRUNKING SERVICES MARKET: BY CONNECTIVITY, 2024
FIGURE 20 NORTH AMERICA SIP TRUNKING SERVICES MARKET: BY SERVICE TYPE, 2024
FIGURE 21 NORTH AMERICA SIP TRUNKING SERVICES MARKET: BY APPLICATION, 2024
FIGURE 22 NORTH AMERICA SIP TRUNKING SERVICES MARKET: BY PRICING, 2024
FIGURE 23 NORTH AMERICA SIP TRUNKING SERVICES MARKET: BY OPERATING MODEL, 2024
FIGURE 24 NORTH AMERICA SIP TRUNKING SERVICES MARKET: BY END-USER, 2024
FIGURE 25 NORTH AMERICA SIP TRUNKING SERVICES MARKET: SNAPSHOT (2024)
FIGURE 26 NORTH AMERICA SIP TRUNKING SERVICES MARKET: COMPANY SHARE 2024 (%)
Data collection and base year analysis are done using data collection modules with large sample sizes. The stage includes obtaining market information or related data through various sources and strategies. It includes examining and planning all the data acquired from the past in advance. It likewise envelops the examination of information inconsistencies seen across different information sources. The market data is analysed and estimated using market statistical and coherent models. Also, market share analysis and key trend analysis are the major success factors in the market report. To know more, please request an analyst call or drop down your inquiry.
The key research methodology used by DBMR research team is data triangulation which involves data mining, analysis of the impact of data variables on the market and primary (industry expert) validation. Data models include Vendor Positioning Grid, Market Time Line Analysis, Market Overview and Guide, Company Positioning Grid, Patent Analysis, Pricing Analysis, Company Market Share Analysis, Standards of Measurement, Global versus Regional and Vendor Share Analysis. To know more about the research methodology, drop in an inquiry to speak to our industry experts.
Data Bridge Market Research is a leader in advanced formative research. We take pride in servicing our existing and new customers with data and analysis that match and suits their goal. The report can be customized to include price trend analysis of target brands understanding the market for additional countries (ask for the list of countries), clinical trial results data, literature review, refurbished market and product base analysis. Market analysis of target competitors can be analyzed from technology-based analysis to market portfolio strategies. We can add as many competitors that you require data about in the format and data style you are looking for. Our team of analysts can also provide you data in crude raw excel files pivot tables (Fact book) or can assist you in creating presentations from the data sets available in the report.


