
North America Structural Health Monitoring Market Analysis and Insights
Manufacturers are continuously trying to find ways to increase the precision of work, enhance services, and safety, and work with growing technology. The requirement for these reasons is being fulfilled by implementing structural health monitoring as they are used to provide enhanced, uninterrupted, free, and timely services at the end user applications. Structural health monitoring in the infrastructure industry is being used widely for structural health monitoring solutions and the rising adoption of digital technologies in the industrial sector. Structural health monitoring helps operators make better decisions around supply chain, machinery, assets performance, drilling, and others. The North America structural health monitoring market is expected to grow due to growing digitization in the construction industry.
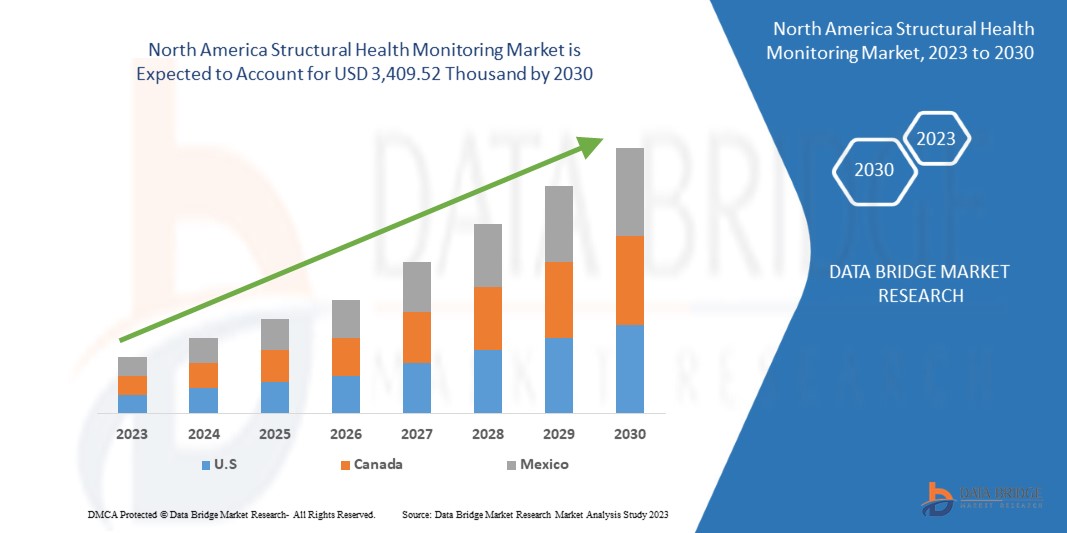
Data Bridge Market Research analyzes that the North America structural health monitoring market is expected to reach the value of USD 3,409.52 thousand by 2030, at a CAGR of 18.0% during the forecast period.
|
Report Metric |
Details |
|
Forecast Period |
2023 to 2030 |
|
Base Year |
2022 |
|
Historic Years |
2021 (Customizable to 2015-2020) |
|
Quantitative Units |
Revenue in USD Million, Pricing in USD |
|
Segments Covered |
By Type (Hardware, Software, and Services), Connectivity (Wired and Wireless), Installation Type (New installation and Retrofit), Method (Visual Inspection and Non-Destructive Evaluation), Application (Damage Detection, Crack Detection, Strain Monitoring, Wire Break Monitoring, Leakage Detection, Multimodal Sensing, Corrosion Detection, Hotspot Monitoring, Impact Monitoring, and Deflection Monitoring), End User (Civil, Aerospace, Energy, Mining, Marine, Industrial, Offshore Platform, Defense, School, Public Park and Recreation, Automotive, and Others) |
|
Countries Covered |
U.S., Canada, and Mexico |
|
Market Players Covered |
GEOKON, Campbell Scientific, Inc., SIXENSE Systems, Kinemetrics, Digitexx Data Systems, Inc., NATIONAL INSTRUMENTS CORP., OSMOS Group SA, HBK, Nova Ventures, Acellent Technologies Inc., James Fisher and Sons plc., SODIS Lab, GoeSIG Ltd, STRUCTURAL MONITORING SYSTEMS PLC., FEAC Engineering, Xylem Inc., Sisgeo S.r.l., FIRST SENSOR AG, Digitex, Geomotion Singapore, and COWI A/S, among others. |
North America Structural Health Monitoring Market Definition
Structural health monitoring (SHM) monitors changes in the material and geometric qualities of engineering structures, such as bridges and buildings, over time using periodically sampled response measurements. The output of this process is periodically updated information regarding the ability of the structure to perform its intended function in light of the inevitable aging and degradation resulting from operational environments for long-term structural health monitoring. After extreme events, such as earthquakes or blast loading, structural health monitoring is used for rapid condition screening and aims to provide, in near real-time, reliable information regarding the integrity of the structure.
Structural health monitoring offers the following numerous benefits to the customers: forecast and measures profits, Integrate and augment systems, track and measure construction activities, manage risk portfolio, boost revenue and enhance productivity, enable remote operations, reduce manual interactions, automate decisions, and others. Structural health monitoring simplifies communications between the system and the operators. It is helping the laborers to enhance their productivity and to optimize cost and operations.
North America Structural Health Monitoring Market Dynamics
This section deals with understanding the market drivers, advantages, opportunities, restraints, and challenges. All of this is discussed in detail below:
Drivers
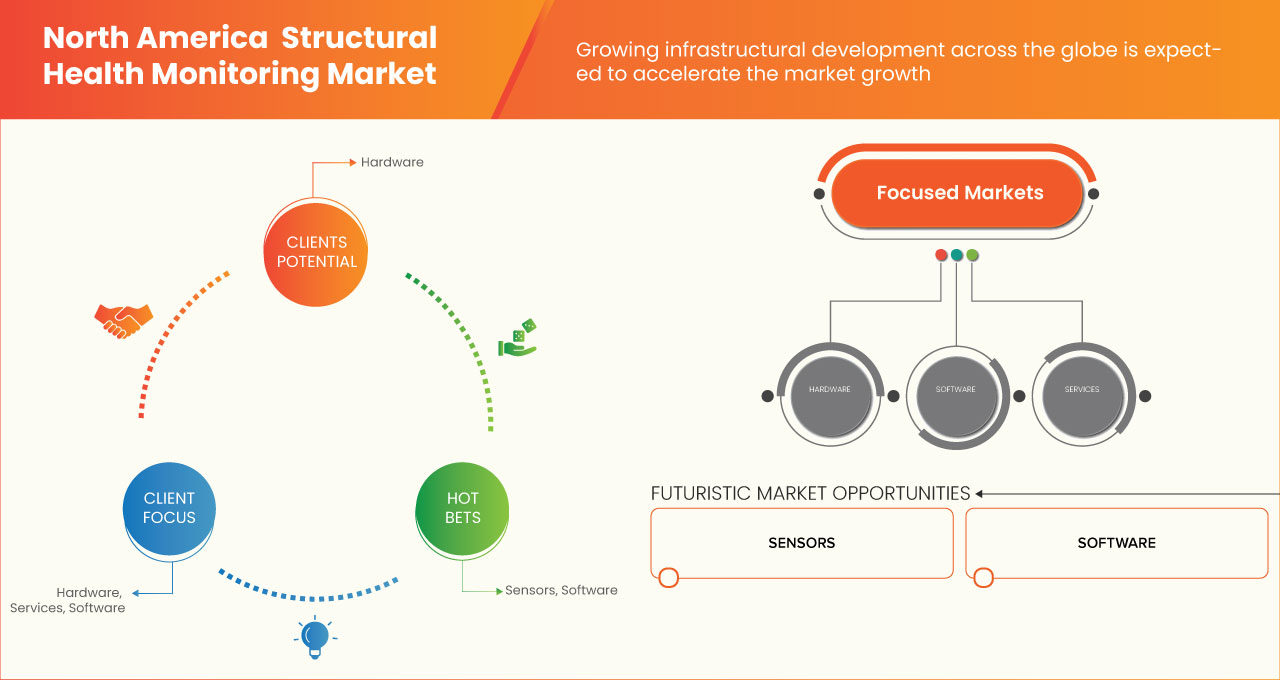
- GROWING INFRASTRUCTURAL DEVELOPMENT ACROSS THE GLOBE
Structural health monitoring (SHM) is a range of systems implemented on full-scale civil infrastructures to assist and inform operators about the continued 'fitness for purpose' of structures under gradual or sudden changes to their state and to learn about either or both of the load and response mechanisms.
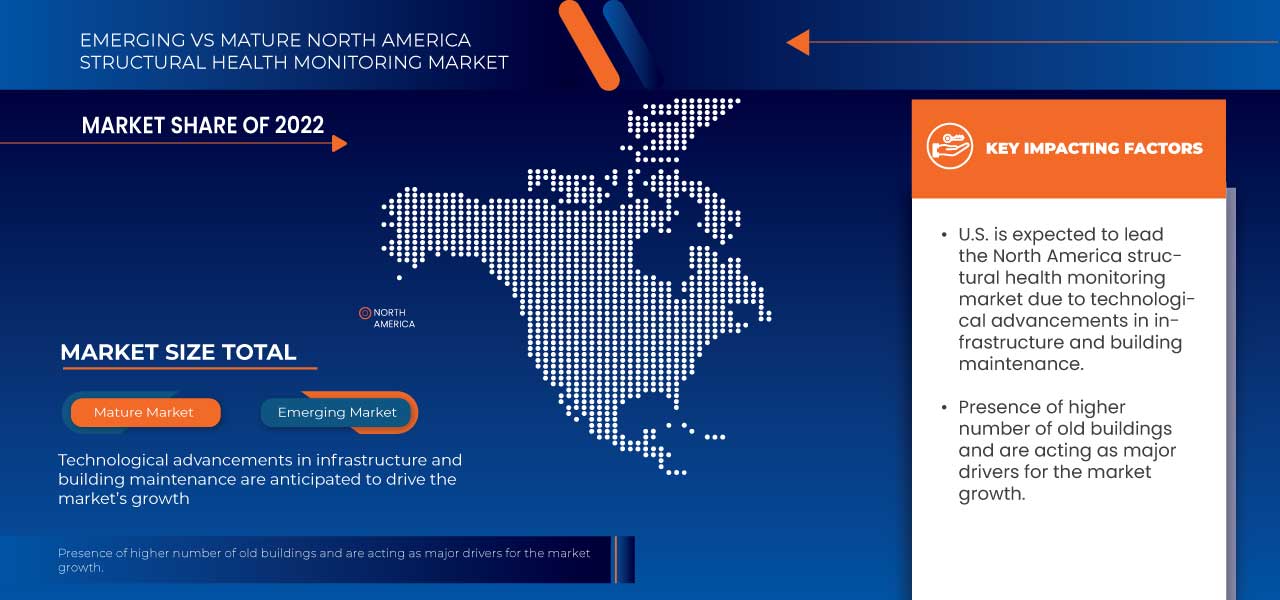
Infrastructure plays a critical role in economic and social development across the globe. It has huge importance in both developed and developing economies. The impact of seismic transformation in the economy has changed citizens' perspectives.
The importance of infrastructure is widely recognized and well-researched. However, there have been relatively few attempts to track and monitor infrastructure investment across countries where studies have assessed North America infrastructure needs; the adoption of myriad definitions and approaches has consistently made monitoring trends difficult. The various initiatives and developments in infrastructure across the globe are expected to drive the growth of the North America structural health monitoring market.
Restraint
- HIGH INSTALLATION AND MONITORING COSTS
The need and requirement for structural health monitoring systems have increased due to rapid digitalization and improved industrialization. Most complicated civil structures need structural health monitoring systems. But small structures cannot manage the structural health monitoring systems' installation cost and maintenance charges. As the need increases, the raw materials cost for structural health monitoring systems gradually increases.
Both capital expenditure (CAPEX) and operational expenditure (OPEX) are essential for structural health monitoring systems. The initial procurement of structural health monitoring systems, huge cabinets, and monitoring software is included in CAPEX. Structural health monitoring systems cost more than others because they require huge cabinets containing modules that allow growth. As a result, organizations must plan for their desired capacity to reap the full benefits of structural health monitoring systems. Structural health monitoring units require ongoing, high-cost maintenance after installation. High-complexity structures necessitate high-efficiency instrumentation, which raises total costs. Furthermore, the expenditures of monitoring are quite significant. Also, structural health monitoring systems involve costing issues in the maintenance and upgradation of the system, which is projected to restrain the market.
Opportunity
INTEGRATION OF TECHNOLOGICALLY ADVANCED SOLUTIONS FOR STRUCTURAL HEALTH MONITORING
Business process automation uses technology to execute recurring tasks or processes in a business where manual effort can be replaced. It is done to minimize costs, increase efficiency, and streamline processes. Digital transformation has been a top priority for companies in recent years, but now many businesses are taking a closer look at the actively evolving concept of digitalization.
Structural health monitoring implements a damage detection strategy for aerospace, civil and mechanical engineering infrastructure. Advances in sensors and information technologies have brought structural health monitoring (SHM) a data-driven remedy for civil infrastructure safety. Typical damage experienced by this infrastructure might be the development of fatigue cracks, degradation of structural connections, or bearing wear in rotating machinery. This application's structural health monitoring solution will integrate structural dynamics, wireless data acquisition, local actuation, micro-electromechanical systems (MEMS) technology, and statistical pattern recognition algorithms.
In a sense, the new integrated technologies involve the usage of ultrasonic, dye penetration, and fibroscopy, among others. The involvement of these integrated technologies does not cause any defect or damage to the critical structures because it is difficult to monitor the entire health of a structure using only one technique; the integration approach is the greatest instrument for structural health monitoring. As a result, many key players are focusing on developing cost-effective structural health monitoring solutions that incorporate electrical, magnetic, thermal, and other physical variables, chemical variables, and a variety of technologies to provide more accurate results, which is likely to boost the adoption of integrated structural health monitoring systems.
Challenge
LACK OF STANDARDIZATION IN MANAGING LARGE VOLUMES OF DATA
The lack of standardized terminology for categorizing and describing various interventions in the field of structural health monitoring involves structural factors, environmental factors, and others that are causing problems for the health of critical structures. The structural health monitoring solution installed places is classified depending upon the criticality of the civil structures and the location of the structures. Different structural health monitoring solutions, such as the sensor system, the data acquisition, and transmission system, the data management system, the condition evaluation system, and others, are used for different intense critical structures in dams, bridges, and other manufacturing industries. Therefore, standardization acts as the major factor that acts as a major challenge for the market.
The intensity of the critical civil structure determines the appropriate structural health monitoring solution to be used with standard harmonization. However, there are some differences in the product design, testing, and installation requirements between the business and the government system due to the difference in the classification of zones by manufacturers and regulatory bodies. The above factors led to the lack of standardization, which is challenging for the market.
Recent Developments
- In May 2021, Sisgeo S.r.l. introduced the MD-Profile gauges. The system is suitable for geotechnical and structural applications, for which vertical or horizontal accurate profiling is needed, to improve the product portfolio of the company.
- In November 2020, HBK updated or technically refined its compressive force transducer C10 to make it more cost-efficient due to increased precision. This helped the product as an ideal solution for demanding test branches, laboratory, and production applications.
North America Structural Health Monitoring Market Scope
North America structural health monitoring market is segmented into six notable segments such as type, connectivity, installation, method, application, and end user. The growth among segments helps you analyze niche pockets of growth and strategies to approach the market and determine your core application areas and the difference in your target markets.
NORTH AMERICA STRUCTURAL HEALTH MONITORING MARKET, BY TYPE
- Hardware
- Software
- Services
On the basis of type, the North America structural health monitoring market is segmented into hardware, software and services.
NORTH AMERICA STRUCTURAL HEALTH MONITORING MARKET, BY CONNECTIVITY
- Wired
- Wireless
On the basis of connectivity, the North America structural health monitoring market is segmented into wired and wireless.
NORTH AMERICA STRUCTURAL HEALTH MONITORING MARKET, BY INSTALLATION TYPE
- New Installation
- Retrofit
On the basis of installation, the North America structural health monitoring market is segmented into new installation and retrofit.
NORTH AMERICA STRUCTURAL HEALTH MONITORING MARKET, BY METHOD
- Visual Inspection
- Non-Destructive Evaluation (NDE)
On the basis of method, the North America structural health monitoring market is segmented into visual inspection and non-destructive evaluation.
NORTH AMERICA STRUCTURAL HEALTH MONITORING MARKET, BY APPLICATION
- Damage Detection
- Crack Detection
- Strain Monitoring
- Wire Break Monitoring
- Leakage Detection
- Multimodal Sensing
- Corrosion Monitoring
- Hotspot Monitoring
- Impact Monitoring
- Deflection Monitoring
On the basis of application, the North America structural health monitoring market is segmented into damage detection, crack detection, strain monitoring, wire break monitoring, leakage detection, multimodal sensing, corrosion monitoring, hotspot monitoring, impact monitoring and deflection monitoring.
NORTH AMERICA STRUCTURAL HEALTH MONITORING MARKET, BY END USER
- Civil
- Aerospace
- Energy
- Mining
- Marine
- Industrial
- Offshore Platform
- Defense
- Schools
- Public Parks And Recreation
- Automotive
- Others
On the basis of end user, the North America structural health monitoring market is segmented into civil, aerospace, energy, mining, marine, industrial, offshore platform, defense, school, public park & recreation, automotive and others.
North America Structural Health Monitoring Market Regional Analysis/Insights
The North America structural health monitoring market is categorized into six notable segments such as type, connectivity, installation type, method, application, and end user.
The countries covered in this market report U.S., Canada, and Mexico.
U.S. is expected to grow due to rise in technological advancement in structural health monitoring market.
The country section of the report also provides individual market impacting factors and changes in regulation in the market domestically that impact the current and future trends of the market. Data points such as new sales, replacement sales, country demographics, regulatory acts, and import-export tariffs are some of the major pointers used to forecast the market scenario for individual countries. In addition, presence and availability of North America brands and their challenges faced due to large or scarce competition from local and domestic brands, and impact of sales channels are considered while providing forecast analysis of the country data.
Competitive Landscape and North America Structural Health Monitoring Market Share Analysis
North America structural health monitoring market competitive landscape provides details by competitor. Details included are company overview, company financials, revenue generated, market potential, investment in R&D, new market initiatives, production sites and facilities, company strengths and weaknesses, product launch, product approvals, product width and breath, application dominance, product type lifeline curve. The above data points provided are only related to the company’s focus on the North America structural health monitoring market.
Some of the major players operating in the structural health monitoring market are GEOKON, Campbell Scientific, Inc., SIXENSE Systems, Kinemetrics, Digitexx Data Systems, Inc., NATIONAL INSTRUMENTS CORP., OSMOS Group SA, HBK, Nova Ventures, Acellent Technologies Inc., James Fisher and Sons plc., SODIS Lab, GoeSIG Ltd, STRUCTURAL MONITORING SYSTEMS PLC., FEAC Engineering, Xylem Inc., Sisgeo S.r.l., FIRST SENSOR AG, Digitex, Geomotion Singapore, and COWI A/S, among others.
SKU-

- Interactive Data Analysis Dashboard
- Company Analysis Dashboard for high growth potential opportunities
- Research Analyst Access for customization & queries
- Competitor Analysis with Interactive dashboard
- Latest News, Updates & Trend analysis
- Harness the Power of Benchmark Analysis for Comprehensive Competitor Tracking
Table of Content
- introduction
- OBJECTIVES OF THE STUDY
- MARKET DEFINITION
- OVERVIEW OF NORTH AMERICA STRUCTURAL HEALTH MONITORING MARKET
- Currency and Pricing
- LIMITATIONS
- MARKETS COVERED
- MARKET SEGMENTATION
- MARKETS COVERED
- geographicAL scope
- years considered for the study
- DBMR TRIPOD DATA VALIDATION MODEL
- primary interviews with key opinion leaders
- DBMR MARKET POSITION GRID
- Multivariate Modeling
- type timeline curve
- MARKET APPLICATION COVERAGE GRID
- secondary sourcEs
- assumptions
- EXECUTIVE SUMMARY
- premium insights
- market overview
- drivers
- GROWING INFRASTRUCTURAL DEVELOPMENT
- INCREASING AUTOMATION, AND STANDARDIZATION IN MAINTENANCE & REPAIR OF CIVIL INFRASTRUCTURE
- GROWING ADVANCEMENT IN SENSOR TECHNOLOGIES
- IMPROVED SAFETY, AND MAINTAINABILITY OF CRITICAL STRUCTURES
- RESTRAINTS
- HIGH INSTALLATION, AND MONITORING COSTS
- INACCURATE RESULTS DUE TO CALIBRATION ERRORS
- FLUCTUATING PRICES OF RAW MATERIALS
- OPPORTUNITIES
- INTEGRATION OF TECHNOLOGICALLY ADVANCED SOLUTIONS FOR STRUCTURAL HEALTH MONITORING
- GROWTH IN INVESTMENTS IN INFRASTRUCTURE, AND ADVANCES IN WIRELESS SENSOR NETWORKS
- INCREASE IN VARIOUS STRATEGIC DECISIONS, SUCH AS PARTNERSHIP, AND ACQUISITION
- CHALLENGES
- REQUIREMENT OF SKILLED OPERATORS FOR INSTALLATION, AND CALIBRATION OF STRUCTURAL HEALTH MONITORING INSTRUMENTS
- LACK OF STANDARDIZATION IN MANAGING LARGE VOLUMES OF DATA
- TECHNICAL CHALLENGES, AND OPERATIONAL FACTORS
- IMPACT OF COVID-19 PANDEMIC ON NORTH AMERICA STRUCTURAL HEALTH MONITORING MARKET
- AFTERMATH OF COVID-19 AND GOVERNMENT INITIATIVES TO BOOST THE MARKET
- STRATEGIC DECISIONS FOR MANUFACTURERS AFTER COVID-19 TO GAIN COMPETITIVE MARKET SHARE
- IMPACT ON DEMAND
- IMPACT ON PRICE
- IMPACT ON SUPPLY CHAIN
- CONCLUSION
- NORTH AMERICA structural health monitoring market, BY Type
- overview
- Hardware
- SENSORS
- ACCELEROMETERS
- ULTRASONIC SENSORS
- TEMPERATURE SENSORS
- STRAIN GAUGES
- CORROSION SENSORS
- DISPLACEMENT SENSORS
- INCLINOMETERS AND TILT METERS
- SEISMOMETERS
- OTHERS
- DATA ACQUISITION UNITS
- AMPLIFIERS
- CAMERA
- OTHERS
- SOFTWARE
- SERVICES
- INSTALLATION
- PRE INSTALLATION
- POST INSTALLATION
- DESIGN AND CONSULTING
- MAINTENANCE
- NORTH AMERICA structural health monitoring market, BY CONNECTIVITY
- overview
- WIRED
- WIREless
- NORTH AMERICA structural health monitoring market, BY installation type
- overview
- New installation
- retrofit
- NORTH AMERICA structural health monitoring market, BY method
- overview
- visual inspection
- DATA-BASED TECHNIQUES
- MODEL BASED TECHNIQUES
- NON-DESTRUCTIVE EVALUATION (NDE)
- NORTH AMERICA structural health monitoring market, BY APPLICATION
- overview
- damage detection
- crack detection
- strain monitoring
- wire break monitoring
- in post tension concrete structure
- suspension and cable stay bridges
- leakage detection
- multimodal sensing
- corrosion monitoring
- hotspot monitoring
- impact monitoring
- deflection monitoring
- North America structural health monitoring market, BY end user
- overview
- civil
- buildings
- bridges
- tunnels
- dams
- roads
- stadium
- others
- AEROSPACE
- energy
- wind turbine
- others
- mining
- marine
- industrial
- offshore platform
- defense
- school
- public parks and recreation
- automotive
- others
- North America structural health monitoring market, by REGION
- NORTH AMERICA
- U.S.
- Canada
- Mexico
- North America Structural Health monitoring Market: COMPANY landscape
- company share analysis: North america
- swot analysis
- company profile
- NATIONAL INSTRUMENTS CORP.
- COMPANY SNAPSHOT
- REVENUE ANALYSIS
- PRODUCT PORTFOLIO
- RECENT DEVELOPMENTS
- XYLEM INC.
- COMPANY SNAPSHOT
- rEVENUE ANALYSIS
- PRODUCT PORTFOLIO
- RECENT DEVELOPMENT
- COWI A/S
- COMPANY SNAPSHOT
- REVENUE ANALYSIS
- PRODUCT PORTFOLIO
- RECENT DEVELOPMENT
- James Fisher AND sons plc.
- COMPANY snapshot
- REVENUE ANALYSIS
- PRODUCT PORTFOLIO
- recent DEVELOPMENTS
- FIRST SENSOR AG
- COMPANY SNAPSHOT
- REVENUE ANALYSIS
- PRODUCT PORTFOLIO
- RECENT DEVELOPMENTS
- ACELLENT TECHNOLOGIES INC.
- COMPANY snapshot
- PRODUCT PORTFOLIO
- recent DEVELOPMENTS
- CAMPBELL SCIENTIFIC, INC.
- COMPANY SNAPSHOT
- PRODUCT PORTFOLIO
- RECENT DEVELOPMENTS
- DIGITEX
- COMPANY SNAPSHOT
- PRODUCT PORTFOLIO
- RECENT DEVELOPMENT
- DIGITEXX DATA SYSTEMS, INC.
- COMPANY SNAPSHOT
- Product Portfolio
- RECENT DEVELOPMENT
- gEOKON
- COMPANY SNAPSHOT
- PRODUCT PORTFOLIO
- RECENT DEVELOPMENTS
- GEOSIG LTD
- COMPANY SNAPSHOT
- PRODUCT PORTFOLIO
- RECENT DEVELOPMENTS
- HBK
- COMPANY snapshot
- PRODUCT PORTFOLIO
- recent DEVELOPMENTs
- KINEMETRICS
- COMPANY SNAPSHOT
- Product Portfolio
- RECENT DEVELOPMENTS
- nova ventures
- COMPANY snapshot
- PRODUCT PORTFOLIO
- recent DEVELOPMENTs
- OSMOS GROUP SA
- COMPANY snapshot
- PRODUCT PORTFOLIO
- recent DEVELOPMENTs
- SISGEO S.R.L.
- COMPANY SNAPSHOT
- PRODUCT PORTFOLIO
- RECENT DEVELOPMENTS
- SIXENSE Systems
- COMPANY SNAPSHOT
- PRODUCT PORTFOLIO
- RECENT DEVELOPMENT
- STRUCTURAL MONITORING SYSTEMS PLC.
- COMPANY SNAPSHOT
- REVENUE ANALYSIS
- PRODUCT PORTFOLIO
- RECENT DEVELOPMENT
- questionnaire
- related reports
List of Table
TABLE 1 North America Structural Health Monitoring Market, By Type , 2019-2028 (USD Million)
TABLE 2 North America Hardware in Structural Health Monitoring Market, By Type, 2019-2028 (USD Million)
TABLE 3 North America Sensors in Structural Health Monitoring Market, By Type, 2019-2028 (USD Million)
TABLE 4 North America Services in Structural Health Monitoring Market, By Type, 2019-2028 (USD Million)
TABLE 5 North America Installation in Structural Health Monitoring Market, By Type, 2019-2028 (USD Million)
TABLE 6 North America Structural Health Monitoring Market, By Connectivity, 2019-2028 (USD Million)
TABLE 7 North America Structural Health Monitoring Market, By Installation type, 2019-2028 (USD Million)
TABLE 8 North America Structural Health Monitoring Market, By Method, 2019-2028 (USD Million)
TABLE 9 North America Visual Inspection in Structural Health Monitoring Market, By Type, 2019-2028 (USD Million)
TABLE 10 North America Structural Health Monitoring Market, By Application, 2019-2028 (USD Million)
TABLE 11 North America Wire Break Monitoring in North America Structural Health Monitoring Market, By Type, 2019-2028 (USD Million)
TABLE 12 North America Structural Health Monitoring Market, By End User, 2019-2028 (USD Million)
TABLE 13 North America Civil in Structural Health Monitoring Market, By Type, 2019-2028 (USD Million)
TABLE 14 North America Energy in Structural Health Monitoring Market, By Type, 2019-2028 (USD Million)
TABLE 15 North America structural health monitoring market, By country, 2019-2028 (USD million)
TABLE 16 North America structural health monitoring market, By Type, 2019-2028 (USD million)
TABLE 17 North America hardware in structural health monitoring market, By Type, 2019-2028 (USD million)
TABLE 18 North America sensors in structural health monitoring market, By type, 2019-2028 (USD million)
TABLE 19 North America services in structural health monitoring market, By type, 2019-2028 (USD million)
TABLE 20 North America installation in structural health monitoring market, By type, 2019-2028 (USD million)
TABLE 21 North America structural health monitoring market, By connectivity, 2019-2028 (USD million)
TABLE 22 North America structural health monitoring market, By installation type, 2019-2028 (USD million)
TABLE 23 North America structural health monitoring market, By method, 2019-2028 (USD million)
TABLE 24 North America visual inspection in structural health monitoring market, By type, 2019-2028 (USD million)
TABLE 25 North America structural health monitoring market, By application, 2019-2028 (USD million)
TABLE 26 North America wire break monitoring in structural health monitoring market, By type, 2019-2028 (USD million)
TABLE 27 North America structural health monitoring market, By end user, 2019-2028 (USD million)
TABLE 28 North America civil in structural health monitoring market, By type, 2019-2028 (USD million)
TABLE 29 North America energy in structural health monitoring market, By type, 2019-2028 (USD million)
TABLE 30 U.S. structural health monitoring market, By Type, 2019-2028 (USD million)
TABLE 31 U.S. hardware in structural health monitoring market, By Type, 2019-2028 (USD million)
TABLE 32 U.S. sensors in structural health monitoring market, By type, 2019-2028 (USD million)
TABLE 33 U.S. services in structural health monitoring market, By type, 2019-2028 (USD million)
TABLE 34 U.S. installation in structural health monitoring market, By type, 2019-2028 (USD million)
TABLE 35 U.S. structural health monitoring market, By connectivity, 2019-2028 (USD million)
TABLE 36 U.S. structural health monitoring market, By installation type, 2019-2028 (USD million)
TABLE 37 U.S. structural health monitoring market, By method, 2019-2028 (USD million)
TABLE 38 U.S. visual inspection in structural health monitoring market, By type, 2019-2028 (USD million)
TABLE 39 U.S. structural health monitoring market, By application, 2019-2028 (USD million)
TABLE 40 U.S. wire break monitoring in structural health monitoring market, By type, 2019-2028 (USD million)
TABLE 41 U.S. structural health monitoring market, By end user, 2019-2028 (USD million)
TABLE 42 U.S. civil in structural health monitoring market, By type, 2019-2028 (USD million)
TABLE 43 U.S. energy in structural health monitoring market, By type, 2019-2028 (USD million)
TABLE 44 Canada structural health monitoring market, By Type, 2019-2028 (USD million)
TABLE 45 Canada hardware in structural health monitoring market, By Type, 2019-2028 (USD million)
TABLE 46 Canada sensors in structural health monitoring market, By type, 2019-2028 (USD million)
TABLE 47 Canada services in structural health monitoring market, By type, 2019-2028 (USD million)
TABLE 48 Canada installation in structural health monitoring market, By type, 2019-2028 (USD million)
TABLE 49 Canada structural health monitoring market, By connectivity, 2019-2028 (USD million)
TABLE 50 Canada structural health monitoring market, By installation type, 2019-2028 (USD million)
TABLE 51 Canada structural health monitoring market, By method, 2019-2028 (USD million)
TABLE 52 Canada visual inspection in structural health monitoring market, By type, 2019-2028 (USD million)
TABLE 53 Canada structural health monitoring market, By application, 2019-2028 (USD million)
TABLE 54 Canada wire break monitoring in structural health monitoring market, By type, 2019-2028 (USD million)
TABLE 55 Canada structural health monitoring market, By end user, 2019-2028 (USD million)
TABLE 56 Canada civil in structural health monitoring market, By type, 2019-2028 (USD million)
TABLE 57 Canada energy in structural health monitoring market, By type, 2019-2028 (USD million)
TABLE 58 Mexico structural health monitoring market, By Type, 2019-2028 (USD million)
TABLE 59 Mexico hardware in structural health monitoring market, By Type, 2019-2028 (USD million)
TABLE 60 Mexico sensors in structural health monitoring market, By type, 2019-2028 (USD million)
TABLE 61 Mexico services in structural health monitoring market, By type, 2019-2028 (USD million)
TABLE 62 Mexico installation in structural health monitoring market, By type, 2019-2028 (USD million)
TABLE 63 Mexico structural health monitoring market, By connectivity, 2019-2028 (USD million)
TABLE 64 Mexico structural health monitoring market, By installation type, 2019-2028 (USD million)
TABLE 65 Mexico structural health monitoring market, By method, 2019-2028 (USD million)
TABLE 66 Mexico visual inspection in structural health monitoring market, By type, 2019-2028 (USD million)
TABLE 67 Mexico structural health monitoring market, By application, 2019-2028 (USD million)
TABLE 68 Mexico wire break monitoring in structural health monitoring market, By type, 2019-2028 (USD million)
TABLE 69 Mexico structural health monitoring market, By end user, 2019-2028 (USD million)
TABLE 70 Mexico civil in structural health monitoring market, By type, 2019-2028 (USD million)
TABLE 71 Mexico energy in structural health monitoring market, By type, 2019-2028 (USD million)
List of Figure
FIGURE 1 NORTH AMERICA Structural health monitoring MARKET: segmentation
FIGURE 2 North America Structural health monitoring market: data triangulation
FIGURE 3 North America Structural health monitoring market: DROC ANALYSIS
FIGURE 4 North America Structural health monitoring market: NORTH AMERICA VS REGIONAL MARKET ANALYSIS
FIGURE 5 North America Structural health monitoring market: COMPANY RESEARCH ANALYSIS
FIGURE 6 North America Structural health monitoring market: INTERVIEW DEMOGRAPHICS
FIGURE 7 North America Structural health monitoring market: DBMR MARKET POSITION GRID
FIGURE 8 NORTH AMERICA Structural health monitoring Market: MARKET APPLICATION COVERAGE GRID
FIGURE 9 North America Structural health monitoring market: SEGMENTATION
FIGURE 10 GROWING INFRASTRUCTURAL DEVELOPMENT AND IMPROVED SAFETY, AND MAINTAINABILITY OF CRITICAL STRUCTURES ARE EXPECTED TO DRIVE THE NORTH AMERICA STRUCTURAL HEALTH MONITORING MARKET IN THE FORECAST PERIOD OF 2021 TO 2028
FIGURE 11 HARDWARE segment is expected to account for the largest share of North America Structural health monitoring market in 2021 & 2028
FIGURE 12 DRIVERS, RESTRAINTS, OPPORTUNITIES, AND CHALLENGES OF NORTH AMERICA STRUCTURAL HEALTH MONITORING market
FIGURE 13 PRICE ANALYSIS OF I-35W ST. ANTHONY FALLS BRIDGE, LOCATED IN MINNEAPOLIS, U.S.
FIGURE 14 NORTH AMERICA structural health monitoring market: BY type, 2020
FIGURE 15 NORTH AMERICA structural health monitoring market: BY connectivity, 2020
FIGURE 16 NORTH AMERICA structural health monitoring market: BY installation type, 2020
FIGURE 17 NORTH AMERICA structural health monitoring market: BY METHOD, 2020
FIGURE 18 NORTH AMERICA structural health monitoring market: BY APPLICATION, 2020
FIGURE 19 NORTH AMERICA structural health monitoring market: BY end user, 2020
FIGURE 20 NORTH AMERICA structural health monitoring market: SNAPSHOT (2020)
FIGURE 21 NORTH AMERICA STRUCTURAL HEALTH MONITORING MARKET: by Country (2020)
FIGURE 22 NORTH AMERICA structural health monitoring market: by Country (2021 & 2028)
FIGURE 23 NORTH AMERICA structural health monitoring market: by Country (2020 & 2028)
FIGURE 24 NORTH AMERICA structural health monitoring market: by type (2021-2028)
FIGURE 25 North america structural health monitoring market: company share 2020 (%)
Data collection and base year analysis are done using data collection modules with large sample sizes. The stage includes obtaining market information or related data through various sources and strategies. It includes examining and planning all the data acquired from the past in advance. It likewise envelops the examination of information inconsistencies seen across different information sources. The market data is analysed and estimated using market statistical and coherent models. Also, market share analysis and key trend analysis are the major success factors in the market report. To know more, please request an analyst call or drop down your inquiry.
The key research methodology used by DBMR research team is data triangulation which involves data mining, analysis of the impact of data variables on the market and primary (industry expert) validation. Data models include Vendor Positioning Grid, Market Time Line Analysis, Market Overview and Guide, Company Positioning Grid, Patent Analysis, Pricing Analysis, Company Market Share Analysis, Standards of Measurement, Global versus Regional and Vendor Share Analysis. To know more about the research methodology, drop in an inquiry to speak to our industry experts.
Data Bridge Market Research is a leader in advanced formative research. We take pride in servicing our existing and new customers with data and analysis that match and suits their goal. The report can be customized to include price trend analysis of target brands understanding the market for additional countries (ask for the list of countries), clinical trial results data, literature review, refurbished market and product base analysis. Market analysis of target competitors can be analyzed from technology-based analysis to market portfolio strategies. We can add as many competitors that you require data about in the format and data style you are looking for. Our team of analysts can also provide you data in crude raw excel files pivot tables (Fact book) or can assist you in creating presentations from the data sets available in the report.


