
North America Surface Analysis Market
Market Size in USD Billion
 USD
2.50 Billion
USD
3.80 Billion
2024
2032
USD
2.50 Billion
USD
3.80 Billion
2024
2032
| 2025 - 2032 | |
| USD 2.50 Billion | |
| USD 3.80 Billion | |
| % | |
|
Surface Analysis Market Analysis
The North America surface analysis market is experiencing significant growth, driven by increasing demand for precise material characterization across industries such as semiconductors, pharmaceuticals, and aerospace. This market includes advanced techniques such as X-ray photoelectron spectroscopy (XPS), atomic force microscopy (AFM), and secondary ion mass spectrometry (SIMS), which enable detailed surface composition and structural analysis. Technological advancements, including AI-driven data interpretation, hybrid analysis techniques, and automation, are enhancing accuracy and efficiency. The market is further propelled by rising investments in R&D, expanding applications in nanotechnology, and growing regulatory requirements for material quality and safety.
Surface Analysis Market Size
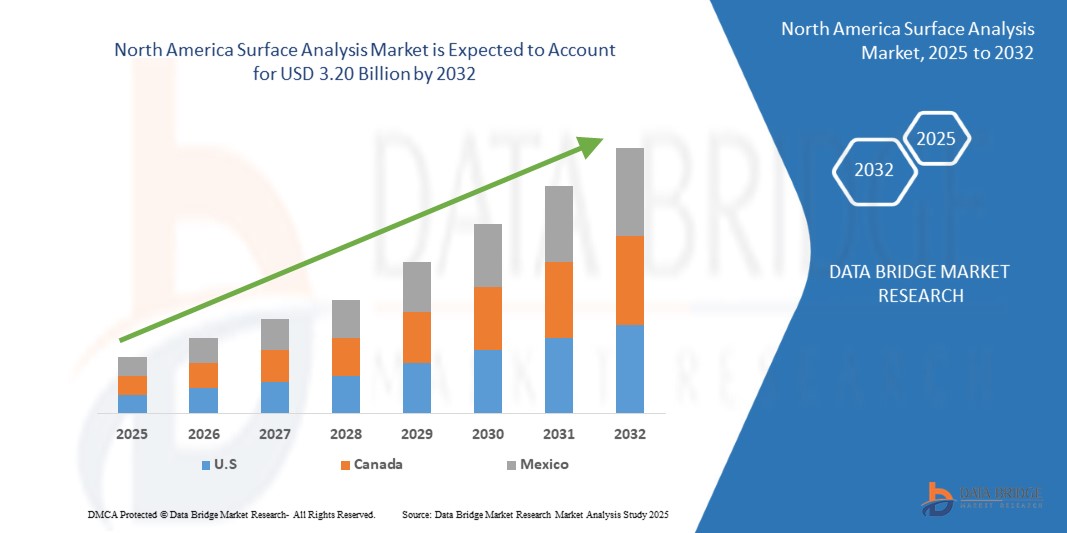
North America surface analysis market size was valued at USD 1.86 billion in 2024 and is projected to reach USD 3.20 billion by 2032, with a CAGR of 7.1% during the forecast period of 2025 to 2032. In addition to the insights on market scenarios such as market value, growth rate, segmentation, geographical coverage, and major players, the market reports curated by the Data Bridge Market Research also include in-depth expert analysis, import/export analysis, pricing analysis, production consumption analysis, and pestle analysis.
Surface Analysis Market Trends
“Rising Demand for High-Precision Material Characterization”
The increasing need for high-precision material characterization is driving advancements in the surface analysis market. Industries such as semiconductors, pharmaceuticals, and aerospace are demanding more accurate and reliable surface assessment techniques to ensure product quality and performance. Innovations in spectroscopy, microscopy, and mass spectrometry are enhancing analytical capabilities, enabling real-time, in-depth surface evaluations. Additionally, automation and AI-driven data processing are improving efficiency, reducing errors, and accelerating research and development processes. As regulatory standards for material integrity and safety tighten, the adoption of advanced surface analysis technologies is expected to grow, reinforcing their critical role across various high-tech sectors.
Report Scope and Surface Analysis Market Segmentation
|
Attributes |
Surface Analysis Key Market Insights |
|
Segments Covered |
|
|
Countries Covered |
U.S., Canada, and Mexico |
|
Key Market Players |
SERMA GROUP (France), Shimadzu Corporation (Japan), Eurofins Scientific (Luxembourg), Thermo Fisher Scientific Inc (U.S.), S A I Ltd (U.K.), SPECS GmbH (Germany), Physical Electronics, Inc. (PHI) (U.S.), Staib Instruments (Germany), Hiden Analytical (U.K.), Bruker (U.S.), HORIBA Group (Japan), JEOL Ltd (Japan), Carl Zeiss AG (Germany), TESCAN GROUP, a.s. (Czech Republic), TSI (U.S.), and Nikon Instruments Inc. (U.S.) |
|
Market Opportunities |
|
|
Value Added Data Infosets |
In addition to the insights on market scenarios such as market value, growth rate, segmentation, geographical coverage, and major players, the market reports curated by the Data Bridge Market Research also include depth expert analysis, patient epidemiology, pipeline analysis, pricing analysis, and regulatory framework. |
Surface Analysis Market Definition
Surface analysis is the study of a material’s outermost layer to determine its composition, structure, roughness, and chemical properties. It involves advanced techniques such as X-ray photoelectron spectroscopy (XPS), atomic force microscopy (AFM), and secondary ion mass spectrometry (SIMS) to analyze surfaces at microscopic and atomic levels. Surface analysis is essential in industries like semiconductors, pharmaceuticals, aerospace, and nanotechnology, where material properties significantly impact performance and reliability. By providing detailed insights into surface characteristics, this analysis helps improve product quality, optimize manufacturing processes, and ensure compliance with regulatory standards.
Surface Analysis Market Dynamics
Drivers
- Increase in the R&D Expenditure in Medical and Pharmaceutical Companies
As these industries focus on developing innovative drugs and medical devices, precise surface characterization is essential for ensuring product quality and regulatory compliance. This surge in R&D spending accelerates innovation in surface analysis, broadening its application in critical healthcare sectors. Moreover, increased funding has led to the development of state-of-the-art analytical instruments that offer higher resolution and sensitivity. These advancements enable companies to meet stringent regulatory standards while fostering breakthrough research in product development.
For instance,
- In April 2024, according to the article published by Deloitte, North America pharmaceutical companies increased their return on R&D investment to 4.1% in 2023, recovering from a record low. The top 20 pharma companies spent USD 145 billion on R&D, driven by complex trials and regulatory changes. This boost in innovation led to higher investments in quality control and process optimization. As a result, advanced analytical techniques, including surface analysis, gained importance for ensuring drug safety and performance, helping grow the surface analysis market
Growing Utilization of Surface Analysis Methods
The integration of surface analysis methods optimizes manufacturing processes by accurately detecting surface defects and ensuring consistency. This widespread use highlights the versatility of surface analysis tools and drives their market growth across diverse industrial applications. Additionally, technological improvements have reduced operational costs, making these techniques more accessible to a broader range of industries. The continual evolution of user-friendly software further enhances data interpretation and process control, boosting overall efficiency
For instance,
In March 2025, according to the article published by Elsevier Inc., researchers used AI-enhanced X-ray microscopy to non-destructively detect and quantify crystalline miconazole in amorphous solid dispersions. They combined advanced imaging with AI-assisted segmentation to obtain detailed particle size distributions and reduce human error. This technology improved quality control in drug manufacturing and demonstrated a clear benefit for precise surface analysis, which is expected to drive growth in the North America surface analysis market.
Opportunities
- Emerging Nanotechnology Offers Breakthrough Techniques in Analysis
Emerging nanotechnology drives innovation by enabling analysis at the atomic and molecular levels, providing unprecedented resolution and accuracy. This advancement allows for the detection and characterization of minute surface features that were previously inaccessible with conventional methods. As these nanotech-based techniques continue to evolve, they unlock new possibilities for material science and quality control, fueling the growth of surface analysis applications across various industries.
For Instance: -
- In June 2024, according to article published by, Springer Nature Limited, researchers used advanced environmental scanning electron microscopy (A-ESEM) to reveal the natural nano-morphology of condensed mitotic chromosomes. They applied machine learning to optimize conditions, allowing high-resolution imaging of sensitive, wet samples without damage. This breakthrough enabled the discovery of previously unobserved structural details on chromosome surfaces. The study demonstrated that nanotechnology offers significant opportunities to advance the surface analysis market
Strategic Partnerships and Mergers Accelerate Market Expansion
Strategic partnerships and mergers combine complementary expertise and resources, creating synergistic benefits that drive market growth. These collaborations streamline the development and deployment of advanced surface analysis technologies by leveraging shared technologies, customer networks, and market insights. As a result, companies can reduce time-to-market, expand their North America footprint, and address evolving industry challenges more effectively, ultimately accelerating the overall expansion of the surface analysis market.
For instance,
In February 2025, according to article published by Cision US Inc., Nanovis announced that Medtronic acquired certain nano surface technology assets, including intellectual property related to OsteoSync titanium pads, for use in its next-generation PEEK interbody fusion devices. The FDA-cleared nanotechnology improved osseointegration, enhancing implant fixation in spine surgery. This strategic acquisition underscored how partnerships and mergers accelerate market expansion in surface analysis by integrating advanced nano-scale innovations with leading medical device designs. The collaboration promised to deliver best-in-class devices to surgeons, further driving innovation and market growth in the medical implant sector.
Restraints/Challenges
- Sensitivity to Surface Contaminants Affecting Accuracy
Techniques such as X-ray Photoelectron Spectroscopy (XPS), Auger Electron Spectroscopy (AES), and Time-of-Flight Secondary Ion Mass Spectrometry (ToF-SIMS) are highly surface-sensitive, meaning contamination from the environment, handling, or sample preparation can introduce errors. This challenge is particularly critical in industries like semiconductors, pharmaceuticals, and advanced materials, where precise surface composition analysis is essential for quality control and regulatory compliance. Addressing these issues requires stringent sample handling protocols, controlled environments, and advanced cleaning techniques to minimize unwanted surface alterations.
Furthermore, the growing demand for high-resolution and quantitative surface analysis in nanotechnology and biomaterials research amplifies the need for improved contamination control measures. Innovative solutions such as ultra-high vacuum (UHV) conditions, in situ cleaning techniques like ion sputtering, and advanced data correction algorithms are being explored to mitigate the impact of contaminants. However, these approaches can add complexity and cost to the analysis process, posing challenges for widespread adoption, particularly for smaller research labs and emerging industries. As surface analysis technologies evolve, advancements in automation, real-time contamination detection, and machine learning-driven correction techniques will be key to enhancing accuracy and reliability in diverse applications.
For instance
According to XPS Metrology, surface contamination impacts material properties, coatings, and adhesion, often leading to corrosion and degradation. Contaminants like oils, salts, and atmospheric pollutants distort surface analysis results, especially in XPS, where even nanometer-thick layers affect accuracy. Handling practices, gloves, and cleaning sprays further compromise measurement reliability in industries like aerospace and semiconductor manufacturing.
- Limited Skilled Workforce for Advanced Surface Analysis Techniques
Techniques like XPS, SIMS, and AFM require specialized knowledge in instrumentation, data interpretation, and sample preparation, which are essential for obtaining precise and reliable results. The shortage of trained professionals can lead to inefficiencies, inconsistent data quality, and prolonged analysis times, ultimately impacting research, quality control, and industrial applications reliant on surface characterization.
For instance:
In January 2020, according to the National Library of Medicine, X-ray photoelectron spectroscopy (XPS) has become the most widely used surface analysis technique, but its rapid adoption has led to frequent misapplications due to a shortage of skilled professionals. Many inexperienced users struggle with accurate measurements and data interpretation, resulting in errors and inconsistencies. Variations in instrument calibration further complicate the process, making the lack of trained specialists a key challenge for the surface analysis market, affecting result reliability and reproducibility
This market report provides details of new recent developments, trade regulations, import-export analysis, production analysis, value chain optimization, market share, impact of domestic and localized market players, analyses opportunities in terms of emerging revenue pockets, changes in market regulations, strategic market growth analysis, market size, category market growths, application niches and dominance, product approvals, product launches, geographic expansions, technological innovations in the market. To gain more info on the market contact Data Bridge Market Research for an Analyst Brief, our team will help you take an informed market decision to achieve market growth.
Surface Analysis Market Scope
The North America Surface Analysis Market is segmented into five notable segments based on the offering, deployment model, organization size, operating system and application. The growth amongst these segments will help you analyze meagre growth segments in the industries and provide the users with a valuable market overview and market insights to help them make strategic decisions for identifying core market applications.
Technology
- Microscopy
- By Method
- Electron Microscopy
- Optical Microscopy
- Confocal Microscopy
- Probe Microscopy
- By Technique
- Scanning Electron Microscopy (Sem)
- Transmission Electron Microscopy (Tem)
- Scanning Probe Microscopy (Spm)
- Image Analysis
- Cryo-Electron Microscopy (Cryo-Em)
- Others
- By Method
- Spectroscopy
- X-Ray Diffraction (Xrd)
- Surface Analyzers
Type
- Xps (X-Ray Photoelectron Spectroscopy)
- Tof-Sims (Time-Of-Flight Secondary Ion Mass Spectrometry)
- Aes (Auger Electron Spectroscopy)
- Raman (Raman Spectroscopy)
- Ups (Uv Photoelectron Spectroscopy)
- Iss (Ion Scattering Spectroscopy)
- Others
Method Type
- Spectroscopic Method
- Microscopic Method
- Classical Method
Equipment Type
- Scanning Probe Microscopes (Spm)/Atomic Force Microscopes (Afm)
- By Operation
- Automatic
- Manual
- By Noise Level
- Low
- Extremely Low
- Standard
- By Operation
- Electron Probe Micro-Analyzers (Epma)
- X-Ray Photoelectron Spectrometers (Xps)/Electron Spectroscopy For Chemical Analysis (Esca)
- Others
Application
- Material Composition
- Surface Roughness And Topography
- Thin Film Analysis
- Surface Contamination
- Failure Analysis
- Corrosion Analysis
- Surface Modification
End User
- Industries
- By Type
- Semiconductor
- Life Sciences & Pharmaceuticals
- Polymers
- Energy
- Metallurgy And Minerals
- Automotive
- Food And Beverages
- Textile
- Paper And Packaging
- Others
- By Technology
- Microscopy
- Spectroscopy
- X-Ray Diffraction (Xrd)
- Surface Analyzers
- By Type
- Research Organization
- Microscopy
- Spectroscopy
- X-Ray Diffraction (Xrd)
- Surface Analyzers
- Academic Institutes
- Microscopy
- Spectroscopy
- X-Ray Diffraction (XRD)
- Surface Analyzers
Surface Analysis Market Regional Analysis
The market is analyzed and market size insights and trends are provided by technology, type, method type, equipment type, application and end user.
The countries covered in the market are U.S., Canada, and Mexico.
U.S. is expected to dominate the surface analysis market due to its advanced technological infrastructure, strong presence of key industry players, and well-established research ecosystem. Its leadership is further reinforced by a high concentration of surface analysis equipment manufacturers and extensive adoption across industries such as electronics, healthcare, and aerospace.
U.S. is expected to be the fastest-growing country in the market due to increasing demand in the semiconductor, pharmaceutical, and material science sectors. Government initiatives, rising private investments, and continuous advancements in nanotechnology and surface engineering are accelerating market expansion.
The country section of the report also provides individual market impacting factors and changes in regulation in the market domestically that impacts the current and future trends of the market. Data points like down-stream and upstream value chain analysis, technical trends and porter's five forces analysis, case studies are some of the pointers used to forecast the market scenario for individual countries. Also, the presence and availability of South America brands and their challenges faced due to large or scarce competition from local and domestic brands, impact of domestic tariffs and trade routes are considered while providing forecast analysis of the country data.
Surface Analysis Market Share
The market competitive landscape provides details by competitor. Details included are company overview, company financials, revenue generated, market potential, investment in research and development, new market initiatives, South America presence, production sites and facilities, production capacities, company strengths and weaknesses, product launch, product width and breadth, application dominance. The above data points provided are only related to the companies' focus related to market.
Surface Analysis Market Leaders Operating in the Market Are:
- SERMA GROUP (France)
- Shimadzu Corporation (Japan)
- Eurofins Scientific (Luxembourg)
- Thermo Fisher Scientific Inc (U.S.)
- S A I Ltd (U.K.)
- SPECS GmbH (Germany)
- Physical Electronics, Inc. (PHI) (U.S.)
- Staib Instruments (Germany)
- Hiden Analytical (U.K.)
- Bruker (U.S.)
- HORIBA Group (Japan)
- JEOL Ltd (Japan)
- Carl Zeiss AG (Germany)
- TESCAN GROUP, a.s. (Czech Republic)
- TSI (U.S.)
- Nikon Instruments Inc. (U.S.)
Latest Developments in North America Surface Analysis Market
- In January 2025, Eurofins Environment Testing Eaton Analytical has developed a cutting-edge method to detect chloronitramide anion, a newly discovered disinfection byproduct in drinking water, improving water quality analysis and safety. This advancement enhances Eurofins Scientific’s expertise in surface and chemical analysis by refining its ability to identify and evaluate contaminants, further solidifying its leadership in analytical testing for water and environmental safety
- In July 2022, ULVAC-PHI has launched the PHI GENESIS, a fully automated XPS/HAXPES system designed for high-speed, high-sensitivity surface and interface analysis. This advancement strengthens Physical Electronics, Inc.'s position by enhancing automation, sensitivity, and analytical capabilities for metals, semiconductors, ceramics, and organic materials
- In July 2024, Shimadzu Corporation has joined forces with TESCAN Group to launch TESCAN's scanning electron microscopes in Japan this autumn, expanding its analytical measurement offerings. This partnership enhances Shimadzu’s surface analysis capabilities by combining TESCAN’s cutting-edge SEM technology with its existing instruments, enabling more precise and comprehensive material characterization
- In July 2024, FOCUS GmbH and SPECS Surface Nano Analysis GmbH, both under LAB14 GmbH, have merged as SPECS Surface Nano Analysis GmbH while maintaining their brand identities. This merger enhances SPECS GmbH’s surface analysis capabilities by integrating FOCUS GmbH’s expertise in momentum microscopes and electron spectroscopy, enabling more precise and comprehensive research solutions
- In February 2025, Thermo Fisher Scientific is acquiring Solventum’s Purification & Filtration business for USD 4.1 billion, reinforcing its presence in the expanding bioprocessing market. This acquisition boosts Thermo Fisher’s filtration and purification capabilities, enhancing sample preparation for surface analysis techniques such as XPS and spectroscopy, resulting in greater precision and efficiency in material characterization
SKU-

- Interactive Data Analysis Dashboard
- Company Analysis Dashboard for high growth potential opportunities
- Research Analyst Access for customization & queries
- Competitor Analysis with Interactive dashboard
- Latest News, Updates & Trend analysis
- Harness the Power of Benchmark Analysis for Comprehensive Competitor Tracking
Table of Content
1 INTRODUCTION
1.1 OBJECTIVES OF THE STUDY
1.2 MARKET DEFINITION
1.3 OVERVIEW OF NORTH AMERICA SURFACE ANALYSIS MARKET
1.4 CURRENCY AND PRICING
1.5 LIMITATIONS
1.6 MARKETS COVERED
2 MARKET SEGMENTATION
2.1 MARKETS COVERED
2.2 GEOGRAPHICAL SCOPE
2.3 YEARS CONSIDERED FOR THE STUDY
2.4 DBMR TRIPOD DATA VALIDATION MODEL
2.5 PRIMARY INTERVIEWS WITH KEY OPINION LEADERS
2.6 DBMR MARKET POSITION GRID
2.7 MULTIVARIATE MODELING
2.8 THECNOLOGY TIMELINE CURVE
2.9 MARKET APPLICATION COVERAGE GRID
2.1 SECONDARY SOURCES
2.11 ASSUMPTIONS
3 EXECUTIVE SUMMARY
4 PREMIUM INSIGHTS
4.1 INDUSTRY ANALYSIS & FUTURISTIC SCENARIO
4.1.1 SURFACE ANALYSIS IN THE SEMICONDUCTOR INDUSTRY
4.1.2 SURFACE ANALYSIS IN THE ACADEMIC INSTITUTES
4.1.3 SURFACE ANALYSIS IN THE RESEARCH ORGANIZATIONS
4.2 PENETRATION AND GROWTH PROSPECT MAPPING
4.2.1 GROWTH PROSPECT
4.3 COMPETITOR KEY PRICING STRATEGIES
4.4 KEY TECHNOLOGIES
4.4.1 COMPLEMENTARY TECHNOLOGIES
4.4.2 ADJACENT TECHNOLOGIES
4.4.3 CHALLENGES
4.4.4 TECHNOLOGY SPEND OF COMPANY
4.5 COMPANY COMPARATIVE ANALYSIS
5 MARKET OVERVIEW
5.1 DRIVERS
5.1.1 INCREASE IN THE R&D EXPENDITURE IN MEDICAL AND PHARMACEUTICAL COMPANIES
5.1.2 GROWING UTILIZATION OF SURFACE ANALYSIS METHODS IS EXPANDING ACROSS SECTORS LIKE ELECTRONICS, AUTOMOTIVE, AEROSPACE, AND ADVANCED MATERIALS
5.1.3 INCREASING QUALITY CONTROL DEMANDS ARE DRIVING THE EXPANSION OF SURFACE ANALYSIS.
5.1.4 GROWING RESEARCH COLLABORATION AMONG ACADEMIA, INDUSTRY, AND GOVERNMENT BOOST MARKET AWARENESS
5.2 RESTRAINTS
5.2.1 HIGH INSTRUMENT COSTS RESTRICT NORTH AMERICA SURFACE ANALYSIS EXPANSION
5.2.2 REGULATORY COMPLIANCE ISSUES HINDER RAPID TECHNOLOGY DEPLOYMENT
5.3 OPPORTUNITIES
5.3.1 EMERGING NANOTECHNOLOGY OFFERS BREAKTHROUGH TECHNIQUES IN ANALYSIS
5.3.2 STRATEGIC PARTNERSHIPS AND MERGERS ACCELERATE MARKET EXPANSION IN SURFACE ANALYSIS
5.4 CHALLENGES
5.4.1 SENSITIVITY TO SURFACE CONTAMINANTS AFFECTING ACCURACY
5.4.2 LIMITED SKILLED WORKFORCE FOR ADVANCED SURFACE ANALYSIS TECHNIQUES
6 NORTH AMERICA SURFACE ANALYSIS MARKET, BY TECHNOLOGY
6.1 OVERVIEW
6.2 MICROSCOPY
6.2.1 MICROSCOPY, BY METHOD
6.2.1.1 ELECTRON MICROSCOPY
6.2.1.2 OPTICAL MICROSCOPY
6.2.1.3 CONFOCAL MICROSCOPY
6.2.1.4 PROBE MICROSCOPY
6.2.2 MICROSCOPY, BY TECHNIQUE
6.2.2.1 SCANNING ELECTRON MICROSCOPY (SEM)
6.2.2.2 TRANSMISSION ELECTRON MICROSCOPY (TEM)
6.2.2.3 SCANNING PROBE MICROSCOPY (SPM)
6.2.2.4 IMAGE ANALYSIS
6.2.2.5 CRYO-ELECTRON MICROSCOPY (CRYO-EM)
6.2.2.6 OTHERS
6.3 SPECTROSCOPY
6.4 X-RAY DIFFRACTION (XRD)
6.5 SURFACE ANALYZERS
7 NORTH AMERICA SURFACE ANALYSIS MARKET, BY TYPE
7.1 OVERVIEW
7.2 XPS (X-RAY PHOTOELECTRON SPECTROSCOPY)
7.3 TOF-SIMS (TIME-OF-FLIGHT SECONDARY ION MASS SPECTROMETRY)
7.4 AES (AUGER ELECTRON SPECTROSCOPY)
7.5 RAMAN (RAMAN SPECTROSCOPY)
7.6 UPS (UV PHOTOELECTRON SPECTROSCOPY)
7.7 ISS (ION SCATTERING SPECTROSCOPY)
7.8 OTHERS
8 NORTH AMERICA SURFACE ANALYSIS MARKET, BY METHOD TYPE
8.1 OVERVIEW
8.2 SPECTROSCOPIC METHOD
8.3 MICROSCOPIC METHOD
8.4 CLASSICAL METHOD
9 NORTH AMERICA SURFACE ANALYSIS MARKET, BY EQUIPMENT TYPE
9.1 OVERVIEW
9.2 SCANNING PROBE MICROSCOPES (SPM)/ATOMIC FORCE MICROSCOPES (AFM)
9.2.1 SCANNING PROBE MICROSCOPES (SPM)/ATOMIC FORCE MICROSCOPES (AFM), BY OPERATION
9.2.1.1 AUTOMATIC
9.2.1.2 MANUAL
9.2.2 SCANNING PROBE MICROSCOPES (SPM)/ATOMIC FORCE MICROSCOPES (AFM), BY NOISE LEVEL
9.2.2.1 LOW
9.2.2.2 EXTREMELY LOW
9.2.2.3 STANDARD
9.3 ELECTRON PROBE MICRO-ANALYZERS (EPMA)
9.4 X-RAY PHOTOELECTRON SPECTROMETERS (XPS)/ELECTRON SPECTROSCOPY FOR CHEMICAL ANALYSIS (ESCA)
9.5 OTHERS
10 NORTH AMERICA SURFACE ANALYSIS MARKET, BY APPLICATION
10.1 OVERVIEW
10.2 MATERIAL COMPOSITION
10.3 SURFACE ROUGHNESS AND TOPOGRAPHY
10.4 THIN FILM ANALYSIS
10.5 SURFACE CONTAMINATION
10.6 FAILURE ANALYSIS
10.7 CORROSION ANALYSIS
10.8 SURFACE MODIFICATION
11 NORTH AMERICA SURFACE ANALYSIS MARKET, BY END USER
11.1 OVERVIEW
11.2 INDUSTRIES
11.2.1 INDUSTRIES, BY TYPE
11.2.1.1 LIFE SCIENCES & PHARMACEUTICALS
11.2.1.2 SEMICONDUCTOR
11.2.1.3 METALLURGY AND MINERALS
11.2.1.4 AUTOMOTIVE
11.2.1.5 ENERGY
11.2.1.6 FOOD AND BEVERAGES
11.2.1.7 POLYMERS
11.2.1.8 TEXTILE
11.2.1.9 PAPER AND PACKAGING
11.2.1.10 OTHERS
11.2.2 INDUSTRIES, BY TECHNOLOGY
11.2.2.1 MICROSCOPY
11.2.2.2 SPECTROSCOPY
11.2.2.3 X-RAY DIFFRACTION (XRD)
11.2.2.4 SURFACE ANALYZERS
11.3 RESEARCH ORGANIZATION
11.3.1 RESEARCH ORGANIZATION, BY TECHNOLOGY
11.3.1.1 MICROSCOPY
11.3.1.2 SPECTROSCOPY
11.3.1.3 X-RAY DIFFRACTION (XRD)
11.3.1.4 SURFACE ANALYZERS
11.4 ACADEMIC INSTITUTES
11.4.1 ACADEMIC INSTITUTES, BY TECHNOLOGY
11.4.1.1 MICROSCOPY
11.4.1.2 SPECTROSCOPY
11.4.1.3 X-RAY DIFFRACTION (XRD)
11.4.1.4 SURFACE ANALYZERS
12 NORTH AMERICA SURFACE ANALYSIS MARKET, BY REGION
12.1 NORTH AMERICA
12.1.1 U.S.
12.1.2 CANADA
12.1.3 MEXICO
13 NORTH AMERICA SURFACE ANALYSIS MARKET, COMPANY LANDSCAPE
13.1 COMPANY SHARE ANALYSIS: NORTH AMERICA
14 SWOT ANALYSIS
15 COMPANY PROFILES
15.1 THERMO FISHER SCIENTIFIC INC.
15.1.1 COMPANY SNAPSHOTS
15.1.2 REVENUE ANALYSIS
15.1.3 COMPANY SHARE ANALYSIS
15.1.4 PRODUCT PORTFOLIO
15.1.5 RECENT DEVELOPMENT
15.2 CARL ZEISS AG
15.2.1 COMPANY SNAPSHOT
15.2.2 COMPANY SHARE ANALYSIS
15.2.3 PRODUCT PORTFOLIO
15.2.4 RECENT DEVELOPMENTS/NEWS
15.3 BRUKER
15.3.1 COMPANY SNAPSHOT
15.3.2 REVENUE ANALYSIS
15.3.3 COMPANY SHARE ANALYSIS
15.3.4 PRODUCT PORTFOLIO
15.3.5 RECENT DEVELOPMENT/ NEWS
15.4 HORIBA GROUP
15.4.1 COMPANY SNAPSHOT
15.4.2 REVENUE ANALYSIS
15.4.3 COMPANY SHARE ANALYSIS
15.4.4 PRODUCT PORTFOLIO
15.4.5 RECENT DEVELOPMENTS
15.5 EUROFINS SCIENTIFIC
15.5.1 COMPANY SNAPSHOT
15.5.2 REVENUE ANALYSIS
15.5.3 COMPANY SHARE ANALYSIS
15.5.4 SERVICE PORTFOLIO
15.5.5 RECENT DEVELOPMENT
15.6 HIDDEN ANALYTICAL
15.6.1 COMPANY SNAPSHOT
15.6.2 PRODUCT PORTFOLIO
15.6.3 RECENT DEVELOPMENT
15.7 JEOL LTD.
15.7.1 COMPANY SNAPSHOTS
15.7.2 REVENUE ANALYSIS
15.7.3 PRODUCT PORTFOLIO
15.7.4 RECENT DEVELOPMENTS/NEWS
15.8 NIKON INSTRUMENTS INC.
15.8.1 COMPANY SNAPSHOT
15.8.2 PRODUCT PORTFOLIO
15.8.3 RECENT DEVELOPMENT
15.9 PHYSICAL ELECTRONICS, INC. (AS A PART OF ULVAC-PHI)
15.9.1 COMPANY SNAPSHOT
15.9.2 PRODUCT PORTFOLIO
15.9.3 RECENT DEVELOPMENT
15.1 S A I LTD
15.10.1 COMPANY SNAPSHOT
15.10.2 PRODUCT PORTFOLIO
15.10.3 RECENT DEVELOPMENT
15.11 SERMA GROUP
15.11.1 COMPANY SNAPSHOT
15.11.2 PRODUCT PORTFOLIO
15.11.3 RECENT DEVELOPMENT / NEWS
15.12 SHIMADZU CORPORATION
15.12.1 COMPANY SNAPSHOT
15.12.2 REVENUE ANALYSIS
15.12.3 PRODUCT PORTFOLIO
15.12.4 RECENT DEVELOPMENT
15.13 SPECS GMBH
15.13.1 COMPANY SNAPSHOT
15.13.2 PRODUCT PORTFOLIO
15.13.3 RECENT DEVELOPMENT
15.14 STAIB INSTRUMENTS
15.14.1 COMPANY SNAPSHOT
15.14.2 PRODUCT PORTFOLIO
15.14.3 RECENT DEVELOPMENT
15.15 TESCAN
15.15.1 COMPANY SNAPSHOT
15.15.2 PRODUCT PORTFOLIO
15.15.3 RECENT DEVELOPMENT/NEWS
15.16 TSI
15.16.1 COMPANY SNAPSHOT
15.16.2 PRODUCT PORTFOLIO
15.16.3 RECENT DEVELOPMENT/NEWS
16 QUESTIONNAIRE
17 RELATED REPORTS
List of Table
TABLE 1 MARKET PENETRATION ANALYSIS
TABLE 2 PRICING
TABLE 3 COMPANY COMPARATIVE ANALYSIS
TABLE 4 SEVERAL SOURCES OF SUBSTRATE SURFACE CONTAMINATION
TABLE 5 NORTH AMERICA SURFACE ANALYSIS MARKET, BY TECHNOLOGY, 2018-2032 (USD THOUSAND)
TABLE 6 NORTH AMERICA MICROSCOPY IN SURFACE ANALYSIS MARKET, BY REGION, 2018-2032 (USD THOUSAND)
TABLE 7 NORTH AMERICA MICROSCOPY IN SURFACE ANALYSIS MARKET, BY METHOD, 2018-2032 (USD THOUSAND)
TABLE 8 NORTH AMERICA MICROSCOPY IN SURFACE ANALYSIS MARKET, BY TECHNIQUE, 2018-2032 (USD THOUSAND)
TABLE 9 NORTH AMERICA SPECTROSCOPY IN SURFACE ANALYSIS MARKET, BY REGION, 2018-2032 (USD THOUSAND)
TABLE 10 NORTH AMERICA X-RAY DIFFRACTION (XRD) IN SURFACE ANALYSIS MARKET, BY RGION, 2018-2032 (USD THOUSAND)
TABLE 11 NORTH AMERICA SURFACE ANALYZERS IN SURFACE ANALYSIS MARKET, BY REGION, 2018-2032 (USD THOUSAND)
TABLE 12 NORTH AMERICA SURFACE ANALYSIS MARKET, BY TYPE, 2018-2032 (USD THOUSAND)
TABLE 13 NORTH AMERICA XPS (X-RAY PHOTOELECTRON SPECTROSCOPY) IN SURFACE ANALYSIS MARKET, BY REGION, 2018-2032 (USD THOUSAND)
TABLE 14 NORTH AMERICA TOF-SIMS (TIME-OF-FLIGHT SECONDARY ION MASS SPECTROMETRY) IN SURFACE ANALYSIS MARKET, BY REGION, 2018-2032 (USD THOUSAND)
TABLE 15 NORTH AMERICA AES (AUGER ELECTRON SPECTROSCOPY) IN SURFACE ANALYSIS MARKET, BY REGION, 2018-2032 (USD THOUSAND)
TABLE 16 NORTH AMERICA RAMAN (RAMAN SPECTROSCOPY) IN SURFACE ANALYSIS MARKET, BY REGION, 2018-2032 (USD THOUSAND)
TABLE 17 NORTH AMERICA UPS (UV PHOTOELECTRON SPECTROSCOPY) IN SURFACE ANALYSIS MARKET, BY REGION, 2018-2032 (USD THOUSAND)
TABLE 18 NORTH AMERICA ISS (ION SCATTERING SPECTROSCOPY) IN SURFACE ANALYSIS MARKET, BY REGION, 2018-2032 (USD THOUSAND)
TABLE 19 NORTH AMERICA OTHERS IN SURFACE ANALYSIS MARKET, BY REGION, 2018-2032 (USD THOUSAND)
TABLE 20 NORTH AMERICA SURFACE ANALYSIS MARKET, BY METHOD TYPE, 2018-2032 (USD THOUSAND)
TABLE 21 NORTH AMERICA SPECTROSCOPIC METHOD IN SURFACE ANALYSIS MARKET, BY REGION, 2018-2032 (USD THOUSAND)
TABLE 22 NORTH AMERICA MICROSCOPIC METHOD IN SURFACE ANALYSIS MARKET, BY REGION, 2018-2032 (USD THOUSAND)
TABLE 23 NORTH AMERICA CLASSICAL METHOD IN SURFACE ANALYSIS MARKET, BY REGION, 2018-2032 (USD THOUSAND)
TABLE 24 NORTH AMERICA SURFACE ANALYSIS MARKET, BY EQUIPMENT TYPE, 2018-2032 (USD THOUSAND)
TABLE 25 NORTH AMERICA SCANNING PROBE MICROSCOPES (SPM)/ATOMIC FORCE MICROSCOPES (AFM) IN SURFACE ANALYSIS MARKET, BY REGION, 2018-2032 (USD THOUSAND)
TABLE 26 NORTH AMERICA SCANNING PROBE MICROSCOPES (SPM)/ATOMIC FORCE MICROSCOPES (AFM) IN SURFACE ANALYSIS MARKET, BY OPERATION, 2018-2032 (USD THOUSAND)
TABLE 27 NORTH AMERICA SCANNING PROBE MICROSCOPES (SPM)/ATOMIC FORCE MICROSCOPES (AFM) IN SURFACE ANALYSIS MARKET, BY NOISE LEVEL, 2018-2032 (USD THOUSAND)
TABLE 28 NORTH AMERICA ELECTRON PROBE MICRO-ANALYZERS (EPMA) IN SURFACE ANALYSIS MARKET, BY REGION, 2018-2032 (USD THOUSAND)
TABLE 29 NORTH AMERICA X-RAY PHOTOELECTRON SPECTROMETERS (XPS)/ELECTRON SPECTROSCOPY FOR CHEMICAL ANALYSIS (ESCA) IN SURFACE ANALYSIS MARKET, BY REGION, 2018-2032 (USD THOUSAND)
TABLE 30 NORTH AMERICA OTHERS IN SURFACE ANALYSIS MARKET, BY REGION, 2018-2032 (USD THOUSAND)
TABLE 31 NORTH AMERICA SURFACE ANALYSIS MARKET, BY APPLICATION, 2018-2032 (USD THOUSAND)
TABLE 32 NORTH AMERICA MATERIAL COMPOSITION IN SURFACE ANALYSIS MARKET, BY REGION, 2018-2032 (USD THOUSAND)
TABLE 33 NORTH AMERICA SURFACE ROUGHNESS AND TOPOGRAPHY IN SURFACE ANALYSIS MARKET, BY REGION, 2018-2032 (USD THOUSAND)
TABLE 34 NORTH AMERICA THIN FILM ANALYSIS IN SURFACE ANALYSIS MARKET, BY REGION, 2018-2032 (USD THOUSAND)
TABLE 35 NORTH AMERICA SURFACE CONTAMINATION IN SURFACE ANALYSIS MARKET, BY REGION, 2018-2032 (USD THOUSAND)
TABLE 36 NORTH AMERICA FAILURE ANALYSIS IN SURFACE ANALYSIS MARKET, BY REGION, 2018-2032 (USD THOUSAND)
TABLE 37 NORTH AMERICA CORROSION ANALYSIS IN SURFACE ANALYSIS MARKET, BY REGION, 2018-2032 (USD THOUSAND)
TABLE 38 NORTH AMERICA SURFACE MODIFICATION IN SURFACE ANALYSIS MARKET, BY REGION, 2018-2032 (USD THOUSAND)
TABLE 39 NORTH AMERICA SURFACE ANALYSIS MARKET, BY END USER, 2018-2032 (USD THOUSAND)
TABLE 40 NORTH AMERICA INDUSTRIES IN SURFACE ANALYSIS MARKET, BY REGION, 2018-2032 (USD THOUSAND)
TABLE 41 NORTH AMERICA INDUSTRIES IN SURFACE ANALYSIS MARKET, BY TYPE, 2018-2032 (USD THOUSAND)
TABLE 42 NORTH AMERICA INDUSTRIES IN SURFACE ANALYSIS MARKET, BY TECHNOLOGY, 2018-2032 (USD THOUSAND)
TABLE 43 NORTH AMERICA RESEARCH ORGANIZATION IN SURFACE ANALYSIS MARKET, BY REGION, 2018-2032 (USD THOUSAND)
TABLE 44 NORTH AMERICA RESEARCH ORGANIZATION IN SURFACE ANALYSIS MARKET, BY TECHNOLOGY, 2018-2032 (USD THOUSAND)
TABLE 45 NORTH AMERICA ACADEMIC INSTITUTES IN SURFACE ANALYSIS MARKET, BY REGION, 2018-2032 (USD THOUSAND)
TABLE 46 NORTH AMERICA ACADEMIC INSTITUTES IN SURFACE ANALYSIS MARKET, BY TECHNOLOGY, 2018-2032 (USD THOUSAND)
TABLE 47 NORTH AMERICA SURFACE ANALYSIS MARKET, BY COUNTRY, 2018-2032 (USD THOUSAND)
TABLE 48 NORTH AMERICA SURFACE ANALYSIS MARKET, BY TECHNOLOGY, 2018-2032 (USD THOUSAND)
TABLE 49 NORTH AMERICA MICROSCOPY IN SURFACE ANALYSIS MARKET, BY METHOD, 2018-2032 (USD THOUSAND)
TABLE 50 NORTH AMERICA MICROSCOPY IN SURFACE ANALYSIS MARKET, BY TECHNIQUE, 2018-2032 (USD THOUSAND)
TABLE 51 NORTH AMERICA SURFACE ANALYSIS MARKET, BY TYPE, 2018-2032 (USD THOUSAND)
TABLE 52 NORTH AMERICA SURFACE ANALYSIS MARKET, BY METHOD TYPE, 2018-2032 (USD THOUSAND)
TABLE 53 NORTH AMERICA SURFACE ANALYSIS MARKET, BY EQUIPMENT TYPE, 2018-2032 (USD THOUSAND)
TABLE 54 NORTH AMERICA SCANNING PROBE MICROSCOPES (SPM)/ATOMIC FORCE MICROSCOPES (AFM) IN SURFACE ANALYSIS MARKET, BY OPERATION, 2018-2032 (USD THOUSAND)
TABLE 55 NORTH AMERICA SCANNING PROBE MICROSCOPES (SPM)/ATOMIC FORCE MICROSCOPES (AFM) IN SURFACE ANALYSIS MARKET, BY NOISE LEVEL, 2018-2032 (USD THOUSAND)
TABLE 56 NORTH AMERICA SURFACE ANALYSIS MARKET, BY APPLICATION, 2018-2032 (USD THOUSAND)
TABLE 57 NORTH AMERICA SURFACE ANALYSIS MARKET, BY END USER, 2018-2032 (USD THOUSAND)
TABLE 58 NORTH AMERICA INDUSTRIES IN SURFACE ANALYSIS MARKET, BY TYPE, 2018-2032 (USD THOUSAND)
TABLE 59 NORTH AMERICA INDUSTRIES IN SURFACE ANALYSIS MARKET, BY TECHNOLOGY, 2018-2032 (USD THOUSAND)
TABLE 60 NORTH AMERICA RESEARCH ORGANIZATION IN SURFACE ANALYSIS MARKET, BY TECHNOLOGY, 2018-2032 (USD THOUSAND)
TABLE 61 NORTH AMERICA ACADEMIC INSTITUTES IN SURFACE ANALYSIS MARKET, BY TECHNOLOGY, 2018-2032 (USD THOUSAND)
TABLE 62 U.S. SURFACE ANALYSIS MARKET, BY TECHNOLOGY, 2018-2032 (USD THOUSAND)
TABLE 63 U.S. MICROSCOPY IN SURFACE ANALYSIS MARKET, BY METHOD, 2018-2032 (USD THOUSAND)
TABLE 64 U.S. MICROSCOPY IN SURFACE ANALYSIS MARKET, BY TECHNIQUE, 2018-2032 (USD THOUSAND)
TABLE 65 U.S. SURFACE ANALYSIS MARKET, BY TYPE, 2018-2032 (USD THOUSAND)
TABLE 66 U.S. SURFACE ANALYSIS MARKET, BY METHOD TYPE, 2018-2032 (USD THOUSAND)
TABLE 67 U.S. SURFACE ANALYSIS MARKET, BY EQUIPMENT TYPE, 2018-2032 (USD THOUSAND)
TABLE 68 U.S. SCANNING PROBE MICROSCOPES (SPM)/ATOMIC FORCE MICROSCOPES (AFM) IN SURFACE ANALYSIS MARKET, BY OPERATION, 2018-2032 (USD THOUSAND)
TABLE 69 U.S. SCANNING PROBE MICROSCOPES (SPM)/ATOMIC FORCE MICROSCOPES (AFM) IN SURFACE ANALYSIS MARKET, BY NOISE LEVEL, 2018-2032 (USD THOUSAND)
TABLE 70 U.S. SURFACE ANALYSIS MARKET, BY APPLICATION, 2018-2032 (USD THOUSAND)
TABLE 71 U.S. SURFACE ANALYSIS MARKET, BY END USER, 2018-2032 (USD THOUSAND)
TABLE 72 U.S. INDUSTRIES IN SURFACE ANALYSIS MARKET, BY TYPE, 2018-2032 (USD THOUSAND)
TABLE 73 U.S. INDUSTRIES IN SURFACE ANALYSIS MARKET, BY TECHNOLOGY, 2018-2032 (USD THOUSAND)
TABLE 74 U.S. RESEARCH ORGANIZATION IN SURFACE ANALYSIS MARKET, BY TECHNOLOGY, 2018-2032 (USD THOUSAND)
TABLE 75 U.S. ACADEMIC INSTITUTES IN SURFACE ANALYSIS MARKET, BY TECHNOLOGY, 2018-2032 (USD THOUSAND)
TABLE 76 CANADA SURFACE ANALYSIS MARKET, BY TECHNOLOGY, 2018-2032 (USD THOUSAND)
TABLE 77 CANADA MICROSCOPY IN SURFACE ANALYSIS MARKET, BY METHOD, 2018-2032 (USD THOUSAND)
TABLE 78 CANADA MICROSCOPY IN SURFACE ANALYSIS MARKET, BY TECHNIQUE, 2018-2032 (USD THOUSAND)
TABLE 79 CANADA SURFACE ANALYSIS MARKET, BY TYPE, 2018-2032 (USD THOUSAND)
TABLE 80 CANADA SURFACE ANALYSIS MARKET, BY METHOD TYPE, 2018-2032 (USD THOUSAND)
TABLE 81 CANADA SURFACE ANALYSIS MARKET, BY EQUIPMENT TYPE, 2018-2032 (USD THOUSAND)
TABLE 82 CANADA SCANNING PROBE MICROSCOPES (SPM)/ATOMIC FORCE MICROSCOPES (AFM) IN SURFACE ANALYSIS MARKET, BY OPERATION, 2018-2032 (USD THOUSAND)
TABLE 83 CANADA SCANNING PROBE MICROSCOPES (SPM)/ATOMIC FORCE MICROSCOPES (AFM) IN SURFACE ANALYSIS MARKET, BY NOISE LEVEL, 2018-2032 (USD THOUSAND)
TABLE 84 CANADA SURFACE ANALYSIS MARKET, BY APPLICATION, 2018-2032 (USD THOUSAND)
TABLE 85 CANADA SURFACE ANALYSIS MARKET, BY END USER, 2018-2032 (USD THOUSAND)
TABLE 86 CANADA INDUSTRIES IN SURFACE ANALYSIS MARKET, BY TYPE, 2018-2032 (USD THOUSAND)
TABLE 87 CANADA INDUSTRIES IN SURFACE ANALYSIS MARKET, BY TECHNOLOGY, 2018-2032 (USD THOUSAND)
TABLE 88 CANADA RESEARCH ORGANIZATION IN SURFACE ANALYSIS MARKET, BY TECHNOLOGY, 2018-2032 (USD THOUSAND)
TABLE 89 CANADA ACADEMIC INSTITUTES IN SURFACE ANALYSIS MARKET, BY TECHNOLOGY, 2018-2032 (USD THOUSAND)
TABLE 90 MEXICO SURFACE ANALYSIS MARKET, BY TECHNOLOGY, 2018-2032 (USD THOUSAND)
TABLE 91 MEXICO MICROSCOPY IN SURFACE ANALYSIS MARKET, BY METHOD, 2018-2032 (USD THOUSAND)
TABLE 92 MEXICO MICROSCOPY IN SURFACE ANALYSIS MARKET, BY TECHNIQUE, 2018-2032 (USD THOUSAND)
TABLE 93 MEXICO SURFACE ANALYSIS MARKET, BY TYPE, 2018-2032 (USD THOUSAND)
TABLE 94 MEXICO SURFACE ANALYSIS MARKET, BY METHOD TYPE, 2018-2032 (USD THOUSAND)
TABLE 95 MEXICO SURFACE ANALYSIS MARKET, BY EQUIPMENT TYPE, 2018-2032 (USD THOUSAND)
TABLE 96 MEXICO SCANNING PROBE MICROSCOPES (SPM)/ATOMIC FORCE MICROSCOPES (AFM) IN SURFACE ANALYSIS MARKET, BY OPERATION, 2018-2032 (USD THOUSAND)
TABLE 97 MEXICO SCANNING PROBE MICROSCOPES (SPM)/ATOMIC FORCE MICROSCOPES (AFM) IN SURFACE ANALYSIS MARKET, BY NOISE LEVEL, 2018-2032 (USD THOUSAND)
TABLE 98 MEXICO SURFACE ANALYSIS MARKET, BY APPLICATION, 2018-2032 (USD THOUSAND)
TABLE 99 MEXICO SURFACE ANALYSIS MARKET, BY END USER, 2018-2032 (USD THOUSAND)
TABLE 100 MEXICO INDUSTRIES IN SURFACE ANALYSIS MARKET, BY TYPE, 2018-2032 (USD THOUSAND)
TABLE 101 MEXICO INDUSTRIES IN SURFACE ANALYSIS MARKET, BY TECHNOLOGY, 2018-2032 (USD THOUSAND)
TABLE 102 MEXICO RESEARCH ORGANIZATION IN SURFACE ANALYSIS MARKET, BY TECHNOLOGY, 2018-2032 (USD THOUSAND)
TABLE 103 MEXICO ACADEMIC INSTITUTES IN SURFACE ANALYSIS MARKET, BY TECHNOLOGY, 2018-2032 (USD THOUSAND)
List of Figure
FIGURE 1 NORTH AMERICA SURFACE ANALYSIS MARKET: SEGMENTATION
FIGURE 2 NORTH AMERICA SURFACE ANALYSIS MARKET: DATA TRIANGULATION
FIGURE 3 NORTH AMERICA SURFACE ANALYSIS MARKET: DROC ANALYSIS
FIGURE 4 NORTH AMERICA SURFACE ANALYSIS MARKET: INTERVIEW DEMOGRAPHICS
FIGURE 5 NORTH AMERICA SURFACE ANALYSIS MARKET: DBMR MARKET POSITION GRID
FIGURE 6 NORTH AMERICA SURFACE ANALYSIS MARKET: MULTIVARIATE MODELING
FIGURE 7 NORTH AMERICA SURFACE ANALYSIS MARKET: TECHNOLOGY TIMELINE CURVE
FIGURE 8 NORTH AMERICA SURFACE ANALYSIS MARKET: APPLICATION COVERAGE GRID
FIGURE 9 NORTH AMERICA SURFACE ANALYSIS MARKET: SEGMENTATION
FIGURE 10 SEMICONDUCTOR: NORTH AMERICA SURFACE ANALYSIS MARKET EXECUTIVE SUMMARY
FIGURE 11 FOUR SEGMENTS COMPRISE THE NORTH AMERICA SURFACE ANALYSIS MARKET, BY TECHNOLOGY (2024)
FIGURE 12 STRATEGIC DECISIONS
FIGURE 13 INCREASE IN THE R&D EXPENDITURE IN MEDICAL AND PHARMACEUTICAL COMPANIES THE NORTH AMERICA SURFACE ANALYSIS MARKET DURING THE FORECAST PERIOD OF 2025 TO 2032
FIGURE 14 TECHNOLOGY SEGMENT IS EXPECTED TO ACCOUNT FOR THE LARGEST SHARE OF THE NORTH AMERICA SURFACE ANALYSIS MARKET IN 2025 & 2032
FIGURE 15 BIGGEST MANUFACTURING ECONOMIES
FIGURE 16 DROC ANALYSIS
FIGURE 17 R&D INVESTMENTS BY INDIAN PHARMA COMPANIES
FIGURE 18 NORTH AMERICA SURFACE ANALYSIS MARKET: BY TECHNOLOGY, 2024
FIGURE 19 NORTH AMERICA SURFACE ANALYSIS MARKET: BY TYPE, 2024
FIGURE 20 NORTH AMERICA SURFACE ANALYSIS MARKET: BY METHOD TYPE, 2024
FIGURE 21 NORTH AMERICA SURFACE ANALYSIS MARKET: BY EQUIPMENT TYPE, 2024
FIGURE 22 NORTH AMERICA SURFACE ANALYSIS MARKET: BY APPLICATION, 2024
FIGURE 23 NORTH AMERICA SURFACE ANALYSIS MARKET: BY END USER, 2024
FIGURE 24 NORTH AMERICA SURFACE ANALYSIS MARKET: SNAPSHOT (2024)
FIGURE 25 NORTH AMERICA SURFACE ANALYSIS MARKET: COMPANY SHARE 2024 (%)
Data collection and base year analysis are done using data collection modules with large sample sizes. The stage includes obtaining market information or related data through various sources and strategies. It includes examining and planning all the data acquired from the past in advance. It likewise envelops the examination of information inconsistencies seen across different information sources. The market data is analysed and estimated using market statistical and coherent models. Also, market share analysis and key trend analysis are the major success factors in the market report. To know more, please request an analyst call or drop down your inquiry.
The key research methodology used by DBMR research team is data triangulation which involves data mining, analysis of the impact of data variables on the market and primary (industry expert) validation. Data models include Vendor Positioning Grid, Market Time Line Analysis, Market Overview and Guide, Company Positioning Grid, Patent Analysis, Pricing Analysis, Company Market Share Analysis, Standards of Measurement, Global versus Regional and Vendor Share Analysis. To know more about the research methodology, drop in an inquiry to speak to our industry experts.
Data Bridge Market Research is a leader in advanced formative research. We take pride in servicing our existing and new customers with data and analysis that match and suits their goal. The report can be customized to include price trend analysis of target brands understanding the market for additional countries (ask for the list of countries), clinical trial results data, literature review, refurbished market and product base analysis. Market analysis of target competitors can be analyzed from technology-based analysis to market portfolio strategies. We can add as many competitors that you require data about in the format and data style you are looking for. Our team of analysts can also provide you data in crude raw excel files pivot tables (Fact book) or can assist you in creating presentations from the data sets available in the report.


