
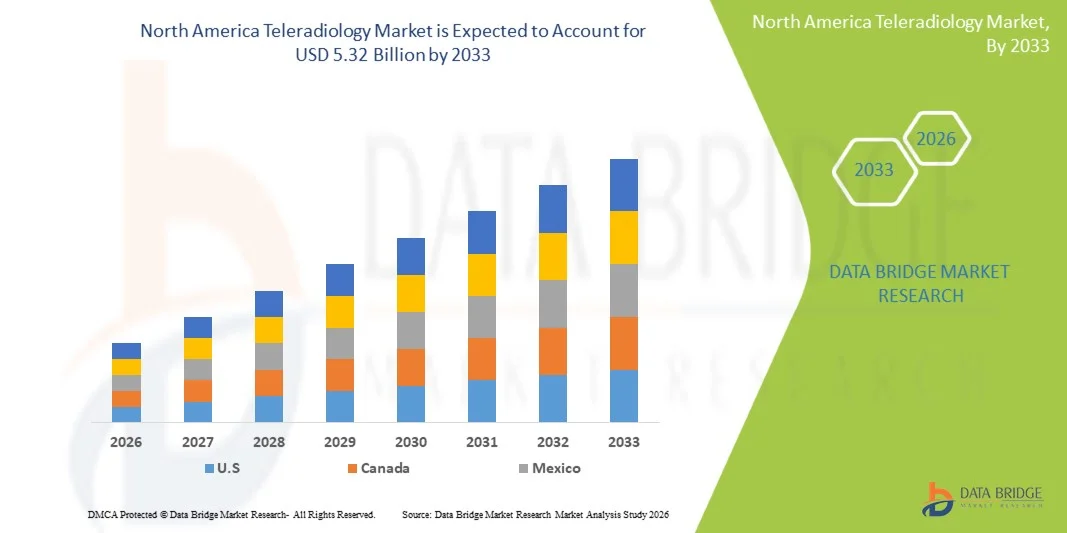
North America Teleradiology Market
Market Size in USD Billion
 USD
1.37 Billion
USD
5.32 Billion
2025
2033
USD
1.37 Billion
USD
5.32 Billion
2025
2033
| 2026 - 2033 | |
| USD 1.37 Billion | |
| USD 5.32 Billion | |
| % | |
|
North America Teleradiology Market Size
- The North America teleradiology market size was valued at USD 1.37 billion in 2025 and is expected to reach USD 5.32 billion by 2033, at a CAGR of 18.5% during the forecast period
- The market growth is largely fueled by the increasing demand for remote diagnostic services, a growing shortage of radiologists, and the expanding integration of advanced imaging technologies, leading to enhanced digital healthcare delivery across hospitals and diagnostic centers
- Furthermore, rising adoption of cloud-based platforms, artificial intelligence in imaging interpretation, and the need for 24/7 radiology support are establishing teleradiology as a critical component of modern healthcare infrastructure. These converging factors are accelerating the uptake of teleradiology services, thereby significantly boosting the industry's growth
North America Teleradiology Market Analysis
- Teleradiology, enabling the electronic transmission of radiological images such as X-rays, CT scans, and MRIs for remote interpretation, has become an essential component of modern healthcare systems in both hospitals and diagnostic centers due to its ability to provide timely, accurate, and round-the-clock diagnostic support across geographically dispersed locations
- The escalating demand for teleradiology is primarily fueled by the growing shortage of radiologists, increasing imaging volumes, rising need for rapid diagnosis, and expanding adoption of digital healthcare infrastructure along with cloud-based medical imaging solutions
- The United States dominated the teleradiology market with the largest revenue share of 76.05% in 2025, characterized by advanced healthcare IT ecosystems, strong adoption of AI-enabled imaging platforms, and widespread use of cloud-based reporting systems, with the country leading in remote diagnostic services across hospitals, emergency care units, and outpatient imaging centers driven by tele-diagnosis and tele-consultation procedures
- Canada is expected to be the fastest growing country in the teleradiology market during the forecast period due to increasing healthcare digitization, shortage of radiology professionals, and rising investments in telehealth infrastructure
- The tele-diagnosis segment dominated the teleradiology market with a market share of 41.8% in 2025, driven by high demand for accurate remote image interpretation, improved diagnostic efficiency, and increasing utilization of advanced imaging technologies such as volume rendering and multiplanar reconstructions across multiple clinical applications
Report Scope and North America Teleradiology Market Segmentation
|
Attributes |
North America Teleradiology Key Market Insights |
|
Segments Covered |
|
|
Countries Covered |
North America
|
|
Key Market Players |
|
|
Market Opportunities |
|
|
Value Added Data Infosets |
In addition to the insights on market scenarios such as market value, growth rate, segmentation, geographical coverage, and major players, the market reports curated by the Data Bridge Market Research also include in-depth expert analysis, patient epidemiology, pipeline analysis, pricing analysis, and regulatory framework |
North America Teleradiology Market Trends
“Integration of AI, Cloud Platforms, and Advanced Imaging Analytics”
- A significant and accelerating trend in the North America teleradiology market is the deepening integration of artificial intelligence (AI), cloud-based imaging platforms, and advanced visualization tools such as 3D reconstruction and image enhancement, significantly improving diagnostic speed and accuracy across healthcare facilities
- For instance, AI-enabled teleradiology platforms are increasingly used in hospitals to automatically flag abnormalities in CT and MRI scans, allowing radiologists to prioritize critical cases and improve patient outcomes through faster reporting
- AI integration in teleradiology enables features such as automated lesion detection, workflow optimization, and intelligent reporting systems that reduce diagnostic errors while enhancing radiologist productivity in high-volume imaging environments
- The seamless integration of teleradiology systems with hospital information systems (HIS) and picture archiving and communication systems (PACS) is enabling centralized access to imaging data, supporting coordinated care across multiple healthcare departments and locations
- The growing adoption of cloud-native teleradiology platforms is enabling real-time image sharing across hospitals and diagnostic centers, reducing reporting delays and improving access to subspecialty expertise across different geographies
- This trend towards more intelligent, cloud-connected, and AI-driven diagnostic ecosystems is fundamentally reshaping radiology workflows, with companies increasingly developing advanced platforms offering real-time image sharing and automated diagnostic assistance
- The demand for teleradiology solutions with integrated AI analytics and cloud-based accessibility is growing rapidly across hospitals and diagnostic centers, as healthcare providers prioritize efficiency, scalability, and remote diagnostic capabilities
North America Teleradiology Market Dynamics
Driver
“Rising Demand Due to Radiologist Shortage and Expanding Imaging Volumes”
- The increasing shortage of qualified radiologists, coupled with rapidly growing imaging volumes in hospitals and diagnostic centers, is a significant driver for the heightened demand for teleradiology services across North America
- For instance, in April 2025, leading U.S. healthcare networks expanded their remote imaging partnerships to address staffing gaps, leveraging teleradiology platforms to ensure continuous 24/7 diagnostic coverage across emergency and outpatient departments
- As healthcare providers face rising patient loads and demand for faster diagnostic turnaround times, teleradiology offers remote access to specialists, enabling timely interpretation of X-rays, CT scans, and MRI reports with improved efficiency
- Furthermore, the growing adoption of digital healthcare infrastructure and cloud-based imaging systems is making it easier for hospitals and clinics to integrate teleradiology services into routine clinical workflows
- The convenience of remote reporting, faster turnaround times, and access to subspecialty radiologists are key factors propelling the adoption of teleradiology in both urban and rural healthcare settings, strengthening overall diagnostic capabilities
- The increasing prevalence of chronic diseases such as cancer, cardiovascular disorders, and neurological conditions is further driving higher demand for imaging-based diagnostics, boosting teleradiology utilization
- Government initiatives and healthcare reforms supporting telehealth expansion are also encouraging hospitals to adopt teleradiology solutions for improved patient care delivery
Restraint/Challenge
“Data Security Risks and High Infrastructure Integration Complexity”
- Concerns surrounding data security, patient privacy breaches, and compliance with healthcare regulations such as HIPAA pose a significant challenge to broader adoption of teleradiology systems across North America
- For instance, reports of cybersecurity incidents in healthcare imaging networks have raised concerns among providers regarding unauthorized access to sensitive medical data transmitted through cloud-based teleradiology platforms
- Addressing these security challenges through advanced encryption, secure data transmission protocols, and strict access control systems is essential for maintaining trust and regulatory compliance in healthcare institutions
- In addition, the high cost and technical complexity of integrating teleradiology solutions with existing hospital IT systems, including PACS and electronic health records, can slow down adoption among smaller healthcare facilities
- While large hospital networks are rapidly adopting advanced teleradiology infrastructure, budget constraints and interoperability challenges continue to hinder widespread deployment, particularly in smaller or rural healthcare centers
- Lack of standardized interoperability frameworks across different imaging systems further complicates seamless data exchange between healthcare providers
- Resistance to digital transformation among certain healthcare institutions also slows down the pace of full-scale teleradiology adoption
North America Teleradiology Market Scope
The market is segmented on the basis of type, delivery mode, imaging technique, technology, procedure, application, site, age, mode of purchase, and end user.
- By Type
On the basis of type, the North America teleradiology market is segmented into hardware, systems, software, telecom, and networking services. The software segment dominated the market with the largest revenue share of 38.6% in 2025, driven by the rapid adoption of AI-powered imaging platforms, cloud-based reporting tools, and advanced visualization software across hospitals and diagnostic centers. Healthcare providers increasingly rely on software solutions for image management, workflow automation, and remote diagnostic reporting, improving efficiency and reducing turnaround time. The rising integration of PACS and RIS platforms further strengthens software dominance in teleradiology ecosystems. Strong demand for scalable and interoperable solutions also supports continuous software upgrades across healthcare facilities. Increasing investments in AI-based diagnostic software by leading vendors is further accelerating segment growth.
The telecom and networking services segment is expected to witness the fastest growth rate of 22.4% from 2026 to 2033, driven by rising demand for high-speed data transmission and real-time medical image sharing. For instance, healthcare providers are increasingly upgrading network infrastructure to support large imaging file transfers such as CT and MRI scans without latency. The expansion of 5G connectivity and fiber-optic networks is significantly enhancing teleradiology performance across urban and rural healthcare settings. Growing reliance on cloud-based diagnostics and remote collaboration between radiologists is further fueling demand for robust networking services. Increasing cybersecurity investments for secure image transmission also contribute to segment expansion. The shift toward fully connected digital hospitals is accelerating adoption of advanced telecom infrastructure.
- By Delivery Mode
On the basis of delivery mode, the market is segmented into web-based delivery mode, cloud-based delivery mode, and on-premise delivery mode. The cloud-based delivery mode segment dominated the market with the largest revenue share of 47.9% in 2025, driven by its scalability, cost efficiency, and ability to enable real-time remote access to imaging data. Hospitals and diagnostic centers increasingly prefer cloud platforms for centralized storage, seamless collaboration, and reduced IT infrastructure costs. Cloud solutions also support AI integration for automated image analysis and faster reporting workflows. The flexibility to access patient data from multiple locations enhances operational efficiency across healthcare networks. Rising adoption of telehealth services further strengthens cloud dominance. Continuous improvements in data security and compliance frameworks are boosting confidence in cloud deployment.
The web-based delivery mode segment is expected to witness the fastest growth rate of 20.8% from 2026 to 2033, driven by its ease of deployment and minimal infrastructure requirements. For instance, small and mid-sized diagnostic centers are increasingly adopting web-based platforms to enable remote radiology reporting without heavy IT investment. Web-based systems allow instant access through browsers, making them highly convenient for radiologists working across multiple facilities. Increasing demand for flexible and scalable diagnostic solutions is driving adoption in rural healthcare setups. Integration with existing hospital systems without complex installation is further supporting growth. The rising need for rapid diagnostic turnaround is accelerating web-based platform usage.
- By Imaging Technique
On the basis of imaging technique, the market is segmented into small matrix size and large matrix size. The large matrix size segment dominated the market with the largest revenue share of 54.3% in 2025, driven by its ability to provide high-resolution imaging essential for advanced diagnostic procedures such as oncology, neurology, and cardiology. Large matrix imaging enhances image clarity, enabling accurate interpretation of complex medical conditions. Hospitals increasingly rely on high-resolution imaging for precise diagnosis and treatment planning. The growing use of CT and MRI scans further strengthens demand for large matrix systems. Integration with AI-based diagnostic tools improves image processing efficiency. Rising adoption of advanced imaging in tertiary care hospitals supports segment dominance.
The small matrix size segment is expected to witness the fastest growth rate of 19.6% from 2026 to 2033, driven by its cost-effectiveness and faster image transmission capabilities. For instance, emergency care centers and outpatient clinics increasingly use small matrix imaging for rapid diagnostics in time-sensitive cases. Lower data storage requirements make it suitable for high-volume screening applications. Growing demand in rural and resource-limited healthcare settings supports adoption. Technological advancements in compression algorithms are improving image quality despite smaller sizes. Increasing use in tele-consultation workflows is further driving growth.
- By Technology
On the basis of technology, the market is segmented into advanced graphics processing, volume rendering, multiplanar reconstructions, and image compression. The volume rendering segment dominated the market with the largest revenue share of 35.7% in 2025, driven by its ability to provide detailed 3D visualization of anatomical structures, improving diagnostic accuracy. Radiologists widely use volume rendering for complex case evaluations in oncology and neurology. Integration with advanced imaging systems enhances clinical decision-making. Increasing use in surgical planning and pre-procedure analysis supports dominance. Growing adoption of AI-enhanced visualization tools further strengthens demand. Hospitals prefer volume rendering for its superior diagnostic clarity.
The image compression segment is expected to witness the fastest growth rate of 23.1% from 2026 to 2033, driven by the increasing need for faster transmission of large imaging files across networks. For instance, healthcare providers are adopting advanced compression algorithms to efficiently transfer MRI and CT scans without compromising image quality. Rising use of cloud-based teleradiology platforms further boosts demand. Compression technology reduces bandwidth usage and improves workflow efficiency. Increasing adoption in emergency diagnostics supports rapid deployment. Growing emphasis on cost-effective data management is accelerating segment growth.
- By Procedure
On the basis of procedure, the North America teleradiology market is segmented into tele-consultation, tele-diagnosis, and tele-monitoring. The tele-diagnosis segment dominated the market with the largest revenue share of 41.8% in 2025, driven by the high demand for remote interpretation of medical images such as CT, MRI, and X-rays across hospitals and diagnostic centers. Healthcare providers increasingly rely on tele-diagnosis to reduce reporting delays and improve clinical decision-making efficiency. The shortage of on-site radiologists further strengthens dependence on remote diagnostic services. Integration of AI-based tools enhances diagnostic accuracy and workflow speed. Rising emergency care imaging volumes also support segment dominance. Expanding hospital networks using centralized reporting systems further drives adoption.
The tele-consultation segment is expected to witness the fastest growth rate of 21.3% from 2026 to 2033, driven by increasing demand for real-time specialist collaboration and second-opinion services. For instance, physicians are increasingly using tele-consultation platforms to connect with subspecialty radiologists for complex case evaluations. Growing adoption of multidisciplinary care models supports segment expansion. Improved connectivity through cloud-based platforms enables seamless communication between healthcare professionals. Rising focus on patient-centric care is accelerating usage. Increasing adoption in rural and underserved areas is further fueling growth.
- By Application
On the basis of application, the market is segmented into cardiology, neurology, oncology, musculoskeletal, gastroenterology, pelvic and abdominal, gynecology, urology, mammography, dental, and others. The neurology segment dominated the market with the largest revenue share of 27.8% in 2025, driven by the high prevalence of neurological disorders such as stroke, brain tumors, and neurodegenerative diseases requiring advanced imaging. Demand for MRI and CT-based brain imaging significantly boosts teleradiology usage in neurology. Increasing adoption of AI-based neuroimaging tools improves diagnostic precision. Hospitals rely heavily on remote neurology reporting for emergency stroke management. Growing elderly population further strengthens demand. Expanding neuroimaging infrastructure supports segment dominance.
The oncology segment is expected to witness the fastest growth rate of 22.6% from 2026 to 2033, driven by rising cancer incidence and increasing dependence on imaging for early detection and treatment monitoring. For instance, teleradiology is widely used in tumor detection and staging using CT, PET, and MRI scans. Expanding cancer screening programs across North America are boosting imaging volumes. Integration of advanced visualization tools enhances tumor assessment accuracy. Growing demand for second opinions in cancer diagnosis supports adoption. Increasing investments in oncology care infrastructure further accelerates growth.
- By Site
On the basis of site, the market is segmented into in-house, offshore, and onshore. The in-house segment dominated the market with the largest revenue share of 52.4% in 2025, driven by hospitals and diagnostic centers preferring internal control over imaging data and reporting workflows. In-house teleradiology systems ensure faster communication between radiologists and clinicians, improving turnaround time. Strong data privacy requirements in healthcare institutions support in-house adoption. Integration with hospital PACS and HIS systems further strengthens usage. Large healthcare networks prefer centralized in-house diagnostic systems. Increasing investment in hospital IT infrastructure supports segment dominance.
The offshore segment is expected to witness the fastest growth rate of 20.9% from 2026 to 2033, driven by rising demand for cost-effective radiology reporting services and access to global radiology expertise. For instance, healthcare providers increasingly outsource imaging interpretation to offshore radiologists to manage workload and reduce operational costs. Growing shortage of radiologists in North America supports offshore adoption. Cloud-based platforms enable seamless cross-border image transmission. Increasing demand for 24/7 diagnostic coverage accelerates growth. Expanding telehealth outsourcing partnerships further drives segment expansion.
- By Age
On the basis of age, the market is segmented into pediatric, geriatric, and adults. The geriatric segment dominated the market with the largest revenue share of 49.1% in 2025, driven by the high prevalence of chronic diseases such as cardiovascular disorders, cancer, and neurological conditions in the aging population. Elderly patients require frequent imaging, significantly increasing teleradiology utilization. Rising hospital admissions among geriatric populations further support demand. Advanced imaging techniques improve diagnosis of age-related conditions. Increasing healthcare expenditure on elderly care strengthens segment dominance. Growing need for continuous monitoring and follow-up imaging supports adoption.
The pediatric segment is expected to witness the fastest growth rate of 21.5% from 2026 to 2033, driven by increasing awareness of early disease detection and advancements in low-dose imaging technologies. For instance, pediatric hospitals increasingly use teleradiology for remote specialist consultation in complex congenital and neurological conditions. Rising investments in child healthcare infrastructure support adoption. Growing use of AI-based imaging tools improves safety and accuracy. Expanding telehealth services in pediatric care further boosts growth. Increasing demand for subspecialty pediatric radiologists accelerates segment expansion.
- By Mode of Purchase
On the basis of mode of purchase, the market is segmented into group purchase and individual purchase. The group purchase segment dominated the market with the largest revenue share of 58.3% in 2025, driven by large hospital networks and healthcare organizations procuring teleradiology solutions in bulk to reduce costs and ensure standardized imaging systems. Group purchasing enables better pricing negotiations and integrated service agreements. Healthcare systems prefer centralized procurement for efficiency and compatibility. Rising consolidation of hospitals further strengthens group buying power. Long-term service contracts with vendors support dominance. Increasing demand for enterprise-level teleradiology platforms accelerates adoption.
The individual purchase segment is expected to witness the fastest growth rate of 19.8% from 2026 to 2033, driven by small clinics and independent diagnostic centers adopting flexible, cost-effective teleradiology solutions. For instance, standalone imaging centers are increasingly purchasing cloud-based platforms on subscription models. Growing availability of scalable SaaS-based teleradiology solutions supports adoption. Lower upfront investment requirements attract small healthcare providers. Rising demand for independent diagnostic workflows drives growth. Increasing digitalization of small healthcare facilities further accelerates segment expansion.
- By End User
On the basis of end user, the market is segmented into hospitals, ambulatory surgical centers, private physician offices, diagnostics imaging centers, and others. The hospitals segment dominated the market with the largest revenue share of 48.7% in 2025, driven by high patient inflow, advanced imaging infrastructure, and continuous demand for emergency and inpatient diagnostic services. Hospitals extensively use teleradiology for 24/7 reporting and specialist consultation. Integration with PACS and hospital IT systems strengthens adoption. Rising cases of chronic and acute diseases increase imaging demand. Large healthcare networks rely heavily on centralized radiology services. Increasing investments in hospital digital transformation further support dominance.
The diagnostic imaging centers segment is expected to witness the fastest growth rate of 22.2% from 2026 to 2033, driven by increasing outsourcing of radiology services and rising demand for standalone imaging facilities. For instance, imaging centers are increasingly adopting teleradiology platforms to reduce reporting delays and improve service efficiency. Growing preference for specialized diagnostic services supports expansion. Rising outpatient imaging volumes drive adoption. Cloud-based solutions enable cost-effective operations. Increasing partnerships with remote radiologists further accelerate segment growth.
North America Teleradiology Market Regional Analysis
- The United States dominated the teleradiology market with the largest revenue share of 76.05% in 2025, characterized by advanced healthcare IT ecosystems, strong adoption of AI-enabled imaging platforms, and widespread use of cloud-based reporting systems
- Healthcare providers in the country highly value the speed, accuracy, and 24/7 availability offered by teleradiology solutions, along with seamless integration with advanced hospital IT systems such as PACS and EHR platforms
- This widespread adoption is further supported by strong healthcare digital infrastructure, high investment in AI-enabled imaging technologies, and increasing preference for cloud-based radiology services, establishing teleradiology as a critical diagnostic tool for both hospitals and imaging centers
U.S. Teleradiology Market Insight
The United States teleradiology market captured the largest revenue share of 76.05% in 2025 within North America, fueled by the rapid expansion of digital healthcare infrastructure and the growing demand for remote diagnostic services across hospitals and imaging centers. Healthcare providers are increasingly prioritizing faster turnaround times, improved diagnostic accuracy, and 24/7 radiology coverage through advanced teleradiology platforms. The rising shortage of radiologists, combined with increasing imaging volumes, is further propelling market adoption. Moreover, the integration of AI-enabled imaging tools, cloud-based PACS systems, and secure data-sharing platforms is significantly contributing to market expansion.
Canada Teleradiology Market Insight
The Canada teleradiology market is projected to expand at a substantial CAGR throughout the forecast period, primarily driven by increasing demand for remote healthcare services and the need to improve access to specialist radiologists in rural and remote regions. The country’s strong public healthcare system and ongoing digital transformation initiatives are fostering adoption of teleradiology solutions. Canada is also witnessing growing use of cloud-based imaging platforms to improve efficiency and reduce diagnostic delays. Furthermore, rising investments in telehealth infrastructure are supporting expansion across hospitals and diagnostic networks.
Mexico Teleradiology Market Insight
The Mexico teleradiology market is anticipated to grow at a noteworthy CAGR during the forecast period, driven by improving healthcare infrastructure and increasing adoption of digital diagnostic solutions. Rising demand for affordable and efficient imaging services is encouraging hospitals and diagnostic centers to adopt teleradiology platforms. In addition, growing medical tourism and the need for faster diagnostic turnaround times are supporting market growth. The expansion of telemedicine initiatives and increasing collaboration with international healthcare providers are further stimulating market development.
North America Teleradiology Market Share
The North America Teleradiology industry is primarily led by well-established companies, including:
- vRad (U.S.)
- Radiology Partners, Inc., (U.S.)
- StatRad, LLC, (U.S.)
- ONRAD, Inc., (U.S.)
- USARAD Holdings, Inc., (U.S.)
- Teleradiology Solutions, Inc., (U.S.)
- NightHawk Radiology Services, Inc., (U.S.)
- RadNet, Inc., (U.S.)
- Ambra Health, Inc., (U.S.)
- Intelerad Medical Systems Incorporated, (Canada)
- RamSoft Inc., (Canada)
- GE HealthCare (U.S.)
- Koninklijke Philips N.V. (U.S.)
- FUJIFILM Medical Systems (U.S.)
- Siemens Medical Solutions (U.S.)
- Agfa HealthCare Corporation, (Canada)
- Carestream Health, Inc., (U.S.)
- Aidoc Medical, Inc., (U.S.)
- Viz.ai, Inc., (U.S.)
What are the Recent Developments in North America Teleradiology Market?
- In October 2025, RSNA Ventures and Rad AI announced a strategic partnership to integrate generative AI and trusted radiology knowledge directly into radiologists’ workflows, aiming to improve reporting efficiency, reduce workload pressure, and enhance diagnostic accuracy across U.S. healthcare systems. The collaboration focuses on embedding AI-driven insights into teleradiology platforms to support faster, real-time interpretation of medical imaging within hospital networks
- In July 2024, I-MED Radiology Network expanded its North American footprint through strategic acquisition activities, strengthening its remote diagnostic imaging and teleradiology service capabilities. The company aimed to enhance cross-border radiology reporting services by leveraging centralized imaging platforms and expanding specialist access. This move highlights increasing consolidation in the teleradiology service provider landscape
- In March 2024, GE HealthCare, a leading U.S.-based medical technology company, announced advancements in its AI-powered imaging and remote radiology workflow solutions designed to enhance teleradiology efficiency across hospital networks. The upgrade focused on integrating AI-assisted image interpretation into PACS systems, enabling faster diagnosis and improved radiologist productivity in high-volume clinical settings
- In February 2024, researchers introduced advanced multimodal AI vision-language models for radiology, enabling automated report generation and image interpretation support in clinical workflows. These systems are being tested for real-world radiology applications, including draft report generation and imaging history analysis, significantly improving teleradiology efficiency and reducing radiologist workload
- In November 2021, a large-scale deployment of AI-based radiology systems demonstrated real-world application of deep learning in teleradiology workflows, processing millions of imaging datasets to assist radiologists in detecting abnormalities more efficiently. The system improved diagnostic accuracy and supported remote interpretation across distributed healthcare networks
SKU-

- Interactive Data Analysis Dashboard
- Company Analysis Dashboard for high growth potential opportunities
- Research Analyst Access for customization & queries
- Competitor Analysis with Interactive dashboard
- Latest News, Updates & Trend analysis
- Harness the Power of Benchmark Analysis for Comprehensive Competitor Tracking
Data collection and base year analysis are done using data collection modules with large sample sizes. The stage includes obtaining market information or related data through various sources and strategies. It includes examining and planning all the data acquired from the past in advance. It likewise envelops the examination of information inconsistencies seen across different information sources. The market data is analysed and estimated using market statistical and coherent models. Also, market share analysis and key trend analysis are the major success factors in the market report. To know more, please request an analyst call or drop down your inquiry.
The key research methodology used by DBMR research team is data triangulation which involves data mining, analysis of the impact of data variables on the market and primary (industry expert) validation. Data models include Vendor Positioning Grid, Market Time Line Analysis, Market Overview and Guide, Company Positioning Grid, Patent Analysis, Pricing Analysis, Company Market Share Analysis, Standards of Measurement, Global versus Regional and Vendor Share Analysis. To know more about the research methodology, drop in an inquiry to speak to our industry experts.
Data Bridge Market Research is a leader in advanced formative research. We take pride in servicing our existing and new customers with data and analysis that match and suits their goal. The report can be customized to include price trend analysis of target brands understanding the market for additional countries (ask for the list of countries), clinical trial results data, literature review, refurbished market and product base analysis. Market analysis of target competitors can be analyzed from technology-based analysis to market portfolio strategies. We can add as many competitors that you require data about in the format and data style you are looking for. Our team of analysts can also provide you data in crude raw excel files pivot tables (Fact book) or can assist you in creating presentations from the data sets available in the report.


