
North America Textured Butter Market
Market Size in USD Million
 USD
170.60 Million
USD
208.89 Million
2024
2032
USD
170.60 Million
USD
208.89 Million
2024
2032
| 2025 - 2032 | |
| USD 170.60 Million | |
| USD 208.89 Million | |
| % | |
Textured Butter Market Size
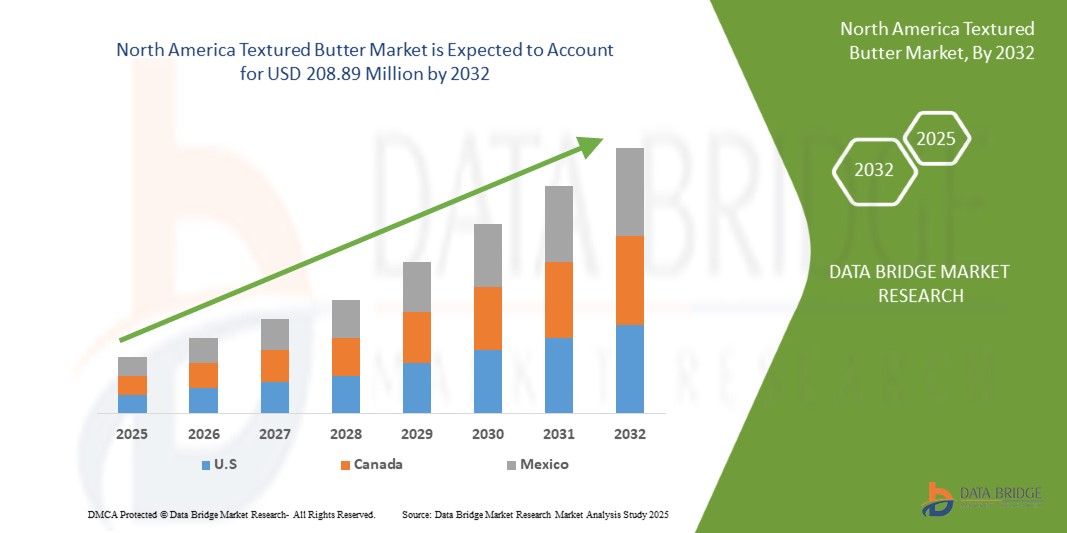
- The North America textured butter market was valued at USD 170.60 million in 2024 and is expected to reach USD 208.89 million by 2032
- During the forecast period of 2025 to 2032 the market is likely to grow at a CAGR of 2.62%, primarily driven by rising consumer demand for enhanced sensory food experiences, clean label trends, and the growing preference for premium, spreadable butter options in both retail and foodservice sectors
- This growth is driven by factors such as rising demand for premium dairy products, increased consumer preference for clean-label and natural ingredients, and innovation in food processing and butter textures
North America Textured Butter Market Analysis
- Rising consumer interest in artisanal and premium dairy products is driving the demand for textured butter. This trend is fueled by evolving taste preferences, health consciousness, and the appeal of rich, creamy textures in gourmet and home cooking applications, particularly in developed and urban markets
- Advancements in food processing technologies have enabled manufacturers to offer butter with improved texture, spreadability, and mouthfeel. These innovations cater to specific culinary uses, including baking and confectionery, boosting their appeal among both commercial food producers and household consumers
- The textured butter market is witnessing growth as consumers increasingly seek products with clean labels, organic certifications, and minimal processing. Butter, especially from grass-fed or organic sources, is perceived as a healthier fat option, boosting its popularity in both traditional and plant-based segments
- For instance, the resurgence of full-fat dairy products in the UK. Retailers like Marks & Spencer and Yeo Valley report rising sales of whole milk and butter, driven by consumer preference for creamier textures and skepticism toward low-fat, processed alternatives
- Textured butter is gaining popularity across various food segments such as bakery, confectionery, sauces, and ready-to-eat meals. Its versatility and ability to enhance flavor and consistency make it an essential ingredient in both domestic and industrial kitchens, expanding its market footprint
Report Scope and Market Segmentation
|
Attributes |
North America Textured Butter Key Market Insights |
|
Segments Covered |
|
|
Countries Covered |
|
|
Market Opportunities |
|
|
Value Added Data Infosets |
In addition to the insights on market scenarios such as market value, growth rate, segmentation, geographical coverage, and major players, the market reports curated by the Data Bridge Market Research also include in-depth expert analysis, pricing analysis, brand share analysis, consumer survey, demography analysis, supply chain analysis, value chain analysis, raw material/consumables overview, vendor selection criteria, PESTLE Analysis, Porter Analysis, and regulatory framework. |
North America Textured Butter Market Trends
“Rising Demand for Premium, Artisanal Dairy Products”
- The North America textured butter market is being shaped by increasing consumer demand for gourmet and artisanal products. As people shift toward premium food experiences, textured butter—with its rich taste and visual appeal—is finding favor in both household kitchens and high-end culinary establishments, especially in urban and developed markets where quality and aesthetics influence buying decisions
- Health-conscious consumers are driving the growth of the textured butter market, with a notable preference for organic and clean-label options. Rich in natural fats and often minimally processed, textured butter aligns with current nutritional trends that favor whole foods over low-fat alternatives, reinforcing its inclusion in balanced, high-quality diets
- The surge in home baking and cooking, accelerated by lifestyle changes post-pandemic, has boosted the demand for specialty ingredients like textured butter. Its enhanced flavor and consistency make it a preferred choice for bakery products, sauces, and spreads, contributing to the diversification of usage across food categories
- For instance, rising consumer preference for artisanal, locally-made products—indicating a broader trend toward gourmet food, including textured butter
Manufacturers are innovating within the textured butter market by introducing plant-based and lactose-free alternatives to cater to vegan and lactose-intolerant consumers. These product innovations, combined with sustainable packaging and sourcing initiatives, are expanding the consumer base and supporting long-term market growth
North America Textured Butter Market Dynamics
Drivers
“Rising Demand For Premium Dairy Products”
- Consumers today are more conscious about the ingredients and processing methods used in their food, leading to a surge in demand for premium dairy products that offer superior taste, texture, and nutritional benefits
- Textured butter, known for its enhanced spreadability, smoothness, and consistency, is becoming a preferred choice among both home cooks and professional chefs. The rise of fine dining, bakery, and confectionery industries has further fueled this trend, as textured butter enhances the quality of pastries, desserts, and premium food offerings. In addition, health-conscious consumers are opting for high-quality butter alternatives that contain fewer additives and preservatives while retaining natural richness
- For instance, In October 2024, Danone announced a USD 21.60 million investment to expand its operations in Punjab, capitalizing on the rising demand for premium dairy products in India. As consumers increasingly seek healthier and high-quality dairy options, Danone aims to grow its market share, competing with established players such as Amul
- In August 2024,edairynews published an article which states that the demand for premium dairy products in India surged as health-conscious consumers prioritized quality over cost. Driven by a growing awareness of natural ingredients, organic, grass-fed, and hormone-free options, the market is seeing increasing consumer preference for products offering superior taste and health benefits, reshaping the dairy sector
- The growth of organic and grass-fed dairy products has contributed to the increasing demand for premium butter varieties. Consumers are willing to pay a premium for products that are ethically sourced, environmentally friendly, and free from artificial ingredients. As a result, dairy manufacturers are innovating with different textures, flavors, and organic certifications to cater to this expanding market segment, further driving the textured butter market’s growth
Opportunities
“Shifting Consumer Inclination Towards Sustainable And Ethical Sourced Products”
- Consumers are increasingly shifting towards sustainable and ethically sourced textured butter, creating significant opportunities for the market. With rising awareness of environmental impact and ethical farming, buyers prefer butter made from responsibly sourced dairy. They look for certifications such as organic, fair trade, and grass-fed, ensuring that the product aligns with their values
- Sustainable sourcing involves eco-friendly farming practices that protect natural resources, reduce carbon footprints, and support biodiversity. Ethical sourcing ensures fair wages for farmers and humane treatment of animals. Many brands are now adopting transparent supply chains to meet these consumer expectations
- The growing demand for such products encourages manufacturers to invest in responsible sourcing and sustainable production methods. Companies that focus on eco-friendly packaging, reduced waste, and ethical ingredient sourcing can gain a competitive edge in the North America textured butter market. As consumer preferences continue to evolve, businesses that align with sustainability and ethical standards will likely experience increased brand loyalty and market growth. This trend presents a lucrative opportunity for manufacturers to expand their product range while meeting the demand for responsible food choices.
For instance,
- In January 2023, a study published on Sustainably Produced Butter: The Effect of Product Knowledge, interest in Sustainability, and Consumer Characteristics on Purchase Frequency highlights that consumer knowledge, interest in sustainability, and product certifications such as organic and fair trade significantly influence the purchase frequency and preferences for ethically sourced butter. This trend emphasizes the growing demand for responsibly produced dairy products
- In August 2024, an article published by Ethical Consumer Research Association Ltd highlights that consumers are increasingly opting for butter and spreads with ethical certifications such as fair-trade and organic, prioritizing sustainability and responsible sourcing in their purchasing decisions
- An article published by the World Wildlife Fund states that sustainable agriculture practices, including eco-friendly dairy farming methods and responsible sourcing, are crucial for protecting natural resources, reducing carbon footprints, and promoting biodiversity
Consumers are increasingly demanding sustainably and ethically sourced textured butter, driving market opportunities. With rising awareness of environmental impact and ethical farming, brands focusing on responsible sourcing, eco-friendly packaging, and transparent supply chains gain a competitive edge. This trend boosts market growth, encouraging manufacturers to align with sustainability and ethical standards.
Restraints/Challenges
“High Production Costs Of Textured Butter”
- Textured butter, due to its specialized production process, requires more advanced technology and higher-quality raw materials, such as organic or grass-fed cream. These factors contribute to its increased cost compared to regular butter. The need for precise manufacturing techniques to achieve the desired consistency and texture further drives up production expenses
- For manufacturers, the higher costs associated with sourcing premium ingredients, maintaining quality control, and investing in specialized equipment can limit the scalability and affordability of textured butter, especially in price-sensitive markets. This, in turn, can restrict its widespread adoption, particularly among small and medium-sized businesses in the food industry that may struggle to absorb the added costs
For instance,
- In December 2024 a report from Fast Company highlighted the surge in butter prices due to supply chain disruptions, labor shortages, and increased production costs. These factors, especially for textured butter, have strained both chefs and consumers, further raising prices for high-quality butter and raw materials
- In April 2024, William Reed Ltd highlighted the rising butter prices are attributed to factors like extreme weather, political instability, and increased energy costs, which are elevating dairy prices and subsequently raising butter production costs. This surge is expected to persist due to sustained demand
The price sensitivity of consumers, especially in developing markets, can hinder the demand for textured butter, as consumers may opt for more affordable alternatives. As a result, the growth of the textured butter market faces challenges, particularly in competing with less expensive fats and oils in the broader food industry.
North America Textured Butter Market Scope
The market is segmented on the basis of type, product type, category and application.
|
Segmentation |
Sub-Segmentation |
|
By Type |
|
|
By Product Type |
|
|
By Category |
|
|
By Application |
|
North America Textured Butter Market Regional Analysis
“U.S. is the Dominant country in the North America Textured Butter Market”
- U.S. is expected to dominate the textured butter market due to increasing consumer demand for natural and organic butter products, driven by health consciousness and preference for minimally processed foods. Additionally, the thriving bakery and confectionery industries significantly contribute to this growth.
“U.S. is Projected to Register the Highest Growth Rate”
- U.S. is projected to register the highest growth rate due to rising demand for premium dairy products, increasing consumer preference for clean-label and organic ingredients, strong presence of artisanal butter brands, and supportive regulatory frameworks promoting natural and high-quality food offerings.
Textured Butter Market Share
The market competitive landscape provides details by competitor. Details included are company overview, company financials, revenue generated, market potential, investment in research and development, new market initiatives, global presence, production sites and facilities, production capacities, company strengths and weaknesses, product launch, product width and breadth, application dominance. The above data points provided are only related to the companies' focus related to market.
Latest Developments in North America Textured Butter Market
- In January, Lactalis Ingredients is rolling out a new graphic identity for the packaging of its butter range. This update is part of the company's ongoing efforts to enhance brand visibility and modernize its product presentation. The new design aims to reflect Lactalis’ commitment to quality, innovation, and sustainability while making the packaging more appealing to consumers. This development helps Lactalis Ingredients strengthen brand recognition, improve consumer appeal, and reinforce its commitment to quality, innovation, and sustainability
- In March, Lakeland Dairies has completed the acquisition of De Brandt Dairy International NV, a Belgian-based butterfat business, aiming to enhance its value-added capabilities and expand its presence in the European market. And has strengthened its position in the European butter market, opening new markets and product categories. This strategic move is expected to deliver stronger returns to its farm families and further develop its world-class product offerings for both current and future customers
- In February, FrieslandCampina announced its intention to relocate butter production to Lochem, Netherlands, as part of efforts to enhance efficiency and sustainability. This move includes the planned closure of the Den Bosch facility by early 2025, impacting around 90 employees, for whom the company will provide support and alternative job opportunities. The relocation aims to optimize production processes while ensuring long-term operational improvements. FrieslandCampina emphasizes that the decision is still subject to employee consultations and regulatory approvals before final implementation
SKU-

- Interactive Data Analysis Dashboard
- Company Analysis Dashboard for high growth potential opportunities
- Research Analyst Access for customization & queries
- Competitor Analysis with Interactive dashboard
- Latest News, Updates & Trend analysis
- Harness the Power of Benchmark Analysis for Comprehensive Competitor Tracking
Table of Content
1 INTRODUCTION
1.1 OBJECTIVES OF THE STUDY
1.2 MARKET DEFINITION
1.3 OVERVIEW
1.4 LIMITATIONS
1.5 MARKETS COVERED
2 MARKET SEGMENTATION
2.1 MARKETS COVERED
2.2 GEOGRAPHICAL SCOPE
2.3 YEARS CONSIDERED FOR THE STUDY
2.4 CURRENCY AND PRICING
2.5 DBMR TRIPOD DATA VALIDATION MODEL
2.6 MULTIVARIATE MODELING
2.7 PRIMARY INTERVIEWS WITH KEY OPINION LEADERS
2.8 DBMR MARKET POSITION GRID
2.9 MARKET APPLICATION COVERAGE GRID
2.1 DBMR VENDOR SHARE ANALYSIS
2.11 SECONDARY SOURCES
2.12 ASSUMPTIONS
3 EXECUTIVE SUMMARY
4 PREMIUM INSIGHTS
4.1 PORTER’S FIVE FORCES
4.1.1 THREAT OF NEW ENTRANTS
4.1.2 BARGAINING POWER OF SUPPLIERS
4.1.3 BARGAINING POWER OF BUYERS
4.1.4 THREAT OF SUBSTITUTE PRODUCTS
4.1.5 INDUSTRY RIVALRY
4.1.6 CONCLUSION
4.2 IMPORT EXPORT SCENARIO
4.3 PRICING ANALYSIS
4.4 VALUE CHAIN ANALYSIS
4.5 PRODUCTION CAPACITY FOR TOP MANUFACTURERS
4.6 BRAND OUTLOOK
4.7 CLIMATE CHANGE SCENARIO AND ITS IMPACT ON THE NORTH AMERICA TEXTURED BUTTER MARKET
4.7.1 ENVIRONMENTAL CONCERNS
4.7.1.1 RISING TEMPERATURES AND DAIRY PRODUCTIVITY
4.7.1.2 WATER SCARCITY AND RESOURCE USE
4.7.1.3 GREENHOUSE GAS (GHG) EMISSIONS FROM DAIRY FARMING
4.7.1.4 DEFORESTATION AND LAND USE
4.7.2 INDUSTRY RESPONSE
4.7.2.1 SUSTAINABLE DAIRY FARMING PRACTICES
4.7.2.2 RENEWABLE ENERGY INTEGRATION
4.7.2.3 SUSTAINABLE PACKAGING AND WASTE REDUCTION
4.7.3 GOVERNMENT’S ROLE
4.7.3.1 CLIMATE REGULATIONS AND CARBON TAXES
4.7.3.2 RESEARCH AND DEVELOPMENT (R&D) SUPPORT
4.7.3.3 TRADE POLICIES AND SUSTAINABILITY STANDARDS
4.7.4 ANALYST RECOMMENDATIONS
4.7.4.1 INVEST IN CLIMATE-RESILIENT SUPPLY CHAINS
4.7.4.2 PARTNER WITH SUSTAINABLE DAIRY FARMS
4.7.4.3 DIVERSIFY PRODUCT OFFERINGS
4.7.4.4 STRENGTHEN GOVERNMENT AND INDUSTRY COLLABORATION
4.7.5 CONCLUSION
4.8 CLIENT’S DATASET
4.8.1 LINDT & SPRÜNGLI
4.8.2 FERRERO GROUP
4.8.3 LANTMÄNNEN UNIBAKE
4.8.4 BRIDOR:
4.8.5 VANDEMOORTELE
4.8.6 MONDELEZ INTERNATIONAL
4.8.7 FRONERI
4.8.8 DÉLIFRANCE
4.8.9 WEWALKA
4.8.10 CÉRÉLIA
4.8.11 GRUPO BIMBO
4.8.12 LA LORRAINE BAKERY GROUP
4.8.13 ARYZTA AG
4.8.14 PHOON HUAT PTE LTD
4.8.15 CHEESE AND FOOD CO., LTD
4.8.16 AL-AHLAM COMPANY
4.8.17 UNILEVER
4.8.18 DEK SRL
4.8.19 NESTLÉ MEXICO S.A. DE C.V
4.8.20 PT TIRTA ALAM SEGAR
4.8.21 HAJI RAZAK HAJI HABIB JANOO
4.8.22 KELLAS INC.
4.8.23 WS WARMSENER SPEZIALITÄTEN GMBH
4.9 FACTORS INFLUENCING THE PURCHASING DECISION OF END-USERS FOR THE NORTH AMERICA TEXTURED BUTTER MARKET
4.9.1 QUALITY AND TEXTURE
4.9.2 HEALTH AND NUTRITIONAL BENEFITS
4.9.3 INGREDIENT TRANSPARENCY AND CLEAN LABELING
4.9.4 SUSTAINABILITY AND ETHICAL SOURCING
4.9.5 FLAVOR AND PRODUCT VARIETY
4.9.6 PRICE SENSITIVITY AND AFFORDABILITY
4.9.7 BRAND REPUTATION AND TRUST
4.9.8 CONVENIENCE AND ACCESSIBILITY
4.9.9 REGULATORY COMPLIANCE AND SAFETY STANDARDS
4.9.10 MARKETING AND PROMOTIONAL STRATEGIES
4.9.11 CONCLUSION
4.1 GROWTH STRATEGIES ADOPTED BY KEY MARKET PLAYERS FOR THE NORTH AMERICA TEXTURED BUTTER MARKET
4.10.1 PRODUCT INNOVATION AND DIFFERENTIATION
4.10.2 EXPANSION INTO EMERGING MARKETS
4.10.3 SUSTAINABLE AND CLEAN LABEL PRODUCTS
4.10.4 STRENGTHENING DISTRIBUTION CHANNEL
4.10.5 STRATEGIC MERGERS AND ACQUISITIONS (M&A)
4.10.6 INVESTMENTS IN ADVANCED PROCESSING TECHNOLOGIES
4.10.7 MARKETING AND BRANDING STRATEGIES
4.10.8 FOCUS ON HEALTH AND WELLNESS TRENDS
4.10.9 CONCLUSION
4.11 IMPACT OF ECONOMIC SLOWDOWN ON THE NORTH AMERICA TEXTURED BUTTER MARKET
4.11.1 IMPACT ON PRICE
4.11.2 IMPACT ON SUPPLY CHAIN
4.11.3 IMPACT ON SHIPMENT
4.11.4 IMPACT ON COMPANY’S STRATEGIC DECISIONS
4.11.5 CONCLUSION
4.12 INDUSTRY TRENDS AND FUTURE PERSPECTIVE OF THE NORTH AMERICA TEXTURED BUTTER MARKET
4.12.1 RISING DEMAND FOR PREMIUM AND ARTISANAL BUTTER
4.12.2 GROWING POPULARITY OF FUNCTIONAL AND FORTIFIED BUTTER
4.12.3 EXPANSION OF PLANT-BASED AND DAIRY-FREE ALTERNATIVES
4.12.4 TECHNOLOGICAL INNOVATIONS IN BUTTER PROCESSING
4.12.5 CLEAN LABEL AND TRANSPARENCY TRENDS
4.12.6 SUSTAINABILITY AND ETHICAL SOURCING
4.12.7 E-COMMERCE AND DIRECT-TO-CONSUMER GROWTH
4.12.8 EXPANDING APPLICATIONS IN THE FOOD INDUSTRY
4.12.9 CONCLUSION
4.13 OVERVIEW OF TECHNOLOGICAL INNOVATIONS
4.13.1 ADVANCED PROCESSING TECHNIQUES
4.13.1.1 MICROENCAPSULATION FOR IMPROVED STABILITY
4.13.1.2 CONTROLLED CRYSTALLIZATION FOR OPTIMAL TEXTURE
4.13.1.3 HIGH-PRESSURE PROCESSING (HPP)
4.13.2 AUTOMATION AND ARTIFICIAL INTELLIGENCE (AI) IN BUTTER PRODUCTION
4.13.2.1 AI-POWERED QUALITY CONTROL
4.13.2.2 ROBOTICS AND SMART MANUFACTURING
4.13.2.3 PREDICTIVE MAINTENANCE IN DAIRY PROCESSING
4.13.3 INGREDIENT INNOVATIONS AND FUNCTIONAL ENHANCEMENTS
4.13.3.1 FORTIFIED AND FUNCTIONAL BUTTER
4.13.3.2 HYBRID BUTTER PRODUCTS
4.13.3.3 CLEAN-LABEL AND NATURAL INGREDIENTS
4.13.4 SUSTAINABLE AND ECO-FRIENDLY INNOVATIONS
4.13.4.1 CARBON-NEUTRAL DAIRY PRODUCTION
4.13.4.2 BIODEGRADABLE AND RECYCLABLE PACKAGING
4.13.5 INNOVATIONS IN DISTRIBUTION AND CONSUMER ENGAGEMENT
4.13.5.1 BLOCKCHAIN FOR SUPPLY CHAIN TRANSPARENCY
4.13.5.2 DIRECT-TO-CONSUMER (DTC) SALES AND SUBSCRIPTION MODELS
4.13.5.3 SMART LABELING AND AUGMENTED REALITY (AR)
4.13.6 CONCLUSION
4.14 RAW MATERIAL SOURCING ANALYSIS
4.14.1 INTRODUCTION
4.14.2 DAIRY-BASED RAW MATERIAL SOURCING
4.14.3 PLANT-BASED FAT SOURCING FOR ALTERNATIVE BUTTER VARIETIES
4.14.4 ADDITIVES AND FUNCTIONAL INGREDIENTS SOURCING
4.14.5 SUPPLY CHAIN CHALLENGES AND RISKS
4.14.6 SUSTAINABILITY AND ETHICAL SOURCING INITIATIVES
4.14.7 FUTURE TRENDS IN RAW MATERIAL SOURCING
4.14.8 CONCLUSION
4.15 SUPPLY CHAIN ANALYSIS OF THE NORTH AMERICA TEXTURED BUTTER MARKET
4.15.1 LOGISTICS COST SCENARIO
4.15.1.1 RISING TRANSPORTATION COSTS
4.15.1.2 WAREHOUSING AND STORAGE EXPENSES
4.15.1.3 CUSTOMS AND TARIFFS IMPACTING COSTS
4.15.1.4 LAST-MILE DELIVERY CHALLENGES
4.15.2 IMPORTANCE OF LOGISTICS SERVICE PROVIDERS IN THE TEXTURED BUTTER MARKET
4.15.2.1 ENSURING COLD CHAIN MANAGEMENT
4.15.3 ENHANCING SUPPLY CHAIN EFFICIENCY
4.15.3.1 MANAGING INTERNATIONAL TRADE COMPLIANCE
4.15.3.2 COST OPTIMIZATION STRATEGIES
4.15.3.3 ADAPTING TO MARKET CHANGES
4.15.4 CONCLUSION
5 REGULATION COVERAGE
6 MARKET OVERVIEW
6.1 DRIVERS
6.1.1 RISING DEMAND FOR PREMIUM DAIRY PRODUCTS
6.1.2 RAPIDLY EXPANDING BAKERY AND CONFECTIONERY INDUSTRY
6.1.3 INCREASED DEMAND FOR NATURAL AND ORGANIC PRODUCTS
6.1.4 INCREASED USAGE OF BUTTER IN FOOD PROCESSING AND FOOD SERVICE INDUSTRY
6.2 RESTRAINTS
6.2.1 HIGH PRODUCTION COSTS OF TEXTURED BUTTER
6.2.2 COMPLIANCE WITH FOOD SAFETY AND DAIRY PRODUCT REGULATIONS LIMITING MARKET EXPANSION
6.3 OPPORTUNITIES
6.3.1 SHIFTING CONSUMER INCLINATION TOWARDS SUSTAINABLE AND ETHICAL SOURCED PRODUCTS
6.3.2 RISING URBANIZATION AND CHANGING DIETARY HABITS
6.3.3 DEVELOPMENT OF FLAVORED, ORGANIC, AND FUNCTIONAL BUTTER VARIANTS
6.4 CHALLENGES
6.4.1 HIGH COMPETITION FROM CONVENTIONAL BUTTER
6.4.2 STORAGE AND SHELF-LIFE CONSTRAINTS
7 NORTH AMERICA TEXTURED BUTTER MARKET, BY TYPE
7.1 OVERVIEW
7.2 UNSALTED TEXTURED BUTTER
7.3 SALTED TEXTURED BUTTER
8 NORTH AMERICA TEXTURED BUTTER MARKET, BY PRODUCT TYPE
8.1 OVERVIEW
8.2 ANIMAL BASED (MILK) BUTTER
8.3 PLANT-BASED BUTTER
9 NORTH AMERICA TEXTURED BUTTER MARKET, BY CATEGORY
9.1 OVERVIEW
9.2 ORGANIC
9.3 CONVENTIONAL
10 NORTH AMERICA TEXTURED BUTTER MARKET, BY APPLICATION
10.1 OVERVIEW
10.2 BAKERY
10.3 ICE CREAMS
10.4 SAUCES AND CONDIMENTS
10.5 CONFECTIONERY
10.6 OTHERS
11 NORTH AMERICA TEXTURED BUTTER MARKET, BY REGION
11.1 NORTH AMERICA
11.1.1 U S
11.1.2 CANADA
11.1.3 MEXICO
12 NORTH AMERICA TEXTURED BUTTER MARKET: COMPANY LANDSCAPE
12.1 COMPANY SHARE ANALYSIS: NORTH AMERICA
13 SWOT ANALYSIS
14 COMPANY PROFILES
14.1 LACTALIS
14.1.1 COMPANY SNAPSHOT
14.1.2 COMPANY SHARE ANALYSIS
14.1.3 PRODUCT PORTFOLIO
14.1.4 RECENT DEVELOPMENT
14.2 LAKELAND DAIRIES
14.2.1 COMPANY SNAPSHOTS
14.2.2 COMPANY SHARE ANALYSIS
14.2.3 PRODUCT PORTFOLIO
14.2.4 RECENT DEVELOPMENT/NEWS
14.3 UELZENA INGREDIENTS
14.3.1 COMPANY SNAPSHOT
14.3.2 COMPANY SHARE ANALYSIS
14.3.3 PRODUCT PORTFOLIO
14.3.4 RECENT DEVELOPMENT
14.4 FRIESLANDCAMPINA PROFESSIONAL
14.4.1 COMPANY SNAPSHOT
14.4.2 COMPANY SHARE ANALYSIS
14.4.3 PRODUCT PORTFOLIO
14.4.4 RECENT DEVELOPMENT
14.5 FLECHARD SAS
14.5.1. COMPANY SNAPSHOT
14.5.2. COMPANY SHARE ANALYSIS
14.5.3. PRODUCT PORTFOLIO
14.5.4. RECENT DEVELOPMENT
14.6. CORMAN
14.6.1. COMPANY SNAPSHOT
14.6.2. PRODUCT PORTFOLIO
14.6.3. RECENT DEVELOPMENT
14.7. NUMIDIA BV
14.7.1. COMPANY SNAPSHOTS
14.7.2. PRODUCT PORTFOLIO
14.7.3. RECENT DEVELOPMENT/NEWS
14.8. ROYAL VIVBUISMAN
14.8.1. COMPANY SNAPSHOT
14.8.2. PRODUCT PORTFOLIO
14.8.3. RECENT DEVELOPMENT
15 QUESTIONNAIRE
16 RELATED REPORTS
List of Table
TABLE 1 PRODUCTION CAPACITY FOR TOP MANUFACTURERS
TABLE 2 COMPARATIVE BRAND ANALYSIS
TABLE 3 REGULATORY COVERAGE
TABLE 4 NORTH AMERICA TEXTURED BUTTER MARKET, BY TYPE, 2018-2032 (USD THOUSAND)
TABLE 5 NORTH AMERICA TEXTURED BUTTER MARKET, BY TYPE, 2018-2032 (TONS)
TABLE 6 NORTH AMERICA UNSALTED TEXTURED BUTTER IN TEXTURED BUTTER MARKET, BY REGION, 2018-2032 (USD THOUSAND)
TABLE 7 NORTH AMERICA UNSALTED TEXTURED BUTTER IN TEXTURED BUTTER MARKET, BY REGION, 2018-2032 (TONS)
TABLE 8 NORTH AMERICA SALTED TEXTURED BUTTER IN TEXTURED BUTTER MARKET, BY REGION, 2018-2032 (USD THOUSAND)
TABLE 9 NORTH AMERICA SALTED TEXTURED BUTTER IN TEXTURED BUTTER MARKET, BY REGION, 2018-2032 (TONS)
TABLE 10 NORTH AMERICA TEXTURED BUTTER MARKET, BY PRODUCT TYPE, 2018-2032 (USD THOUSAND)
TABLE 11 NORTH AMERICA TEXTURED BUTTER MARKET, BY PRODUCT TYPE, 2018-2032 (TONS)
TABLE 12 NORTH AMERICA ANIMAL BASED (MILK) BUTTER IN TEXTURED BUTTER MARKET, BY REGION, 2018-2032 (USD THOUSAND)
TABLE 13 NORTH AMERICA ANIMAL BASED (MILK) BUTTER IN TEXTURED BUTTER MARKET, BY REGION, 2018-2032 (TONS)
TABLE 14 NORTH AMERICA PLANT-BASED BUTTER IN TEXTURED BUTTER MARKET, BY REGION, 2018-2032 (USD THOUSAND)
TABLE 15 NORTH AMERICA PLANT-BASED BUTTER IN TEXTURED BUTTER MARKET, BY REGION, 2018-2032 (TONS)
TABLE 16 NORTH AMERICA TEXTURED BUTTER MARKET, BY CATEGORY, 2018-2032 (USD THOUSAND)
TABLE 17 NORTH AMERICA TEXTURED BUTTER MARKET, BY CATEGORY, 2018-2032 (TONS)
TABLE 18 NORTH AMERICA ORGANIC IN TEXTURED BUTTER MARKET, BY REGION, 2018-2032 (USD THOUSAND)
TABLE 19 NORTH AMERICA ORGANIC IN TEXTURED BUTTER MARKET, BY REGION, 2018-2032 (TONS)
TABLE 20 NORTH AMERICA CONVENTIONAL IN TEXTURED BUTTER MARKET, BY REGION, 2018-2032 (USD THOUSAND)
TABLE 21 NORTH AMERICA CONVENTIONAL IN TEXTURED BUTTER MARKET, BY REGION, 2018-2032 (TONS)
TABLE 22 NORTH AMERICA TEXTURED BUTTER MARKET, BY APPLICATION, 2018-2032 (USD THOUSAND)
TABLE 23 NORTH AMERICA TEXTURED BUTTER MARKET, BY APPLICATION, 2018-2032 (TONS)
TABLE 24 NORTH AMERICA BAKERY IN TEXTURED BUTTER MARKET, BY REGION, 2018-2032 (USD THOUSAND)
TABLE 25 NORTH AMERICA BAKERY IN TEXTURED BUTTER MARKET, BY REGION, 2018-2032 (TONS)
TABLE 26 NORTH AMERICA BAKERY IN TEXTURED BUTTER MARKET, BY TYPE, 2018-2032 (USD THOUSAND)
TABLE 27 NORTH AMERICA BAKERY IN TEXTURED BUTTER MARKET, BY BUTTER TYPE, 2018-2032 (USD THOUSAND)
TABLE 28 NORTH AMERICA BAKERY IN TEXTURED BUTTER MARKET, BY BUTTER PRODUCT TYPE, 2018-2032 (USD THOUSAND)
TABLE 29 NORTH AMERICA ICE CREAMS IN TEXTURED BUTTER MARKET, BY REGION, 2018-2032 (USD THOUSAND)
TABLE 30 NORTH AMERICA ICE CREAMS IN TEXTURED BUTTER MARKET, BY REGION, 2018-2032 (TONS)
TABLE 31 NORTH AMERICA ICE CREAMS IN TEXTURED BUTTER MARKET, BY BUTTER TYPE, 2018-2032 (USD THOUSAND)
TABLE 32 NORTH AMERICA ICE CREAMS IN TEXTURED BUTTER MARKET, BY BUTTER PRODUCT TYPE, 2018-2032 (USD THOUSAND)
TABLE 33 NORTH AMERICA SAUCES AND CONDIMENTS IN TEXTURED BUTTER MARKET, BY REGION, 2018-2032 (USD THOUSAND)
TABLE 34 NORTH AMERICA SAUCES AND CONDIMENTS IN TEXTURED BUTTER MARKET, BY REGION, 2018-2032 (TONS)
TABLE 35 NORTH AMERICA SAUCES AND CONDIMENTS IN TEXTURED BUTTER MARKET, BY BUTTER TYPE, 2018-2032 (USD THOUSAND)
TABLE 36 NORTH AMERICA SAUCES AND CONDIMENTS IN TEXTURED BUTTER MARKET, BY BUTTER PRODUCT TYPE, 2018-2032 (USD THOUSAND)
TABLE 37 NORTH AMERICA CONFECTIONERY IN TEXTURED BUTTER MARKET, BY REGION, 2018-2032 (USD THOUSAND)
TABLE 38 NORTH AMERICA CONFECTIONERY IN TEXTURED BUTTER MARKET, BY REGION, 2018-2032 (TONS)
TABLE 39 NORTH AMERICA CONFECTIONERY IN TEXTURED BUTTER MARKET, BY BUTTER TYPE, 2018-2032 (USD THOUSAND)
TABLE 40 NORTH AMERICA CONFECTIONERY IN TEXTURED BUTTER MARKET, BY BUTTER PRODUCT TYPE, 2018-2032 (USD THOUSAND)
TABLE 41 NORTH AMERICA OTHERS IN TEXTURED BUTTER MARKET, BY REGION, 2018-2032 (USD THOUSAND)
TABLE 42 NORTH AMERICA OTHERS IN TEXTURED BUTTER MARKET, BY REGION, 2018-2032 (TONS)
TABLE 43 NORTH AMERICA UNSALTED TEXTURED BUTTER IN TEXTURED BUTTER MARKET, BY BUTTER TYPE, 2018-2032 (USD THOUSAND)
TABLE 44 NORTH AMERICA OTHERS IN TEXTURED BUTTER MARKET, BY BUTTER PRODUCT TYPE, 2018-2032 (USD THOUSAND)
TABLE 45 NORTH AMERICA TEXTURED BUTTER MARKET, BY COUNTRY, 2018-2032 (USD THOUSAND)
TABLE 46 NORTH AMERICA TEXTURED BUTTER MARKET, BY COUNTRY, 2018-2032 (TONS)
TABLE 47 NORTH AMERICA TEXTURED BUTTER MARKET, BY TYPE, 2018-2032 (USD THOUSAND)
TABLE 48 NORTH AMERICA TEXTURED BUTTER MARKET, BY TYPE, 2018-2032 (TONS)
TABLE 49 NORTH AMERICA TEXTURED BUTTER MARKET, BY PRODUCT TYPE, 2018-2032 (USD THOUSAND)
TABLE 50 NORTH AMERICA TEXTURED BUTTER MARKET, BY PRODUCT TYPE, 2018-2032 (TONS)
TABLE 51 NORTH AMERICA TEXTURED BUTTER MARKET, BY CATEGORY, 2018-2032 (USD THOUSAND)
TABLE 52 NORTH AMERICA TEXTURED BUTTER MARKET, BY CATEGORY, 2018-2032 (TONS)
TABLE 53 NORTH AMERICA TEXTURED BUTTER MARKET, BY APPLICATION, 2018-2032 (USD THOUSAND)
TABLE 54 NORTH AMERICA TEXTURED BUTTER MARKET, BY APPLICATION, 2018-2032 (TONS)
TABLE 55 NORTH AMERICA BAKERY IN TEXTURED BUTTER MARKET, BY TYPE, 2018-2032 (USD THOUSAND)
TABLE 56 NORTH AMERICA BAKERY IN TEXTURED BUTTER MARKET, BY BUTTER TYPE, 2018-2032 (USD THOUSAND)
TABLE 57 NORTH AMERICA BAKERY IN TEXTURED BUTTER MARKET, BY BUTTER PRODUCT TYPE, 2018-2032 (USD THOUSAND)
TABLE 58 NORTH AMERICA ICE CREAMS IN TEXTURED BUTTER MARKET, BY BUTTER TYPE, 2018-2032 (USD THOUSAND)
TABLE 59 NORTH AMERICA ICE CREAMS IN TEXTURED BUTTER MARKET, BY BUTTER PRODUCT TYPE, 2018-2032 (USD THOUSAND)
TABLE 60 NORTH AMERICA SAUCES AND CONDIMENTS IN TEXTURED BUTTER MARKET, BY BUTTER TYPE, 2018-2032 (USD THOUSAND)
TABLE 61 NORTH AMERICA SAUCES AND CONDIMENTS IN TEXTURED BUTTER MARKET, BY BUTTER PRODUCT TYPE, 2018-2032 (USD THOUSAND)
TABLE 62 NORTH AMERICA CONFECTIONERY IN TEXTURED BUTTER MARKET, BY BUTTER TYPE, 2018-2032 (USD THOUSAND)
TABLE 63 NORTH AMERICA CONFECTIONERY IN TEXTURED BUTTER MARKET, BY BUTTER PRODUCT TYPE, 2018-2032 (USD THOUSAND)
TABLE 64 NORTH AMERICA OTHERS IN TEXTURED BUTTER MARKET, BY BUTTER TYPE, 2018-2032 (USD THOUSAND)
TABLE 65 NORTH AMERICA OTHERS IN TEXTURED BUTTER MARKET, BY BUTTER PRODUCT TYPE, 2018-2032 (USD THOUSAND)
TABLE 66 U.S. TEXTURED BUTTER MARKET, BY TYPE, 2018-2032 (USD THOUSAND)
TABLE 67 U.S. TEXTURED BUTTER MARKET, BY TYPE, 2018-2032 (TONS)
TABLE 68 U.S. TEXTURED BUTTER MARKET, BY PRODUCT TYPE, 2018-2032 (USD THOUSAND)
TABLE 69 U.S. TEXTURED BUTTER MARKET, BY PRODUCT TYPE, 2018-2032 (TONS)
TABLE 70 U.S. TEXTURED BUTTER MARKET, BY CATEGORY, 2018-2032 (USD THOUSAND)
TABLE 71 U.S. TEXTURED BUTTER MARKET, BY CATEGORY, 2018-2032 (TONS)
TABLE 72 U.S. TEXTURED BUTTER MARKET, BY APPLICATION, 2018-2032 (USD THOUSAND)
TABLE 73 U.S. TEXTURED BUTTER MARKET, BY APPLICATION, 2018-2032 (TONS)
TABLE 74 U.S. BAKERY IN TEXTURED BUTTER MARKET, BY TYPE, 2018-2032 (USD THOUSAND)
TABLE 75 U.S. BAKERY IN TEXTURED BUTTER MARKET, BY BUTTER TYPE, 2018-2032 (USD THOUSAND)
TABLE 76 U.S. BAKERY IN TEXTURED BUTTER MARKET, BY BUTTER PRODUCT TYPE, 2018-2032 (USD THOUSAND)
TABLE 77 U.S. ICE CREAMS IN TEXTURED BUTTER MARKET, BY BUTTER TYPE, 2018-2032 (USD THOUSAND)
TABLE 78 U.S. ICE CREAMS IN TEXTURED BUTTER MARKET, BY BUTTER PRODUCT TYPE, 2018-2032 (USD THOUSAND)
TABLE 79 U.S. SAUCES AND CONDIMENTS IN TEXTURED BUTTER MARKET, BY BUTTER TYPE, 2018-2032 (USD THOUSAND)
TABLE 80 U.S. SAUCES AND CONDIMENTS IN TEXTURED BUTTER MARKET, BY BUTTER PRODUCT TYPE, 2018-2032 (USD THOUSAND)
TABLE 81 U.S. CONFECTIONERY IN TEXTURED BUTTER MARKET, BY BUTTER TYPE, 2018-2032 (USD THOUSAND)
TABLE 82 U.S. CONFECTIONERY IN TEXTURED BUTTER MARKET, BY BUTTER PRODUCT TYPE, 2018-2032 (USD THOUSAND)
TABLE 83 U.S. OTHERS IN TEXTURED BUTTER MARKET, BY BUTTER TYPE, 2018-2032 (USD THOUSAND)
TABLE 84 U.S. OTHERS IN TEXTURED BUTTER MARKET, BY BUTTER PRODUCT TYPE, 2018-2032 (USD THOUSAND)
TABLE 85 CANADA TEXTURED BUTTER MARKET, BY TYPE, 2018-2032 (USD THOUSAND)
TABLE 86 CANADA TEXTURED BUTTER MARKET, BY TYPE, 2018-2032 (TONS)
TABLE 87 CANADA TEXTURED BUTTER MARKET, BY PRODUCT TYPE, 2018-2032 (USD THOUSAND)
TABLE 88 CANADA TEXTURED BUTTER MARKET, BY PRODUCT TYPE, 2018-2032 (TONS)
TABLE 89 CANADA TEXTURED BUTTER MARKET, BY CATEGORY, 2018-2032 (USD THOUSAND)
TABLE 90 CANADA TEXTURED BUTTER MARKET, BY CATEGORY, 2018-2032 (TONS)
TABLE 91 CANADA TEXTURED BUTTER MARKET, BY APPLICATION, 2018-2032 (USD THOUSAND)
TABLE 92 CANADA TEXTURED BUTTER MARKET, BY APPLICATION, 2018-2032 (TONS)
TABLE 93 CANADA BAKERY IN TEXTURED BUTTER MARKET, BY TYPE, 2018-2032 (USD THOUSAND)
TABLE 94 CANADA BAKERY IN TEXTURED BUTTER MARKET, BY BUTTER TYPE, 2018-2032 (USD THOUSAND)
TABLE 95 CANADA BAKERY IN TEXTURED BUTTER MARKET, BY BUTTER PRODUCT TYPE, 2018-2032 (USD THOUSAND)
TABLE 96 CANADA ICE CREAMS IN TEXTURED BUTTER MARKET, BY BUTTER TYPE, 2018-2032 (USD THOUSAND)
TABLE 97 CANADA ICE CREAMS IN TEXTURED BUTTER MARKET, BY BUTTER PRODUCT TYPE, 2018-2032 (USD THOUSAND)
TABLE 98 CANADA SAUCES AND CONDIMENTS IN TEXTURED BUTTER MARKET, BY BUTTER TYPE, 2018-2032 (USD THOUSAND)
TABLE 99 CANADA SAUCES AND CONDIMENTS IN TEXTURED BUTTER MARKET, BY BUTTER PRODUCT TYPE, 2018-2032 (USD THOUSAND)
TABLE 100 CANADA CONFECTIONERY IN TEXTURED BUTTER MARKET, BY BUTTER TYPE, 2018-2032 (USD THOUSAND)
TABLE 101 CANADA CONFECTIONERY IN TEXTURED BUTTER MARKET, BY BUTTER PRODUCT TYPE, 2018-2032 (USD THOUSAND)
TABLE 102 CANADA OTHERS IN TEXTURED BUTTER MARKET, BY BUTTER TYPE, 2018-2032 (USD THOUSAND)
TABLE 103 CANADA OTHERS IN TEXTURED BUTTER MARKET, BY BUTTER PRODUCT TYPE, 2018-2032 (USD THOUSAND)
TABLE 104 MEXICO TEXTURED BUTTER MARKET, BY TYPE, 2018-2032 (USD THOUSAND)
TABLE 105 MEXICO TEXTURED BUTTER MARKET, BY TYPE, 2018-2032 (TONS)
TABLE 106 MEXICO TEXTURED BUTTER MARKET, BY PRODUCT TYPE, 2018-2032 (USD THOUSAND)
TABLE 107 MEXICO TEXTURED BUTTER MARKET, BY PRODUCT TYPE, 2018-2032 (TONS)
TABLE 108 MEXICO TEXTURED BUTTER MARKET, BY CATEGORY, 2018-2032 (USD THOUSAND)
TABLE 109 MEXICO TEXTURED BUTTER MARKET, BY CATEGORY, 2018-2032 (TONS)
TABLE 110 MEXICO TEXTURED BUTTER MARKET, BY APPLICATION, 2018-2032 (USD THOUSAND)
TABLE 111 MEXICO TEXTURED BUTTER MARKET, BY APPLICATION, 2018-2032 (TONS)
TABLE 112 MEXICO BAKERY IN TEXTURED BUTTER MARKET, BY TYPE, 2018-2032 (USD THOUSAND)
TABLE 113 MEXICO BAKERY IN TEXTURED BUTTER MARKET, BY BUTTER TYPE, 2018-2032 (USD THOUSAND)
TABLE 114 MEXICO BAKERY IN TEXTURED BUTTER MARKET, BY BUTTER PRODUCT TYPE, 2018-2032 (USD THOUSAND)
TABLE 115 MEXICO ICE CREAMS IN TEXTURED BUTTER MARKET, BY BUTTER TYPE, 2018-2032 (USD THOUSAND)
TABLE 116 MEXICO ICE CREAMS IN TEXTURED BUTTER MARKET, BY BUTTER PRODUCT TYPE, 2018-2032 (USD THOUSAND)
TABLE 117 MEXICO SAUCES AND CONDIMENTS IN TEXTURED BUTTER MARKET, BY BUTTER TYPE, 2018-2032 (USD THOUSAND)
TABLE 118 MEXICO SAUCES AND CONDIMENTS IN TEXTURED BUTTER MARKET, BY BUTTER PRODUCT TYPE, 2018-2032 (USD THOUSAND)
TABLE 119 MEXICO CONFECTIONERY IN TEXTURED BUTTER MARKET, BY BUTTER TYPE, 2018-2032 (USD THOUSAND)
TABLE 120 MEXICO CONFECTIONERY IN TEXTURED BUTTER MARKET, BY BUTTER PRODUCT TYPE, 2018-2032 (USD THOUSAND)
TABLE 121 MEXICO OTHERS IN TEXTURED BUTTER MARKET, BY BUTTER TYPE, 2018-2032 (USD THOUSAND)
TABLE 122 MEXICO OTHERS IN TEXTURED BUTTER MARKET, BY BUTTER PRODUCT TYPE, 2018-2032 (USD THOUSAND)
List of Figure
FIGURE 1 NORTH AMERICA TEXTURED BUTTER MARKET
FIGURE 2 NORTH AMERICA TEXTURED BUTTER MARKET: DATA TRIANGULATION
FIGURE 3 NORTH AMERICA TEXTURED BUTTER MARKET: DROC ANALYSIS
FIGURE 4 NORTH AMERICA TEXTURED BUTTER MARKET: NORTH AMERICA VS REGIONAL MARKET ANALYSIS
FIGURE 5 NORTH AMERICA TEXTURED BUTTER MARKET: COMPANY RESEARCH ANALYSIS
FIGURE 6 NORTH AMERICA TEXTURED BUTTER MARKET: MULTIVARIATE MODELLING
FIGURE 7 NORTH AMERICA TEXTURED BUTTER MARKET: INTERVIEW DEMOGRAPHICS
FIGURE 8 NORTH AMERICA TEXTURED BUTTER MARKET: DBMR MARKET POSITION GRID
FIGURE 9 MARKET APPLICATION COVERAGE GRID: NORTH AMERICA TEXTURED BUTTER MARKET
FIGURE 10 NORTH AMERICA TEXTURED BUTTER MARKET: VENDOR SHARE ANALYSIS
FIGURE 11 NORTH AMERICA TEXTURED BUTTER MARKET: SEGMENTATION
FIGURE 12 EXECUTIVE SUMMARY
FIGURE 13 TWO SEGMENTS COMPRISE THE NORTH AMERICA TEXTURED BUTTER MARKET, BY TYPE (2024)
FIGURE 14 STRATEGIC DECISIONS
FIGURE 15 RISING DEMAND FOR PREMIUM DAIRY PRODUCTS IS EXPECTED TO DRIVE THE NORTH AMERICA TEXTURED BUTTER MARKET IN THE FORECAST PERIOD
FIGURE 16 THE UNSALTED TEXTURED BUTTER SEGMENT IS EXPECTED TO ACCOUNT FOR THE LARGEST SHARE OF THE NORTH AMERICA TEXTURED BUTTER MARKET IN 2025 AND 2032
FIGURE 17 PORTER’S FIVE FORCES
FIGURE 18 IMPORT EXPORT SCENARIO (USD THOUSAND)
FIGURE 19 NORTH AMERICA TEXTURED BUTTER MARKET, 2024-2032, AVERAGE SELLING PRICE (USD/KG)
FIGURE 20 DRIVERS, RESTRAINTS, OPPORTUNITIES AND CHALLENGES OF NORTH AMERICA TEXTURED BUTTER MARKET
FIGURE 21 NORTH AMERICA TEXTURED BUTTER MARKET: BY TYPE, 2024
FIGURE 22 NORTH AMERICA TEXTURED BUTTER MARKET: BY PRODUCT TYPE, 2024
FIGURE 23 NORTH AMERICA TEXTURED BUTTER MARKET: BY CATEGORY, 2024
FIGURE 24 NORTH AMERICA TEXTURED BUTTER MARKET: BY APPLICATION, 2024
FIGURE 25 NORTH AMERICA TEXTURED BUTTER MARKET: SNAPSHOT, 2024
FIGURE 26 NORTH AMERICA TEXTURED BUTTER MARKET: COMPANY SHARE 2024 (%)
North America Textured Butter Market, Supply Chain Analysis and Ecosystem Framework
To support market growth and help clients navigate the impact of geopolitical shifts, DBMR has integrated in-depth supply chain analysis into its North America Textured Butter Market research reports. This addition empowers clients to respond effectively to global changes affecting their industries. The supply chain analysis section includes detailed insights such as North America Textured Butter Market consumption and production by country, price trend analysis, the impact of tariffs and geopolitical developments, and import and export trends by country and HSN code. It also highlights major suppliers with data on production capacity and company profiles, as well as key importers and exporters. In addition to research, DBMR offers specialized supply chain consulting services backed by over a decade of experience, providing solutions like supplier discovery, supplier risk assessment, price trend analysis, impact evaluation of inflation and trade route changes, and comprehensive market trend analysis.
Data collection and base year analysis are done using data collection modules with large sample sizes. The stage includes obtaining market information or related data through various sources and strategies. It includes examining and planning all the data acquired from the past in advance. It likewise envelops the examination of information inconsistencies seen across different information sources. The market data is analysed and estimated using market statistical and coherent models. Also, market share analysis and key trend analysis are the major success factors in the market report. To know more, please request an analyst call or drop down your inquiry.
The key research methodology used by DBMR research team is data triangulation which involves data mining, analysis of the impact of data variables on the market and primary (industry expert) validation. Data models include Vendor Positioning Grid, Market Time Line Analysis, Market Overview and Guide, Company Positioning Grid, Patent Analysis, Pricing Analysis, Company Market Share Analysis, Standards of Measurement, Global versus Regional and Vendor Share Analysis. To know more about the research methodology, drop in an inquiry to speak to our industry experts.
Data Bridge Market Research is a leader in advanced formative research. We take pride in servicing our existing and new customers with data and analysis that match and suits their goal. The report can be customized to include price trend analysis of target brands understanding the market for additional countries (ask for the list of countries), clinical trial results data, literature review, refurbished market and product base analysis. Market analysis of target competitors can be analyzed from technology-based analysis to market portfolio strategies. We can add as many competitors that you require data about in the format and data style you are looking for. Our team of analysts can also provide you data in crude raw excel files pivot tables (Fact book) or can assist you in creating presentations from the data sets available in the report.


