
North America Uninterruptible Power Supply Ups Market
Market Size in USD Billion
 USD
4.35 Billion
USD
6.99 Billion
2025
2033
USD
4.35 Billion
USD
6.99 Billion
2025
2033
| 2026 - 2033 | |
| USD 4.35 Billion | |
| USD 6.99 Billion | |
| % | |
|
Uninterruptible Power Supply (UPS) Market Size
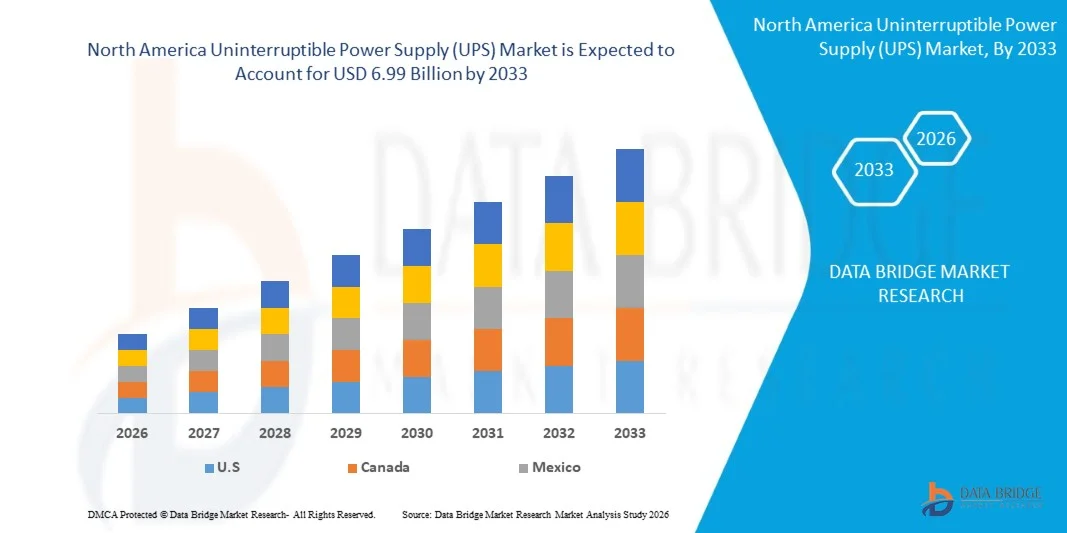
- The North America uninterruptible power supply (UPS) market is expected to reach USD 6.99 Billion by 2033 from USD 4.35 Billion in 2025, growing with a substantial CAGR of 82% in the forecast period of 2026 to 2033
- The North America Uninterruptible Power Supply (UPS) market comprises the regional industry involved in the design, manufacturing, assembly, distribution, integration, and servicing of UPS systems. These systems provide instantaneous backup power and advanced power conditioning to protect electrical and electronic equipment from outages, voltage fluctuations, frequency variations, surges, and grid disturbances. UPS technologies typically operate through battery energy storage and power conversion architectures—including online (double-conversion), line-interactive, and offline/standby systems—ensuring seamless power continuity.
- The North America Uninterruptible Power Supply (UPS) market serves a diverse range of end-use industries across the region, including data centers, telecommunications, healthcare, BFSI, manufacturing, oil & gas, commercial infrastructure, and government sectors. With increasing digitalization, cloud adoption, and reliance on uninterrupted power for critical operations, demand for UPS systems continues to grow, especially in mission-critical environments where downtime can lead to financial and operational losses.
Uninterruptible Power Supply (UPS) Market Analysis
- The North America Uninterruptible Power Supply (UPS) market is a critical segment of the broader power infrastructure industry, focused on ensuring uninterrupted power supply and protecting sensitive equipment from voltage fluctuations, frequency instability, and grid failures. UPS systems play a vital role in maintaining operational continuity across mission-critical environments where even brief power disruptions can lead to financial losses, data corruption, or equipment damage. With ongoing infrastructure modernization and rapid digital transformation, demand for reliable and efficient power protection solutions continues to rise across the region.
- Growth in the North America Uninterruptible Power Supply (UPS) market is primarily driven by the rapid expansion of data centers, telecommunications networks, industrial automation, and commercial infrastructure. Increasing adoption of cloud computing, digital services, and 5G deployment has significantly accelerated the need for high-performance and scalable UPS systems. Additionally, industries such as manufacturing, healthcare, BFSI, government, and oil & gas require continuous and high-quality power supply, further strengthening market demand.
- The U.S. dominates the North America Uninterruptible Power Supply (UPS) market, accounting for approximately 79.53% of market share in 2025. This leadership is supported by large-scale investments in data center infrastructure, strong telecom network expansion, and advanced industrial and commercial ecosystems across the country.
- Canada represents the fastest-growing region in the North America Uninterruptible Power Supply (UPS) market, projected to register a CAGR of 7.15%. Growth is fueled by increasing investments in hyperscale data centers, rising enterprise digitalization, supportive government initiatives, and ongoing infrastructure development across the country.
- In 2025, the hardware segment led the North America Uninterruptible Power Supply (UPS) market, accounting for approximately 74.08% of total market share. This dominance is attributed to the high demand for core UPS components such as rectifiers, inverters, batteries, and control systems. Meanwhile, the software and services segment is gaining momentum due to increasing adoption of remote monitoring, predictive maintenance, and energy management solutions
Report Scope and Uninterruptible Power Supply (UPS) Market Segmentation
|
Attributes |
Uninterruptible Power Supply (UPS) Market Key Market Insights |
|
Segments Covered |
· By Offering: Hardware, Software, and Service · By Power Rating: Less Than 3 KVA, 3-10 KVA, 10 KVA–20 KVA, 20 KVA–50 KVA, 50–100 KVA, 100–200 KVA, 200–500 KVA, 500–1000 KVA, and Above 1000 KVA · By Organization: Small Enterprise Size, Medium Enterprise Size, and Large Enterprise Size · By Form Factor: Standalone UPS, Embedded UPS, and Containerized UPS Systems · By Application: Backup Power, Emergency Power, Voltage Regulation, Power Conditioning, and Critical Power Protection · By Phase: Three Phase, and Single Phase · By Installation: Rack-Mounted, Tower-Based, Floor Standing, Cabinet UPS, and Wall Mounted · By Price Range: Low, Mid, and High · By Energy Storage: VRLA, Lithium-Ion, Flywheel-Based UPS, and Supercapacitor-Based Systems · By Topology: Line Interactive, Stand/Offline, and Online / Double Conversion · By Design: Modular UPS, and Conventional (Monolithic) UPS · By Vertical: Government & Public Sector, IT & Telecom, Hospitality & Tourism, Construction & Real Estate, Healthcare, Energy & Utilities, Media and Entertainment, Manufacturing, Gaming, Data Center, Residential, Retail, BFSI, Education, Oil & Gas, E-Commerce, and Others · By Sales Channel: Direct, and Indirect |
|
Key Market Players |
· ABB LTD (Switzerland) · Schneider Electric (France) · HUAWEI TECHNOLOGIES (China) · Vertiv Group Corp. (U.S.) · Eaton (U.S.) · COMEX (part of Ametek) (Egypt) · DELTA ELECTRONICS (Taiwan) · EL Fateh Est. (Egypt) · EPS Electric (Egypt) · FOX ELECTRONICS POWER (Egypt) · IPS Power (Egypt) · Mitsubishi Electric Corporation (Japan) · LEGRAND (France) · PHOENIX CONTACT (Germany) · Riello UPS (Italy) · SALICRU S.A. (Spain) · Sentafe (Egypt) · SOCOMEC GROUP (France) · Tescom Elektronik A.Ş. (Turkey) |
|
Market Opportunities |
· Infrastructure development within the New Administrative Capital and smart city projects · Increasing adoption of solar-integrated hybrid power backup systems in commercial facilities · Transition from VRLA batteries to lithium-ion based high-efficiency UPS configurations |
|
Value Added Data Infosets |
In addition to the insights on market scenarios such as market value, growth rate, segmentation, geographical coverage, and major players, the market reports curated by the Data Bridge Market Research also include in-depth expert analysis, geographically represented company-wise production and capacity, network layouts of distributors and partners, detailed and updated price trend analysis and deficit analysis of supply chain and demand. |
Uninterruptible Power Supply (UPS) Market Trends
“Infrastructure Development Through North America Smart City and Digital Urban Projects.”
- Large-scale urban development initiatives and smart city projects across North America markets are significantly accelerating the demand for modern infrastructure across residential, commercial, and governmental sectors. These developments are being designed with integrated digital ecosystems, advanced energy management systems, and high-capacity electrical networks, all of which require reliable and scalable power backup solutions. As a result, the deployment of Uninterruptible Power Supply (UPS) systems and supporting energy storage infrastructure is becoming a critical component in ensuring continuous and stable operations across emerging urban environments.
- The rapid pace of smart infrastructure development—including intelligent transportation systems, digital governance platforms, connected healthcare, and high-tech commercial zones—has increased the need for uninterrupted power continuity. Facilities such as data centers, government buildings, financial districts, hospitals, and innovation hubs rely on stable power to maintain operational efficiency, protect sensitive digital systems, and ensure public safety. This evolving environment is creating substantial opportunities for UPS providers to support mission-critical infrastructure with high-reliability power solutions.
- Furthermore, North America smart city projects are increasingly aligned with smart grid integration, renewable energy adoption, and energy efficiency optimization. Power backup systems are no longer deployed solely as contingency solutions but are being integrated as strategic enablers of digital services, intelligent building management systems, and real-time data operations. This transformation is creating a strong growth pathway for UPS systems as foundational infrastructure within next-generation urban ecosystems.
- In January 2024, NEOM announced ongoing development of advanced urban infrastructure powered by digital technologies and renewable energy systems, as part of its official project updates, highlighting the need for resilient and high-capacity power backup solutions to support smart city operations.
- In February 2025, European Commission reported expansion of smart city and digital infrastructure projects under its climate and digital transition programs, emphasizing the integration of smart grids, energy-efficient buildings, and connected urban systems requiring stable power infrastructure.
- The rapid expansion of smart city initiatives and digital urban infrastructure across North America markets is creating significant opportunities for the UPS market. As cities become increasingly connected and technology-driven, the demand for reliable and uninterrupted power is rising to support critical services, data systems, and intelligent operations. This transformation is expected to drive sustained adoption of advanced UPS solutions, positioning them as essential components in enabling resilient, efficient, and future-ready urban ecosystems worldwide
Uninterruptible Power Supply (UPS) Market Dynamics
Driver
“Acceleration of North America Digital Transformation and Data Localization Infrastructure Development”
- The rapid acceleration of digital transformation initiatives across North America economies has significantly reshaped infrastructure priorities within both public and private sector organizations. Governments, financial institutions, telecom operators, and enterprises are increasingly digitizing operations to enhance efficiency, scalability, and service delivery. As critical processes migrate to cloud-based and online environments, continuous system availability has become a non-negotiable requirement. Power interruptions are no longer viewed as isolated technical failures but as direct threats to business continuity, data integrity, customer trust, and regulatory compliance.
- In parallel, there is a growing North America emphasis on data localization and sovereign cloud infrastructure, driven by cybersecurity concerns, regulatory frameworks, and latency optimization requirements. Countries across North America, Europe, Asia-Pacific, and the Middle East are prioritizing domestic data hosting to maintain control over sensitive information and ensure compliance with evolving data protection laws. This has led to a surge in the development of hyperscale data centers, edge computing facilities, and localized cloud infrastructure. As a result, power reliability is being embedded into infrastructure planning from the initial design phase, with stable and conditioned power supply becoming a foundational requirement for safeguarding digital assets and ensuring uninterrupted operations.
- Within this evolving digital ecosystem, uninterruptible power supply (UPS) systems are increasingly integrated into large-scale infrastructure investments. Higher uptime standards—often exceeding 99.999%—are being mandated across data centers, banking networks, government platforms, and telecom infrastructure. As digital ecosystems expand into smart cities, AI-driven platforms, and interconnected service environments, UPS solutions are being recognized as critical enablers of operational resilience, fault tolerance, and long-term digital sustainability.
- In December 2025, Amazon Web Services announced continued expansion of its North America hyperscale data center infrastructure across regions including Asia Pacific, Europe, and North America, with 7-billion-dollar investments aimed at strengthening cloud capacity and ensuring high-availability digital services, thereby reinforcing the need for advanced UPS systems to support uninterrupted operations.
- In March 2024, Microsoft reported ongoing expansion of its Azure data center footprint North America, integrating large-scale energy storage and power backup systems to support mission-critical workloads, highlighting the growing importance of resilient UPS infrastructure in cloud computing environments.
- The North America acceleration of digital transformation and data localization is fundamentally strengthening the foundation of IT and cloud infrastructure worldwide. As hyperscale data centers, edge computing nodes, and sovereign cloud platforms continue to expand, power reliability is becoming a strategic priority rather than an operational afterthought. This structural shift is expected to drive sustained demand for high-performance, scalable, and energy-efficient UPS systems, positioning them as essential components in supporting mission-critical digital environments and enabling resilient North America digital economies.
Restraint/Challenge
“Cost Preference for Diesel Generator Solutions for Extended Backup Duration Requirements”
- Across the North America power backup landscape, diesel generator systems continue to be widely preferred for applications requiring extended runtime during prolonged power outages. In industrial facilities, data centers, commercial buildings, construction sites, and critical infrastructure worldwide, diesel generators are commonly deployed due to their ability to sustain operations for several hours or days, provided adequate fuel supply is available. In regions experiencing grid instability or peak load management challenges, long-duration backup capability is often prioritized over short-term power conditioning.
- Cost considerations play a significant role in this preference. While Uninterruptible Power Supply (UPS) systems are designed to deliver instantaneous power continuity and voltage stabilization, they are typically configured for short-duration backup unless supported by large-scale battery systems, which substantially increase capital investment. In contrast, diesel generators are generally perceived as more cost-effective for high-load and long-duration applications. Their scalability, lower upfront cost per kilovolt-ampere (kVA), and operational familiarity make them a practical choice for ensuring continuity rather than precision power quality.
- As a result, across many commercial and industrial environments North America, UPS systems are often deployed only for critical loads such as IT systems, control units, and medical devices, while diesel generators serve as the primary extended backup solution. This structural preference continues to limit broader adoption of large-capacity UPS systems, particularly in cost-sensitive projects where budget optimization and long-duration backup requirements take precedence.
- In 2024, Uptime Institute highlighted that most data centers North America continue to rely on diesel generators as the primary source of backup power for extended outages, with UPS systems primarily used for short-duration ride-through and power conditioning.
- In 2024, International Energy Agency reported that diesel generators remain widely used across commercial and industrial sectors worldwide to ensure energy security and operational continuity during grid disruptions, particularly in regions with unreliable electricity supply.
- The North America preference for diesel generator systems for extended backup duration underscores a structural limitation in UPS adoption for long-runtime applications. While UPS systems provide instantaneous power continuity and voltage stabilization, their higher cost for extended backup makes diesel generators a more practical solution in many commercial and industrial settings. This continued reliance on fuel-based systems remains a key restraint for large-capacity UPS market expansion, particularly in cost-sensitive and high-load environments.
Uninterruptible Power Supply (UPS) Market Scope
North America uninterruptible power supply (UPS) market is categorized into thirteen notable segments which are based on offering, power rating, organization, form factor, application, price range, phase, installation, energy storage, topology, design, vertical, sales channel.
- By Offering
On the basis of offering, North America uninterruptible power supply (UPS) market is segmented into Hardware, Software, Service. In 2026, hardware is expected to dominate the market with a 74.06% share, driven by substantial investments in data centers, telecommunications infrastructure, healthcare facilities, industrial manufacturing, and commercial real estate. Increasing grid instability and voltage fluctuations in several regions are further accelerating demand for reliable power backup systems. Additionally, the expansion of hyperscale and edge data centers, along with infrastructure modernization initiatives, is fueling large-scale procurement of UPS hardware components such as batteries, inverters, rectifiers, and power modules, reinforcing the segment’s leading position.
The Software segment is expected to be the fastest-growing in the North America uninterruptible power supply (UPS) market, with a CAGR of 7.43% driven by rising need for intelligent power management, remote monitoring, predictive maintenance, and energy optimization solutions. As organizations increasingly deploy advanced UPS systems, the integration of software platforms for real-time analytics, performance tracking, and system diagnostics is becoming critical. This trend is particularly prominent in data centers and enterprise environments, where operational efficiency, uptime optimization, and proactive maintenance are key priorities..
- By power rating
On the basis of power rating, the North America uninterruptible power supply (UPS) market is segmented into Less than 3 kVA, 3–10 kVA, 10–20 kVA, 20–50 kVA, 50–100 kVA, 100–200 kVA, 200–500 kVA, 500–1000 kVA, and Above 1000 kVA. In 2026, the Less Than 3 kVA segment is expected to dominate the market with a 11.64% share, driven by strong demand from residential users, small offices/home offices (SOHO), retail outlets, and small commercial establishments. The increasing use of personal computers, routers, surveillance systems, and point-of-sale (POS) terminals is fueling consistent demand for low-capacity, cost-effective backup solutions. Additionally, frequent short-duration outages and voltage fluctuations across many regions are encouraging households and SMEs to invest in compact UPS systems for basic power protection.
The 200–500 kVA segment is projected to be the fastest-growing in the North America uninterruptible power supply (UPS) market, with a CAGR of 7.24% driven by rising demand from medium to large enterprises, data centers, telecom infrastructure, and industrial facilities that require high-capacity and reliable power backup solutions. As organizations expand operations and modernize infrastructure, the need for UPS systems capable of supporting critical loads and ensuring operational continuity is increasing, thereby accelerating adoption in this power range.
- By organization
On the basis of organization, the North America uninterruptible power supply (UPS) market is segmented into Small Enterprise Size, Medium Enterprise Size, and Large Enterprise Size. In 2026, the Large Enterprise Size segment is expected to dominate the market with a 63.78% share, driven by substantial investments in mission-critical infrastructure, including data centers, telecommunications networks, BFSI institutions, oil & gas operations, large-scale manufacturing facilities, and healthcare systems. Large enterprises require high-capacity, redundant, and scalable UPS systems to ensure uninterrupted operations, protect sensitive equipment, and meet stringent uptime, compliance, and data security requirements. Their higher capital expenditure capabilities and focus on operational continuity further strengthen demand for advanced UPS solutions.
The Small Enterprise Size segment is projected to be the fastest-growing in the uninterruptible power supply (UPS) market, with a CAGR of 7.08%, driven by increasing adoption of IT infrastructure, digital tools, and business automation across small businesses and emerging enterprises. Rising investments in office networks, retail systems, and essential business equipment—along with the need for protection against power outages and voltage fluctuations—are accelerating demand for cost-effective, compact, and scalable UPS solutions within this segment. Additionally, growing awareness of business continuity and data protection is further supporting UPS adoption among small enterprises North America.
- By form factor
On the basis of form factor, the North America uninterruptible power supply (UPS) market is segmented into Standalone UPS, Embedded UPS, and Containerized UPS Systems. In 2026, the Standalone UPS segment is expected to dominate the market with a 73.68% share, driven by its broad applicability across residential, commercial, and industrial sectors, along with advantages such as ease of installation, cost-effectiveness, and operational flexibility. Standalone systems are widely preferred by SMEs, offices, retail outlets, healthcare facilities, and telecom sites due to their ability to support varying load requirements and their suitability for both new installations and retrofit applications. Additionally, the growing demand for decentralized and plug-and-play power backup solutions further reinforces the segment’s leading position North America.
The Containerized UPS Systems segment is projected to be the fastest-growing in the uninterruptible power supply (UPS) market, with a CAGR of 7.16%, driven by increasing adoption in large-scale data centers, industrial complexes, and mission-critical infrastructure projects that require high-capacity, scalable, and rapidly deployable power backup solutions. Containerized systems offer benefits such as modular expansion, reduced installation time, mobility, and simplified infrastructure integration, making them ideal for dynamic and large-scale deployments. As organizations prioritize flexibility and speed in infrastructure development, the adoption of containerized UPS solutions is accelerating across North America markets.
- By application
On the basis of application, the North America uninterruptible power supply (UPS) market is segmented into Backup Power, Emergency Power, Voltage Regulation, Power Conditioning, and Critical Power Protection. In 2026, the Backup Power segment is expected to dominate the market with a 44.26% share, driven by the increasing occurrence of power outages, voltage fluctuations, and grid instability across residential, commercial, and industrial sectors. The growing reliance on digital infrastructure, data centers, telecommunications networks, healthcare systems, and financial institutions has significantly increased the need for uninterrupted operations. Additionally, the expansion of SMEs and rising awareness regarding equipment protection and business continuity are further supporting the widespread adoption of UPS systems primarily for backup power applications.
The Critical Power Protection segment is projected to be the fastest-growing in the uninterruptible power supply (UPS) market, with a CAGR of 7.21%, driven by rising demand from data centers, healthcare facilities, BFSI institutions, and industrial operations where even minimal downtime is unacceptable. These environments require highly reliable, resilient, and continuously available power systems to support mission-critical workloads and sensitive equipment. Increasing emphasis on uptime guarantees, regulatory compliance, and risk mitigation, along with the adoption of advanced UPS technologies, is accelerating the deployment of solutions specifically designed for critical power protection across North America markets.
- By Phase
On the basis of phase, the North America uninterruptible power supply (UPS) market is segmented into Three Phase and Single Phase. In 2026, the Three Phase segment is expected to dominate the market with a 62.95% share, driven by strong demand from data centers, industrial manufacturing facilities, oil & gas operations, large commercial complexes, and healthcare institutions that require high-capacity and stable power backup solutions. Three-phase UPS systems are well-suited for handling heavy electrical loads, supporting critical infrastructure, and enabling scalable operations, while also offering higher efficiency and improved load balancing compared to single-phase systems. Ongoing infrastructure development and the expansion of enterprise-scale operations across North America markets further reinforce the segment’s leadership.
The Three Phase segment is projected to be the fastest-growing in the uninterruptible power supply (UPS) market, with a CAGR of 7.01%, driven by increasing deployment of high-capacity UPS systems in hyperscale data centers, industrial environments, and large infrastructure projects. As organizations continue to scale operations and prioritize reliability, the need for efficient, resilient, and scalable power backup solutions is accelerating the adoption of three-phase UPS systems worldwide.
- By installation type
On the basis of installation type, the North America uninterruptible power supply (UPS) market is segmented into Rack-Mounted, Tower-Based, Floor Standing, Cabinet UPS, and Wall Mounted. In 2026, the Rack-Mounted segment is expected to dominate the market with a 30.11% share, driven by the rapid expansion of data centers, server rooms, telecom infrastructure, and enterprise IT environments. Rack-mounted UPS systems offer space efficiency, scalability, and seamless integration with standardized server racks, making them highly suitable for structured IT setups. Additionally, increasing digital transformation, rising cloud adoption, and the growth of colocation and edge data centers are further accelerating demand for rack-based UPS deployments North America.
The Cabinet UPS segment is projected to be the fastest-growing in the uninterruptible power supply (UPS) market, with a CAGR of 7.32%, driven by rising adoption in large-scale data centers, industrial facilities, and enterprise campuses that require high-capacity, centralized power backup solutions. Cabinet-based UPS systems support heavy electrical loads and offer advantages such as modular scalability, ease of maintenance, and enhanced reliability, making them ideal for mission-critical infrastructure. Increasing demand for robust and future-ready power backup systems is accelerating the deployment of cabinet UPS installations across North America markets.
- By Price Range
On the basis of price range, the North America uninterruptible power supply (UPS) market is segmented into Low, Mid, and High. In 2026, the Mid segment is expected to dominate the market with a 60.30% share, driven by its balanced cost-to-performance ratio, making it the preferred choice across small and medium enterprises (SMEs), commercial establishments, healthcare facilities, and mid-sized industrial units. Mid-range UPS systems typically offer enhanced features such as improved battery life, basic remote monitoring, voltage regulation, and higher energy efficiency—without the significant capital expenditure associated with premium systems. Increasing demand for reliable yet cost-efficient power backup solutions across both developed and emerging markets continues to support strong adoption of this segment.
The High segment is projected to be the fastest-growing in the uninterruptible power supply (UPS) market, with a CAGR of 7.15%, driven by rising demand from large enterprises, hyperscale data centers, industrial complexes, and other mission-critical environments that require high-performance and highly reliable UPS systems. These premium solutions offer advanced capabilities such as extended runtime, superior energy efficiency, real-time monitoring, predictive maintenance, and robust redundancy configurations. As digital infrastructure expands and downtime costs increase, organizations are increasingly investing in high-end UPS systems to ensure operational continuity and meet stringent service-level requirements.
- By energy storage
On the basis of energy storage, the North America uninterruptible power supply (UPS) market is segmented into VRLA, Lithium-Ion, Flywheel-Based UPS, and Supercapacitor-Based Systems. In 2026, the VRLA segment is expected to dominate the market with a 60.86% share, driven by its cost-effectiveness, established supply chain, and proven operational reliability across a wide range of applications. VRLA batteries are extensively used in small to mid-sized UPS systems across residential, commercial, and industrial environments due to their lower upfront cost and ease of replacement. Continued adoption across SMEs, telecom infrastructure, retail outlets, and institutional facilities further supports sustained demand, particularly in cost-sensitive markets.
The Lithium-Ion segment is projected to be the fastest-growing in the uninterruptible power supply (UPS) market, with a CAGR of 7.09%, driven by the increasing need for high-efficiency, compact, and long-life energy storage solutions, especially in data centers, large enterprises, and industrial applications. Compared to VRLA batteries, lithium-ion technology offers higher energy density, faster charging capability, longer lifecycle, lower maintenance requirements, and reduced total cost of ownership (TCO) over time. These advantages are accelerating its adoption in modern, high-performance UPS deployments North America.
- By topology
On the basis of topology, the North America uninterruptible power supply (UPS) market is segmented into Line Interactive, Standby/Offline, and Online / Double Conversion. In 2026, the Line Interactive segment is expected to dominate the market with a 26.76% share, driven by its optimal balance between cost and performance, offering both voltage regulation and battery backup capabilities. Line interactive UPS systems are widely adopted across small and medium enterprises (SMEs), commercial establishments, and residential applications, where protection against voltage fluctuations, brownouts, and short-duration outages is essential. Compared to standby systems, they provide enhanced power conditioning, while remaining more cost-effective than online/double conversion UPS, making them a preferred mid-range solution North America.
The Line Interactive segment is projected to be the fastest-growing in the uninterruptible power supply (UPS) market, with a CAGR of 7.31%, driven by increasing demand for cost-efficient, compact, and energy-efficient UPS solutions across SMEs, home offices, retail outlets, and distributed IT environments. As businesses seek reliable yet affordable power protection without investing in high-end online systems, line interactive UPS solutions are gaining traction. Additionally, rising awareness regarding power quality issues and the need for basic infrastructure resilience is further accelerating adoption across both developed and emerging markets.
- By design
On the basis of design type, the North America uninterruptible power supply (UPS) market is segmented into Modular UPS and Conventional (Monolithic) UPS. In 2026, the Conventional (Monolithic) UPS segment is expected to dominate the market with a 82.82% share, driven by its widespread adoption across commercial buildings, industrial facilities, healthcare institutions, and mid-sized data centers. Conventional UPS systems are favored for their proven reliability, lower upfront capital cost, and suitability for stable, fixed-load applications. Additionally, the large installed base of monolithic systems North America continues to generate steady demand for replacement, refurbishment, and capacity upgrades, reinforcing the segment’s market leadership.
The Modular UPS segment is projected to be the fastest-growing in the uninterruptible power supply (UPS) market, with a CAGR of 7.09%, driven by the rising need for scalable, flexible, and high-availability power solutions, particularly in hyperscale data centers, large enterprises, and industrial environments. Modular architectures allow incremental capacity expansion, hot-swappable components, and reduced mean time to repair (MTTR), minimizing operational downtime. Furthermore, improved energy efficiency, space optimization, and ease of maintenance are accelerating the adoption of modular UPS systems across modern, dynamic infrastructure environments worldwide.
- By vertical
On the basis of vertical, the North America uninterruptible power supply (UPS) market is segmented into Government & Public Sector, IT & Telecom, Hospitality & Tourism, Construction & Real Estate, Healthcare, Energy & Utilities, Media and Entertainment, Manufacturing, Gaming, Data Center, Residential, Retail, BFSI, Education, Oil & Gas, E-Commerce, and Others. In 2026, the Data Center segment is expected to dominate the market with a 25.93% share, driven by substantial North America investments in digital infrastructure, including hyperscale data centers, colocation facilities, and cloud computing ecosystems. The rapid increase in internet penetration, data consumption, fintech expansion, and e-commerce activity, along with regulatory requirements for data localization, is accelerating data center construction across regions. These facilities require highly reliable, scalable, and redundant UPS systems to ensure zero downtime, maintain uptime standards, and meet stringent service-level agreements (SLAs). Additionally, the growing focus on energy efficiency and sustainability in data center operations is further strengthening demand for advanced UPS solutions.
The IT & Telecom segment is projected to be the fastest-growing in the uninterruptible power supply (UPS) market, with a CAGR of 7.88%, driven by the continuous expansion of telecom infrastructure, including 4G/5G network deployments, fiber connectivity, and edge computing nodes, alongside rising enterprise IT investments. Increasing data traffic, digital transformation initiatives, and the need to support critical networking and communication systems are significantly boosting UPS adoption. Reliable backup power is essential in this sector to ensure uninterrupted connectivity, prevent data loss, and maintain network stability, thereby accelerating the deployment of UPS systems across North America IT and telecom environments.
- By sales channel
On the basis of sales channel, the North America uninterruptible power supply (UPS) market is segmented into Direct and Indirect. In 2026, the Indirect segment is expected to dominate the market with a 60.98% share, driven by the extensive distribution networks established by resellers, distributors, and system integrators, enabling UPS manufacturers to penetrate a broader customer base across commercial, industrial, and residential sectors. Indirect channels also offer significant value-added services, including installation, system integration, maintenance, and after-sales support, which are particularly attractive to end-users seeking turnkey power solutions. Furthermore, strategic partnerships between North America UPS manufacturers and regional distributors enhance product accessibility, improve service reach, and strengthen market penetration across both developed and emerging economies.
The Direct segment is projected to be the fastest-growing in the uninterruptible power supply (UPS) market, with a CAGR of 7.16%, driven by increasing preference among large enterprises, hyperscale data centers, and industrial facilities for direct procurement from OEMs. Direct engagement enables organizations to obtain customized UPS configurations, negotiate bulk purchasing agreements, and establish robust service-level agreements (SLAs). Additionally, direct sales channels facilitate better technical collaboration, faster deployment, and more efficient lifecycle management—including installation, upgrades, and predictive maintenance—making them increasingly relevant in mission-critical applications across North America markets.
North America Uninterruptible Power Supply (UPS) Market Regional Analysis
- The U.S. is expected to dominate the North America Uninterruptible Power Supply (UPS) market, capturing an estimated 79.52% share by 2026. This leadership is supported by strong investments in data center infrastructure, expanding telecommunications networks, and advanced manufacturing capabilities across the country. Rising electricity demand, along with concerns related to grid reliability and power quality, is further accelerating the adoption of UPS systems. Additionally, government-backed digital initiatives and the rapid growth of cloud computing ecosystems are reinforcing demand for reliable power backup solutions across critical infrastructure.
- Canada is projected to be the fastest-growing region in the North America Uninterruptible Power Supply (UPS) market, registering a CAGR of 7.15%. Growth is driven by increasing investments in hyperscale and edge data centers, 5G deployment, industrial automation, and smart infrastructure development. Furthermore, supportive government policies, infrastructure modernization efforts, and growing awareness of energy efficiency and power reliability are contributing to the increased adoption of UPS systems across the region.
Mexico Uninterruptible power supply (UPS) Market Insight
The Mexico Uninterruptible Power Supply (UPS) market holds a strong position in the North America industry, supported by growing industrialization, expansion of manufacturing hubs, and increasing investments in commercial infrastructure. The country’s role as a key manufacturing and export base—particularly in automotive, electronics, and industrial equipment—has significantly increased the demand for reliable power backup solutions. Additionally, the rapid growth of data centers, rising adoption of digital services, and ongoing expansion of telecommunications networks are further driving UPS deployment. Government initiatives focused on infrastructure development, coupled with increasing concerns over power reliability and grid stability, continue to strengthen market growth across Mexico.
Uninterruptible Power Supply (UPS) Market Share
The uninterruptible power supply (UPS) market industry is primarily led by well-established companies, including:
- ABB LTD (Switzerland)
- Schneider Electric (France)
- HUAWEI TECHNOLOGIES (China)
- Vertiv Group Corp. (U.S.)
- Eaton (U.S.)
- COMEX (part of Ametek) (Egypt)
- DELTA ELECTRONICS (Taiwan)
- EL Fateh Est. (Egypt)
- EPS Electric (Egypt)
- FOX ELECTRONICS POWER (Egypt)
- IPS Power (Egypt)
- Mitsubishi Electric Corporation (Japan)
- LEGRAND (France)
- PHOENIX CONTACT (Germany)
- Riello UPS (Italy)
- SALICRU S.A. (Spain)
- Sentafe (Egypt)
- SOCOMEC GROUP (France)
- Tescom Elektronik A.Ş. (Turkey)
Latest Developments in North America Uninterruptible Power Supply (UPS) Market
- In May 2025, ABB has expanded its PowerValue UPS product range for enterprise data centers, offering modular, efficient, and reliable power backup solutions. The new UPS systems are designed to enhance critical IT infrastructure, improve safety, and reduce energy consumption. This UPS expansion strengthens ABB’s position in the North America data center market and drives growth in critical power solutions.
- In November 2025, Schneider Electric and Digital Realty have entered a $373 million Supply Capacity Agreement to secure guaranteed capacity for Uninterruptible Power Supplies (UPS), low‑voltage switchgear, and prefabricated skids to meet rising demand for digital infrastructure. The pact aims to accelerate power deployment and supply‑chain resilience amid surging capacity needs driven by AI and cloud growth, this is expected to strengthen company portfolio.
- In September 2025, Huawei Digital Power showcased its strategy to accelerate high quality, innovative data center construction for the AI era at Huawei Connect 2025, emphasizing integration of digital and power technologies to build reliable, agile, and sustainable AI ready infrastructure. The company highlighted modular design, prefabricated solutions, and advanced power supply and thermal management innovations to meet the explosive growth in AI computing demands. This innovative approach strengthens Huawei’s role in the North America data center ecosystem and enhances its credibility in delivering comprehensive, energy efficient infrastructure.
- In October 2025, Vertiv has launched a new Vertiv PowerIT rack power distribution unit (PDU) designed for AI and high-performance computing data centers, offering advanced power management, flexible configurations and high capacity three phase distribution. The solution supports up to 25 kW rack densities and robust environmental conditions, helping operators balance loads and enhance reliability in modern data center environments. This launch strengthens Vertiv’s position in the AI/HPC infrastructure market by expanding its critical power portfolio and meeting growing demand for high density power distribution solutions
SKU-

- Interactive Data Analysis Dashboard
- Company Analysis Dashboard for high growth potential opportunities
- Research Analyst Access for customization & queries
- Competitor Analysis with Interactive dashboard
- Latest News, Updates & Trend analysis
- Harness the Power of Benchmark Analysis for Comprehensive Competitor Tracking
Table of Content
1 INTRODUCTION
1.1 OBJECTIVES OF THE STUDY
1.2 MARKET DEFINITION
1.3 OVERVIEW OF NORTH AMERICA UNINTERRUPTIBLE POWER SUPPLY (UPS) MARKET
1.4 LIMITATIONS
1.5 MARKETS COVERED
2 MARKET SEGMENTATION
2.1 MARKETS COVERED
2.2 GEOGRAPHICAL SCOPE
2.3 YEARS CONSIDERED FOR THE STUDY
2.4 CURRENCY AND PRICING
2.5 DBMR TRIPOD DATA VALIDATION MODEL
2.6 MULTIVARIATE MODELLING
2.7 PRIMARY INTERVIEWS WITH KEY OPINION LEADERS
2.8 DBMR MARKET POSITION GRID
2.9 MARKET APPLICATION COVERAGE GRID
2.1 SECONDARY SOURCES
2.11 ASSUMPTIONS
3 EXECUTIVE SUMMARY
4 PREMIUM INSIGHTS
4.1 PORTER’S FIVE FORCES
4.1.1 THREAT OF NEW ENTRANTS – LOW TO MODERATE
4.1.2 BARGAINING POWER OF SUPPLIERS – MODERATE
4.1.3 BARGAINING POWER OF BUYERS – HIGH
4.1.4 THREAT OF SUBSTITUTES –MODERATE
4.1.5 COMPETITIVE RIVALRY – HIGH
4.2 PRICING ANALYSIS
4.3 COMPANY COMPETITIVE ANALYSIS
4.4 COMPANY EVALUATION QUADRANT
4.5 NEW BUSINESS AND EMERGING BUSINESS’S REVENUE OPPORTUNITIES & FUTURE OUTLOOK
4.5.1 INTRODUCTION
4.5.2 NEW BUSINESS REVENUE OPPORTUNITIES
4.5.2.1 DATA CENTER AND HYPERSCALE INFRASTRUCTURE
4.5.2.2 LITHIUM-ION AND ADVANCED BATTERY SOLUTIONS
4.5.2.3 MODULAR AND SCALABLE UPS SYSTEMS
4.5.2.4 SOFTWARE, MONITORING, AND SERVICE-BASED REVENUE
4.5.2.5 ENERGY STORAGE AND GRID INTEGRATION
4.5.3 EMERGING BUSINESS SEGMENTS
4.5.3.1 EDGE DATA CENTERS AND DISTRIBUTED INFRASTRUCTURE
4.5.3.2 INDUSTRIAL DIGITALIZATION AND AUTOMATION
4.5.3.3 SUSTAINABLE AND GREEN UPS SOLUTIONS
4.5.4 FUTURE OUTLOOK
4.5.5 CONCLUSION
4.6 PATENT ANALYSIS
4.6.1 PATENT QUALITY AND STRENGTH
4.6.2 PATENT FAMILIES
4.6.3 LICENSING AND COLLABORATIONS
4.6.4 IP STRATEGY AND MANAGEMENT
4.6.5 OTHER (EMERGING TRENDS AND INSIGHTS)
4.6.6 CONCLUSION
4.7 PENETRATION AND GROWTH PROSPECT MAPPING
4.7.1 INTRODUCTION
4.7.2 MARKET PENETRATION LANDSCAPE
4.7.3 GROWTH PROSPECT BY REGION
4.7.4 GROWTH PROSPECT BY APPLICATION
4.7.5 PENETRATION VS GROWTH MATRIX ANALYSIS
4.7.6 KEY GROWTH DRIVERS INFLUENCING PENETRATION
4.7.7 STRATEGIC IMPLICATIONS
4.7.8 CONCLUSION
4.8 VALUE CHAIN ANALYSIS
4.8.1 RAW MATERIALS AND COMPONENT SOURCING
4.8.1.1 BATTERY MATERIALS
4.8.1.2 POWER ELECTRONICS AND SEMICONDUCTORS
4.8.1.3 STRUCTURAL AND PASSIVE COMPONENTS
4.8.2 RESEARCH AND DEVELOPMENT AND PRODUCT ENGINEERING
4.8.2.1 POWER ELECTRONICS ARCHITECTURE
4.8.2.2 BATTERY MANAGEMENT SYSTEMS
4.8.2.3 SOFTWARE, IOT, AND CLOUD CONNECTIVITY
4.8.3 MANUFACTURING AND ASSEMBLY
4.8.3.1 5PRODUCTION PROCESSES
4.8.3.2 MANUFACTURING HUBS AND STRATEGIES
4.8.3.3 INDUSTRY 4.0 INTEGRATION
4.8.4 QUALITY ASSURANCE, TESTING, AND CERTIFICATION
4.8.4.1 TESTING PROTOCOLS
4.8.4.2 CERTIFICATIONS
4.8.5 DISTRIBUTION AND LOGISTICS
4.8.5.1 CHANNEL ARCHITECTURE
4.8.5.2 LOGISTICS CONSIDERATIONS
4.8.6 INSTALLATION, COMMISSIONING, AND SYSTEM INTEGRATION
4.8.6.1 INSTALLATION SCOPE
4.8.6.2 SYSTEM INTEGRATION TRENDS
4.8.7 END USERS
4.8.7.1 DATA CENTERS AND CLOUD INFRASTRUCTURE
4.8.7.2 TELECOMMUNICATIONS
4.8.7.3 HEALTHCARE, BFSI, INDUSTRIAL, AND OTHER SEGMENTS
4.8.8 AFTER-SALES SERVICES AND MANAGED SERVICES
4.8.8.1 PREVENTIVE MAINTENANCE AND BATTERY SERVICES
4.8.8.2 REMOTE MONITORING AND AI-DRIVEN DIAGNOSTICS
4.8.8.3 UPS-AS-A-SERVICE
4.9 IMPACT OF WAR, SUPPLY CHAIN DISRUPTIONS, GEOGRAPHIC FOOTPRINT & STRUCTURAL SHIFTS AND ADAPTIVE STRATEGIES
4.9.1 SUPPLY CHAIN RESILIENCE
4.9.1.1 STRATEGIC DECISIONS
4.9.1.1.1 DIVERSIFICATION OF KEY COMPONENT SUPPLIERS
4.9.1.1.2 MULTIPLE SOURCING STRATEGIES FOR POWER ELECTRONICS
4.9.1.1.3 LOGISTICS OPTIMIZATION TO COUNTER RAW MATERIAL SHORTAGES
4.9.1.1.4 INVENTORY BUFFERING FOR CRITICAL BATTERIES
4.9.1.1.5 PARTNERSHIP WITH NORTH AMERICA LOGISTICS PROVIDERS
4.9.1.1.6 ALTERNATIVE PROCUREMENT DURING TRADE DISRUPTIONS
4.9.2 ENERGY & LABORATORY OPERATIONAL COST RISK
4.9.2.1 STRATEGIC DECISIONS
4.9.2.1.1 ADOPTING ENERGY-EFFICIENT MANUFACTURING FACILITIES
4.9.2.1.2 NEGOTIATING LONG-TERM SUPPLY CONTRACTS
4.9.2.1.3 SWITCHING TO RENEWABLE ENERGY SOURCES
4.9.2.1.4 OPTIMIZING BATTERY TECHNOLOGIES
4.9.2.1.5 MIGRATING TO SMART FACTORIES
4.9.2.1.6 UTILIZING DEMAND FORECASTING SOFTWARE
4.9.3 GEOGRAPHIC FOOTPRINT REASSESSMENT
4.9.3.1 STRATEGIC DECISIONS
4.9.3.1.1 EXPANSION INTO EMERGING ECONOMIES
4.9.3.1.2 DIVERSIFICATION OF MANUFACTURING BASE
4.9.3.1.3 SHIFTING PRODUCTION TO REGIONS WITH FAVORABLE POLICIES
4.9.3.1.4 DEVELOPING LOCALIZED DISTRIBUTION HUBS
4.9.3.1.5 INVESTMENT IN REGIONAL WAREHOUSING INFRASTRUCTURE
4.9.4 SCENARIO PLANNING & RISK MANAGEMENT
4.9.4.1 STRATEGIC DECISIONS
4.9.4.1.1 CONTINGENCY PLANNING FOR POWER GRID INSTABILITY
4.9.4.1.2 REGIONAL RISK ASSESSMENTS
4.9.4.1.3 SUPPLIER DIVERSIFICATION
4.9.4.1.4 FLEXIBLE MANUFACTURING SYSTEMS
4.9.4.1.5 INSURANCE STRATEGIES FOR LOGISTICAL DELAYS
4.9.5 CASH & FINANCIAL PROTECTION
4.9.5.1 STRATEGIC DECISIONS
4.9.5.1.1 SECURING TRADE FINANCE ARRANGEMENTS
4.9.5.1.2 OPTIMIZING PAYMENT TERMS
4.9.5.1.3 ENHANCING WORKING CAPITAL MANAGEMENT
4.9.5.1.4 INVESTMENT IN DIGITAL INVOICING
4.9.5.1.5 EXPLORING JOINT VENTURES
4.9.6 CYBERSECURITY & DATA PROTECTION
4.9.6.1 STRATEGIC DECISIONS
4.9.6.1.1 IMPLEMENTING SECURE REMOTE MONITORING PLATFORMS
4.9.6.1.2 ADOPTING INDUSTRIAL CYBERSECURITY SOLUTIONS
4.9.6.1.3 REGULAR SECURITY AUDITS
4.9.6.1.4 ENHANCING ENCRYPTION
4.9.6.1.5 TRAINING WORKFORCE
4.9.7 NEW BUSINESS AND EMERGING BUSINESS REVENUE OPPORTUNITIES & FUTURE OUTLOOK
4.9.8 CONCLUSION
4.1 TECHNOLOGY MATRIX
5 TARIFF & ITS ANALYSIS
5.1 OVERVIEW OF RELEVANT TARIFFS
5.2 TRADE POLICIES INFLUENCING THE MARKET
5.3 COST IMPACT ON STAKEHOLDERS
5.4 SUPPLY CHAIN DISRUPTIONS
5.5 STRATEGIC RESPONSE BY OEMS
5.6 CONCLUSION
6 REGULATION STANDARDS
6.1 INTRODUCTION
6.2 INTERNATIONAL STANDARDS FRAMEWORK (IEC SYSTEM)
6.3 ENERGY EFFICIENCY AND ENVIRONMENTAL REGULATIONS
6.4 EMERGING TRENDS IN REGULATORY COMPLIANCE
6.5 ENVIRONMENTAL COMPLIANCE
6.6 CONCLUSION
7 MARKET OVERVIEW
7.1 DRIVERS
7.1.1 ACCELERATION OF NORTH AMERICA DIGITAL TRANSFORMATION AND DATA LOCALIZATION INFRASTRUCTURE DEVELOPMENT
7.1.2 GROWTH IN TELECOM NETWORK DENSIFICATION AND FIBER BROADBAND PENETRATION INITIATIVES
7.1.3 STRENGTHENING OF HEALTHCARE INFRASTRUCTURE AND DEPLOYMENT OF POWER-SENSITIVE MEDICAL EQUIPMENT
7.2 RESTRAINTS
7.2.1 HEAVY RELIANCE ON NORTH AMERICA SUPPLY CHAINS FOR UPS SYSTEMS AND BATTERY COMPONENTS AMID CURRENCY AND COST VOLATILITY
7.2.2 COST PREFERENCE FOR DIESEL GENERATOR SOLUTIONS FOR EXTENDED BACKUP DURATION REQUIREMENTS
7.3 OPPORTUNITIES
7.3.1 INFRASTRUCTURE DEVELOPMENT THROUGH NORTH AMERICA SMART CITY AND DIGITAL URBAN PROJECTS
7.3.2 INCREASING ADOPTION OF SOLAR-INTEGRATED HYBRID POWER BACKUP SYSTEMS IN COMMERCIAL FACILITIES
7.3.3 TRANSITION FROM VRLA BATTERIES TO LITHIUM-ION BASED HIGH-EFFICIENCY UPS CONFIGURATIONS
7.4 CHALLENGES
7.4.1 ELEVATED AMBIENT TEMPERATURES REDUCING BATTERY EFFICIENCY AND LIFECYCLE PERFORMANCE
7.4.2 LIMITED AVAILABILITY OF SPECIALIZED TECHNICAL SERVICE AND PREVENTIVE MAINTENANCE CAPABILITIES OUTSIDE MAJOR URBAN CENTERS
8 NORTH AMERICA UNINTERRUPTIBLE POWER SUPPLY (UPS) MARKET, BY OFFERING
8.1 OVERVIEW
8.2 NORTH AMERICA UNINTERRUPTIBLE POWER SUPPLY (UPS) MARKET, BY OFFERING, 2018-2033 (USD MILLION)
8.2.1 HARDWARE
8.2.2 SERVICES
8.2.3 SOFTWARE
8.3 NORTH AMERICA HARDWARE IN UNINTERRUPTIBLE POWER SUPPLY (UPS) MARKET, BY TYPE, 2018-2033 (USD MILLION)
8.3.1 BATTERY
8.3.2 INVERTER
8.3.3 RECTIFIER
8.3.4 TRANSFORMERS
8.3.5 POWER DISTRIBUTION UNITS (PDUS)
8.3.6 BYPASS MODULES
8.3.7 ACCESSORIES
8.3.8 STATIC SWITCHES
8.3.9 OTHERS
8.4 NORTH AMERICA BATTERY IN UNINTERRUPTIBLE POWER SUPPLY (UPS) MARKET, BY TYPE, 2018-2033 (USD MILLION)
8.4.1 LEAD ACID BATTERIES (WT3)
8.4.2 LITHIUM ION BATTERIES
8.4.3 NICKEL CADMIUM BATTERIES
8.5 NORTH AMERICA BATTERY IN UNINTERRUPTIBLE POWER SUPPLY (UPS) MARKET, BY CONFIGURATION, 2018-2033 (USD MILLION)
8.5.1 INTERNAL BATTERY
8.5.2 EXTERNAL BATTERY PACK (EBP)
8.5.3 REPLACEMENT BATTERY CARTRIDGE (RBC)
8.5.4 REPLACEMENT BATTERY PACK
8.6 NORTH AMERICA ACCESSORIES IN UNINTERRUPTIBLE POWER SUPPLY (UPS) MARKET, BY TYPE, 2018-2033 (USD MILLION)
8.6.1 INTELLIGENT NETWORK MANAGEMENT CARD
8.6.2 ENVIRONMENTAL SENSORS
8.6.3 MOUNTING KITS
8.6.4 SECURITY DEVICES
8.6.5 RELAY CARD
8.6.6 OTHERS
8.7 NORTH AMERICA HARDWARE IN UNINTERRUPTIBLE POWER SUPPLY (UPS) MARKET, BY REGION, 2018-2033, USD MILLION
8.7.1 ASIA-PACIFIC
8.7.2 NORTH AMERICA
8.7.3 EUROPE
8.7.4 MIDDLE EAST & AFRICA
8.7.5 SOUTH AMERICA
8.8 NORTH AMERICA SERVICES IN UNINTERRUPTIBLE POWER SUPPLY (UPS) MARKET, BY TYPE, 2018-2033 (USD MILLION)
8.8.1 SUPPORT & MAINTENANCE
8.8.2 BATTERY REPLACEMENT & LIFECYCLE SERVICES
8.8.3 MANAGED SERVICES
8.8.4 INTEGRATION & IMPLEMENTATION
8.8.5 TRAINING, EDUCATION & CONSULTING
8.9 NORTH AMERICA SERVICES IN UNINTERRUPTIBLE POWER SUPPLY (UPS) MARKET, BY REGION, 2018-2033, USD MILLION
8.9.1 ASIA-PACIFIC
8.9.2 NORTH AMERICA
8.9.3 EUROPE
8.9.4 MIDDLE EAST & AFRICA
8.9.5 SOUTH AMERICA
8.1 NORTH AMERICA SOFTWARE IN UNINTERRUPTIBLE POWER SUPPLY (UPS) MARKET, BY TYPE, 2018-2033 (USD MILLION)
8.10.1 UPS MONITORING SOFTWARE
8.10.2 PREDICTIVE ANALYTICS
8.10.3 REMOTE MANAGEMENT PLATFORMS
8.10.4 ENERGY MANAGEMENT SOFTWARE
8.10.5 CLOUD-BASED UPS MANAGEMENT PLATFORMS
8.10.6 OTHERS
8.11 NORTH AMERICA SOFTWARE IN UNINTERRUPTIBLE POWER SUPPLY (UPS) MARKET, BY REGION, 2018-2033, USD MILLION
8.11.1 ASIA-PACIFIC
8.11.2 NORTH AMERICA
8.11.3 EUROPE
8.11.4 MIDDLE EAST & AFRICA
8.11.5 SOUTH AMERICA
9 NORTH AMERICA UNINTERRUPTIBLE POWER SUPPLY (UPS) MARKET, BY POWER RATING
9.1 OVERVIEW
9.2 NORTH AMERICA UNINTERRUPTIBLE POWER SUPPLY (UPS) MARKET, BY POWER RATING, 2018-2033 (USD MILLION)
9.2.1 LESS THAN 3 KVA
9.2.2 3–10 KVA
9.2.3 10 KVA–20 KVA
9.2.4 20 KVA–50 KVA
9.2.5 50–100 KVA
9.2.6 100–200 KVA
9.2.7 200–500 KVA
9.2.8 500–1000 KVA
9.2.9 ABOVE 1000 KVA
9.3 NORTH AMERICA UNINTERRUPTIBLE POWER SUPPLY (UPS) MARKET, BY POWER RATING, 2018-2033 (UNITS)
9.3.1 LESS THAN 3 KVA
9.3.2 3–10 KVA
9.3.3 10 KVA–20 KVA
9.3.4 20 KVA–50 KVA
9.3.5 50–100 KVA
9.3.6 100–200 KVA
9.3.7 200–500 KVA
9.3.8 500–1000 KVA
9.3.9 ABOVE 1000 KVA
9.4 NORTH AMERICA LESS THAN 3 KVA IN UNINTERRUPTIBLE POWER SUPPLY (UPS) MARKET, BY REGION, 2018-2033, USD MILLION
9.4.1 ASIA-PACIFIC
9.4.2 NORTH AMERICA
9.4.3 EUROPE
9.4.4 MIDDLE EAST & AFRICA
9.4.5 SOUTH AMERICA
9.5 NORTH AMERICA LESS THAN 3 KVA IN UNINTERRUPTIBLE POWER SUPPLY (UPS) MARKET, BY REGION, 2018-2033, UNITS
9.5.1 ASIA-PACIFIC
9.5.2 NORTH AMERICA
9.5.3 EUROPE
9.5.4 MIDDLE EAST & AFRICA
9.5.5 SOUTH AMERICA
9.6 NORTH AMERICA 3–10 KVA IN UNINTERRUPTIBLE POWER SUPPLY (UPS) MARKET, BY REGION, 2018-2033, USD MILLION
9.6.1 ASIA-PACIFIC
9.6.2 NORTH AMERICA
9.6.3 EUROPE
9.6.4 MIDDLE EAST & AFRICA
9.6.5 SOUTH AMERICA
9.7 NORTH AMERICA 3–10 KVA IN UNINTERRUPTIBLE POWER SUPPLY (UPS) MARKET, BY REGION, 2018-2033, UNITS
9.7.1 ASIA-PACIFIC
9.7.2 NORTH AMERICA
9.7.3 EUROPE
9.7.4 MIDDLE EAST & AFRICA
9.7.5 SOUTH AMERICA
9.8 NORTH AMERICA 10 KVA–20 KVA IN UNINTERRUPTIBLE POWER SUPPLY (UPS) MARKET, BY REGION, 2018-2033, USD MILLION
9.8.1 ASIA-PACIFIC
9.8.2 NORTH AMERICA
9.8.3 EUROPE
9.8.4 MIDDLE EAST & AFRICA
9.8.5 SOUTH AMERICA
9.9 NORTH AMERICA 10 KVA–20 KVA IN UNINTERRUPTIBLE POWER SUPPLY (UPS) MARKET, BY REGION, 2018-2033, UNITS
9.9.1 ASIA-PACIFIC
9.9.2 NORTH AMERICA
9.9.3 EUROPE
9.9.4 MIDDLE EAST & AFRICA
9.9.5 SOUTH AMERICA
9.1 NORTH AMERICA 20 KVA–50 KVA IN UNINTERRUPTIBLE POWER SUPPLY (UPS) MARKET, BY REGION, 2018-2033, USD MILLION
9.10.1 ASIA-PACIFIC
9.10.2 NORTH AMERICA
9.10.3 EUROPE
9.10.4 MIDDLE EAST & AFRICA
9.10.5 SOUTH AMERICA
9.11 NORTH AMERICA 20 KVA–50 KVA IN UNINTERRUPTIBLE POWER SUPPLY (UPS) MARKET, BY REGION, 2018-2033, UNITS
9.11.1 ASIA-PACIFIC
9.11.2 NORTH AMERICA
9.11.3 EUROPE
9.11.4 MIDDLE EAST & AFRICA
9.11.5 SOUTH AMERICA
9.12 NORTH AMERICA 50–100 KVA IN UNINTERRUPTIBLE POWER SUPPLY (UPS) MARKET, BY REGION, 2018-2033, USD MILLION
9.12.1 ASIA-PACIFIC
9.12.2 NORTH AMERICA
9.12.3 EUROPE
9.12.4 MIDDLE EAST & AFRICA
9.12.5 SOUTH AMERICA
9.13 NORTH AMERICA 50–100 KVA IN UNINTERRUPTIBLE POWER SUPPLY (UPS) MARKET, BY REGION, 2018-2033, UNITS
9.13.1 ASIA-PACIFIC
9.13.2 NORTH AMERICA
9.13.3 EUROPE
9.13.4 MIDDLE EAST & AFRICA
9.13.5 SOUTH AMERICA
9.14 NORTH AMERICA 100–200 KVA IN UNINTERRUPTIBLE POWER SUPPLY (UPS) MARKET, BY REGION, 2018-2033, USD MILLION
9.14.1 ASIA-PACIFIC
9.14.2 NORTH AMERICA
9.14.3 EUROPE
9.14.4 MIDDLE EAST & AFRICA
9.14.5 SOUTH AMERICA
9.15 NORTH AMERICA 100–200 KVA IN UNINTERRUPTIBLE POWER SUPPLY (UPS) MARKET, BY REGION, 2018-2033, UNITS
9.15.1 ASIA-PACIFIC
9.15.2 NORTH AMERICA
9.15.3 EUROPE
9.15.4 MIDDLE EAST & AFRICA
9.15.5 SOUTH AMERICA
9.16 NORTH AMERICA 200–500 KVA IN UNINTERRUPTIBLE POWER SUPPLY (UPS) MARKET, BY REGION, 2018-2033, USD MILLION
9.16.1 ASIA-PACIFIC
9.16.2 NORTH AMERICA
9.16.3 EUROPE
9.16.4 MIDDLE EAST & AFRICA
9.16.5 SOUTH AMERICA
9.17 NORTH AMERICA 200–500 KVA IN UNINTERRUPTIBLE POWER SUPPLY (UPS) MARKET, BY REGION, 2018-2033, UNITS
9.17.1 ASIA-PACIFIC
9.17.2 NORTH AMERICA
9.17.3 EUROPE
9.17.4 MIDDLE EAST & AFRICA
9.17.5 SOUTH AMERICA
9.18 NORTH AMERICA 500–1000 KVA IN UNINTERRUPTIBLE POWER SUPPLY (UPS) MARKET, BY REGION, 2018-2033, USD MILLION
9.18.1 ASIA-PACIFIC
9.18.2 NORTH AMERICA
9.18.3 EUROPE
9.18.4 MIDDLE EAST & AFRICA
9.18.5 SOUTH AMERICA
9.19 NORTH AMERICA 500–1000 KVA IN UNINTERRUPTIBLE POWER SUPPLY (UPS) MARKET, BY REGION, 2018-2033, UNITS
9.19.1 ASIA-PACIFIC
9.19.2 NORTH AMERICA
9.19.3 EUROPE
9.19.4 MIDDLE EAST & AFRICA
9.19.5 SOUTH AMERICA
9.2 NORTH AMERICA ABOVE 1000 KVA IN UNINTERRUPTIBLE POWER SUPPLY (UPS) MARKET, BY REGION, 2018-2033, USD MILLION
9.20.1 ASIA-PACIFIC
9.20.2 NORTH AMERICA
9.20.3 EUROPE
9.20.4 MIDDLE EAST & AFRICA
9.20.5 SOUTH AMERICA
9.21 NORTH AMERICA ABOVE 1000 KVA IN UNINTERRUPTIBLE POWER SUPPLY (UPS) MARKET, BY REGION, 2018-2033, UNITS
9.21.1 ASIA-PACIFIC
9.21.2 NORTH AMERICA
9.21.3 EUROPE
9.21.4 MIDDLE EAST & AFRICA
9.21.5 SOUTH AMERICA
10 NORTH AMERICA UNINTERRUPTIBLE POWER SUPPLY (UPS) MARKET, BY ORGANIZATION SIZE
10.1 OVERVIEW
10.2 NORTH AMERICA UNINTERRUPTIBLE POWER SUPPLY (UPS) MARKET, BY ORGANAIZATION SIZE, 2018-2033 (USD MILLION)
10.2.1 LARGE ENTERPRISE SIZE
10.2.2 MEDIUM ENTERPRISE SIZE
10.2.3 SMALL ENTERPRISE SIZE
10.2.4 OTHERS
10.3 NORTH AMERICA LARGE ENTERPRISE SIZE IN UNINTERRUPTIBLE POWER SUPPLY (UPS) MARKET, BY REGION, 2018-2033, USD MILLION
10.3.1 ASIA-PACIFIC
10.3.2 NORTH AMERICA
10.3.3 EUROPE
10.3.4 MIDDLE EAST & AFRICA
10.3.5 SOUTH AMERICA
10.4 NORTH AMERICA MEDIUM ENTERPRISE SIZE IN UNINTERRUPTIBLE POWER SUPPLY (UPS) MARKET, BY REGION, 2018-2033, USD MILLION
10.4.1 ASIA-PACIFIC
10.4.2 NORTH AMERICA
10.4.3 EUROPE
10.4.4 MIDDLE EAST & AFRICA
10.4.5 SOUTH AMERICA
10.5 NORTH AMERICA SMALL ENTERPRISE SIZE IN UNINTERRUPTIBLE POWER SUPPLY (UPS) MARKET, BY REGION, 2018-2033, USD MILLION
10.5.1 ASIA-PACIFIC
10.5.2 NORTH AMERICA
10.5.3 EUROPE
10.5.4 MIDDLE EAST & AFRICA
10.5.5 SOUTH AMERICA
10.6 NORTH AMERICA OTHERS IN UNINTERRUPTIBLE POWER SUPPLY (UPS) MARKET, BY REGION, 2018-2033, USD MILLION
10.6.1 ASIA-PACIFIC
10.6.2 NORTH AMERICA
10.6.3 EUROPE
10.6.4 MIDDLE EAST & AFRICA
10.6.5 SOUTH AMERICA
11 NORTH AMERICA UNINTERRUPTIBLE POWER SUPPLY (UPS) MARKET, BY FORM FACTOR
11.1 OVERVIEW
11.2 NORTH AMERICA UNINTERRUPTIBLE POWER SUPPLY (UPS) MARKET, BY FORM FACTOR , 2018-2033 (USD MILLION)
11.2.1 STANDALONE UPS
11.2.2 CONTAINERIZED UPS SYSTEMS
11.2.3 EMBEDDED UPS
11.3 NORTH AMERICA STANDALONE UPS IN UNINTERRUPTIBLE POWER SUPPLY (UPS) MARKET, BY REGION, 2018-2033, USD MILLION
11.3.1 ASIA-PACIFIC
11.3.2 NORTH AMERICA
11.3.3 EUROPE
11.3.4 MIDDLE EAST & AFRICA
11.3.5 SOUTH AMERICA
11.4 NORTH AMERICA CONTAINERIZED UPS SYSTEMS IN UNINTERRUPTIBLE POWER SUPPLY (UPS) MARKET, BY REGION, 2018-2033, USD MILLION
11.4.1 ASIA-PACIFIC
11.4.2 NORTH AMERICA
11.4.3 EUROPE
11.4.4 MIDDLE EAST & AFRICA
11.4.5 SOUTH AMERICA
11.5 NORTH AMERICA EMBEDDED UPS SYSTEMS IN UNINTERRUPTIBLE POWER SUPPLY (UPS) MARKET, BY REGION, 2018-2033, USD MILLION
11.5.1 ASIA-PACIFIC
11.5.2 NORTH AMERICA
11.5.3 EUROPE
11.5.4 MIDDLE EAST & AFRICA
11.5.5 SOUTH AMERICA
12 NORTH AMERICA UNINTERRUPTIBLE POWER SUPPLY (UPS) MARKET, BY APPLICATION
12.1 OVERVIEW
12.2 NORTH AMERICA UNINTERRUPTIBLE POWER SUPPLY (UPS) MARKET, BY APPLICATION, 2018-2033 (USD MILLION)
12.2.1 BACKUP POWER
12.2.2 EMERGENCY POWER
12.2.3 VOLTAGE REGULATION
12.2.4 POWER CONDITIONING
12.2.5 CRITICAL POWER PROTECTION
12.3 NORTH AMERICA BACKUP POWER IN UNINTERRUPTIBLE POWER SUPPLY (UPS) MARKET, BY REGION, 2018-2033, USD MILLION
12.3.1 ASIA-PACIFIC
12.3.2 NORTH AMERICA
12.3.3 EUROPE
12.3.4 MIDDLE EAST & AFRICA
12.3.5 SOUTH AMERICA
12.4 NORTH AMERICA EMERGENCY POWER IN UNINTERRUPTIBLE POWER SUPPLY (UPS) MARKET, BY REGION, 2018-2033, USD MILLION
12.4.1 ASIA-PACIFIC
12.4.2 NORTH AMERICA
12.4.3 EUROPE
12.4.4 MIDDLE EAST & AFRICA
12.4.5 SOUTH AMERICA
12.5 NORTH AMERICA VOLTAGE REGULATION IN UNINTERRUPTIBLE POWER SUPPLY (UPS) MARKET, BY REGION, 2018-2033, USD MILLION
12.5.1 ASIA-PACIFIC
12.5.2 NORTH AMERICA
12.5.3 EUROPE
12.5.4 MIDDLE EAST & AFRICA
12.5.5 SOUTH AMERICA
12.6 NORTH AMERICA POWER CONDITIONING IN UNINTERRUPTIBLE POWER SUPPLY (UPS) MARKET, BY REGION, 2018-2033, USD MILLION
12.6.1 ASIA-PACIFIC
12.6.2 NORTH AMERICA
12.6.3 EUROPE
12.6.4 MIDDLE EAST & AFRICA
12.6.5 SOUTH AMERICA
12.7 NORTH AMERICA CRITICAL POWER PROTECTION IN UNINTERRUPTIBLE POWER SUPPLY (UPS) MARKET, BY REGION, 2018-2033, USD MILLION
12.7.1 ASIA-PACIFIC
12.7.2 NORTH AMERICA
12.7.3 EUROPE
12.7.4 MIDDLE EAST & AFRICA
12.7.5 SOUTH AMERICA
13 NORTH AMERICA UNINTERRUPTIBLE POWER SUPPLY (UPS) MARKET, BY PHASE
13.1 OVERVIEW
13.2 NORTH AMERICA UNINTERRUPTIBLE POWER SUPPLY (UPS) MARKET, BY PHASE, 2018-2033 (USD MILLION)
13.2.1 THREE PHASE
13.2.2 SINGLE PHASE
13.3 NORTH AMERICA THREE PHASE IN UNINTERRUPTIBLE POWER SUPPLY (UPS) MARKET, BY REGION, 2018-2033, USD MILLION
13.3.1 ASIA-PACIFIC
13.3.2 NORTH AMERICA
13.3.3 EUROPE
13.3.4 MIDDLE EAST & AFRICA
13.3.5 SOUTH AMERICA
13.4 NORTH AMERICA SINGLE PHASE IN UNINTERRUPTIBLE POWER SUPPLY (UPS) MARKET, BY REGION, 2018-2033, USD MILLION
13.4.1 ASIA-PACIFIC
13.4.2 NORTH AMERICA
13.4.3 EUROPE
13.4.4 MIDDLE EAST & AFRICA
13.4.5 SOUTH AMERICA
14 NORTH AMERICA UNINTERRUPTIBLE POWER SUPPLY (UPS) MARKET, BY INSTALLATION TYPE
14.1 OVERVIEW
14.2 NORTH AMERICA UNINTERRUPTIBLE POWER SUPPLY (UPS) MARKET, BY INSTALLATION TYPE , 2018-2033 (USD MILLION)
14.2.1 RACK-MOUNTED
14.2.2 TOWER-BASED
14.2.3 FLOOR STANDING
14.2.4 CABINET UPS
14.2.5 WALL MOUNTED
14.3 NORTH AMERICA SINGLE PHASE IN UNINTERRUPTIBLE POWER SUPPLY (UPS) MARKET, BY REGION, 2018-2033, USD MILLION
14.3.1 ASIA-PACIFIC
14.3.2 NORTH AMERICA
14.3.3 EUROPE
14.3.4 MIDDLE EAST & AFRICA
14.3.5 SOUTH AMERICA
14.4 NORTH AMERICA TOWER-BASED IN UNINTERRUPTIBLE POWER SUPPLY (UPS) MARKET, BY REGION, 2018-2033, USD MILLION
14.4.1 ASIA-PACIFIC
14.4.2 NORTH AMERICA
14.4.3 EUROPE
14.4.4 MIDDLE EAST & AFRICA
14.4.5 SOUTH AMERICA
14.5 NORTH AMERICA FLOOR STANDING IN UNINTERRUPTIBLE POWER SUPPLY (UPS) MARKET, BY REGION, 2018-2033, USD MILLION
14.5.1 ASIA-PACIFIC
14.5.2 NORTH AMERICA
14.5.3 EUROPE
14.5.4 MIDDLE EAST & AFRICA
14.5.5 SOUTH AMERICA
14.6 NORTH AMERICA CABINET UPS IN UNINTERRUPTIBLE POWER SUPPLY (UPS) MARKET, BY REGION, 2018-2033, USD MILLION
14.6.1 ASIA-PACIFIC
14.6.2 NORTH AMERICA
14.6.3 EUROPE
14.6.4 MIDDLE EAST & AFRICA
14.6.5 SOUTH AMERICA
14.7 NORTH AMERICA WALL MOUNTED IN UNINTERRUPTIBLE POWER SUPPLY (UPS) MARKET, BY REGION, 2018-2033, USD MILLION
14.7.1 ASIA-PACIFIC
14.7.2 NORTH AMERICA
14.7.3 EUROPE
14.7.4 MIDDLE EAST & AFRICA
14.7.5 SOUTH AMERICA
15 NORTH AMERICA UNINTERRUPTIBLE POWER SUPPLY (UPS) MARKET, BY PRICE RANGE
15.1 OVERVIEW
15.2 NORTH AMERICA UNINTERRUPTIBLE POWER SUPPLY (UPS) MARKET, BY PRICE RANGE , 2018-2033 (USD MILLION)
15.2.1 MID
15.2.2 LOW
15.2.3 HIGH
15.3 NORTH AMERICA MID IN UNINTERRUPTIBLE POWER SUPPLY (UPS) MARKET, BY REGION, 2018-2033, USD MILLION
15.3.1 ASIA-PACIFIC
15.3.2 NORTH AMERICA
15.3.3 EUROPE
15.3.4 MIDDLE EAST & AFRICA
15.3.5 SOUTH AMERICA
15.4 NORTH AMERICA LOW IN UNINTERRUPTIBLE POWER SUPPLY (UPS) MARKET, BY REGION, 2018-2033, USD MILLION
15.4.1 ASIA-PACIFIC
15.4.2 NORTH AMERICA
15.4.3 EUROPE
15.4.4 MIDDLE EAST & AFRICA
15.4.5 SOUTH AMERICA
15.5 NORTH AMERICA HIGH IN UNINTERRUPTIBLE POWER SUPPLY (UPS) MARKET, BY REGION, 2018-2033, USD MILLION
15.5.1 ASIA-PACIFIC
15.5.2 NORTH AMERICA
15.5.3 EUROPE
15.5.4 MIDDLE EAST & AFRICA
15.5.5 SOUTH AMERICA
16 NORTH AMERICA UNINTERRUPTIBLE POWER SUPPLY (UPS) MARKET, BY ENERGY STORAGE
16.1 OVERVIEW
16.2 NORTH AMERICA UNINTERRUPTIBLE POWER SUPPLY (UPS) MARKET, BY ENERGY STORAGE, 2018-2033 (USD MILLION)
16.2.1 VRLA
16.2.2 LITHIUM-ION
16.2.3 FLYWHEEL-BASED UPS
16.2.4 SUPERCAPACITOR-BASED SYSTEMS
16.3 NORTH AMERICA VRLA IN UNINTERRUPTIBLE POWER SUPPLY (UPS) MARKET, BY REGION, 2018-2033, USD MILLION
16.3.1 ASIA-PACIFIC
16.3.2 NORTH AMERICA
16.3.3 EUROPE
16.3.4 MIDDLE EAST & AFRICA
16.3.5 SOUTH AMERICA
16.4 NORTH AMERICA LITHIUM-ION IN UNINTERRUPTIBLE POWER SUPPLY (UPS) MARKET, BY REGION, 2018-2033, USD MILLION
16.4.1 ASIA-PACIFIC
16.4.2 NORTH AMERICA
16.4.3 EUROPE
16.4.4 MIDDLE EAST & AFRICA
16.4.5 SOUTH AMERICA
16.5 NORTH AMERICA FLYWHEEL-BASED UPS IN UNINTERRUPTIBLE POWER SUPPLY (UPS) MARKET, BY REGION, 2018-2033, USD MILLION
16.5.1 ASIA-PACIFIC
16.5.2 NORTH AMERICA
16.5.3 EUROPE
16.5.4 MIDDLE EAST & AFRICA
16.5.5 SOUTH AMERICA
16.6 NORTH AMERICA SUPERCAPACITOR-BASED SYSTEMS IN UNINTERRUPTIBLE POWER SUPPLY (UPS) MARKET, BY REGION, 2018-2033, USD MILLION
16.6.1 ASIA-PACIFIC
16.6.2 NORTH AMERICA
16.6.3 EUROPE
16.6.4 MIDDLE EAST & AFRICA
16.6.5 SOUTH AMERICA
17 NORTH AMERICA UNINTERRUPTIBLE POWER SUPPLY (UPS) MARKET, BY TOPOLOGY
17.1 OVERVIEW
17.2 NORTH AMERICA UNINTERRUPTIBLE POWER SUPPLY (UPS) MARKET, BY TOPOLOGY, 2018-2033 (USD MILLION)
17.2.1 LINE INTERACTIVE
17.2.2 STANDBY/OFFLINE
17.2.3 ONLINE / DOUBLE CONVERSION
17.3 NORTH AMERICA LINE INTERACTIVE IN UNINTERRUPTIBLE POWER SUPPLY (UPS) MARKET, BY REGION, 2018-2033, USD MILLION
17.3.1 ASIA-PACIFIC
17.3.2 NORTH AMERICA
17.3.3 EUROPE
17.3.4 MIDDLE EAST & AFRICA
17.3.5 SOUTH AMERICA
17.4 NORTH AMERICA STANDBY/OFFLINE IN UNINTERRUPTIBLE POWER SUPPLY (UPS) MARKET, BY REGION, 2018-2033, USD MILLION
17.4.1 ASIA-PACIFIC
17.4.2 NORTH AMERICA
17.4.3 EUROPE
17.4.4 MIDDLE EAST & AFRICA
17.4.5 SOUTH AMERICA
17.5 NORTH AMERICA ONLINE / DOUBLE CONVERSION IN UNINTERRUPTIBLE POWER SUPPLY (UPS) MARKET, BY REGION, 2018-2033, USD MILLION
17.5.1 ASIA-PACIFIC
17.5.2 NORTH AMERICA
17.5.3 EUROPE
17.5.4 MIDDLE EAST & AFRICA
17.5.5 SOUTH AMERICA
18 NORTH AMERICA UNINTERRUPTIBLE POWER SUPPLY (UPS) MARKET, BY DESIGN TYPE
18.1 OVERVIEW
18.2 NORTH AMERICA UNINTERRUPTIBLE POWER SUPPLY (UPS) MARKET, BY DESIGN TYPE, 2018-2033 (USD MILLION)
18.2.1 CONVENTIONAL (MONOLITHIC) UPS
18.2.2 MODULAR UPS
18.3 NORTH AMERICA CONVENTIONAL (MONOLITHIC) UPS IN UNINTERRUPTIBLE POWER SUPPLY (UPS) MARKET, BY REGION, 2018-2033, USD MILLION
18.3.1 ASIA-PACIFIC
18.3.2 NORTH AMERICA
18.3.3 EUROPE
18.3.4 MIDDLE EAST & AFRICA
18.3.5 SOUTH AMERICA
18.4 NORTH AMERICA MODULAR UPS IN UNINTERRUPTIBLE POWER SUPPLY (UPS) MARKET, BY REGION, 2018-2033, USD MILLION
18.4.1 ASIA-PACIFIC
18.4.2 NORTH AMERICA
18.4.3 EUROPE
18.4.4 MIDDLE EAST & AFRICA
18.4.5 SOUTH AMERICA
19 NORTH AMERICA UNINTERRUPTIBLE POWER SUPPLY (UPS) MARKET, BY VERTICLE
19.1 OVERVIEW
19.2 NORTH AMERICA UNINTERRUPTIBLE POWER SUPPLY (UPS) MARKET, BY VERTICLE, 2018-2033 (USD MILLION)
19.2.1 DATA CENTER
19.2.2 IT & TELECOM
19.2.3 MANUFACTURING
19.2.4 BFSI
19.2.5 GOVERNMENT & PUBLIC SECTOR
19.2.6 ENERGY & UTILITIES
19.2.7 RESIDENTIAL
19.2.8 HEALTHCARE
19.2.9 RETAIL
19.2.10 CONSTRUCTION & REAL ESTATE
19.2.11 OIL & GAS
19.2.12 HOSPITALITY & TOURISM
19.2.13 TRANSPORTATION
19.2.14 EDUCATION
19.2.15 MEDIA AND ENTERTAINMENT
19.2.16 E-COMMERCE
19.2.17 GAMING
19.2.18 OTHERS
19.3 NORTH AMERICA DATA CENTER IN UNINTERRUPTIBLE POWER SUPPLY (UPS) MARKET, BY TYPE, 2018-2033 (USD MILLION)
19.3.1 COLOCATION DATA CENTERS
19.3.2 ENTERPRISE DATA CENTERS
19.3.3 HYPERSCALE DATA CENTERS
19.3.4 EDGE DATA CENTERS
19.4 NORTH AMERICA DATA CENTER IN UNINTERRUPTIBLE POWER SUPPLY (UPS) MARKET, BY POWER RATING, 2018-2033 (USD MILLION)
19.4.1 LESS THAN 3 KVA
19.4.2 3–10 KVA
19.4.3 10–20 KVA
19.4.4 20–50 KVA
19.4.5 50–100 KVA
19.4.6 100–200 KVA
19.4.7 200–500 KVA
19.4.8 500–1000 KVA
19.4.9 ABOVE 1000 KVA
19.5 NORTH AMERICA DATA CENTER IN UNINTERRUPTIBLE POWER SUPPLY (UPS) MARKET, BY TOPOLOGY, 2018-2033 (USD MILLION)
19.5.1 LINE INTERACTIVE
19.5.2 STANDBY/OFFLINE
19.5.3 ONLINE / DOUBLE CONVERSION
19.6 NORTH AMERICA DATA CENTER IN UNINTERRUPTIBLE POWER SUPPLY (UPS) MARKET, BY REGION, 2018-2033, USD MILLION
19.6.1 ASIA-PACIFIC
19.6.2 NORTH AMERICA
19.6.3 EUROPE
19.6.4 MIDDLE EAST & AFRICA
19.6.5 SOUTH AMERICA
19.7 NORTH AMERICA IT & TELECOM IN UNINTERRUPTIBLE POWER SUPPLY (UPS) MARKET, BY POWER RATING, 2018-2033 (USD MILLION)
19.7.1 LESS THAN 3 KVA
19.7.2 3–10 KVA
19.7.3 10–20 KVA
19.7.4 20–50 KVA
19.7.5 50–100 KVA
19.7.6 100–200 KVA
19.7.7 200–500 KVA
19.7.8 500–1000 KVA
19.7.9 ABOVE 1000 KVA
19.8 NORTH AMERICA IT & TELECOM IN UNINTERRUPTIBLE POWER SUPPLY (UPS) MARKET, BY TOPOLOGY, 2018-2033 (USD MILLION)
19.8.1 LINE INTERACTIVE
19.8.2 STANDBY/OFFLINE
19.8.3 ONLINE / DOUBLE CONVERSION
19.9 NORTH AMERICA IT & TELECOM IN UNINTERRUPTIBLE POWER SUPPLY (UPS) MARKET, BY REGION, 2018-2033, USD MILLION
19.9.1 ASIA-PACIFIC
19.9.2 NORTH AMERICA
19.9.3 EUROPE
19.9.4 MIDDLE EAST & AFRICA
19.9.5 SOUTH AMERICA
19.1 NORTH AMERICA MANUFACTURING IN UNINTERRUPTIBLE POWER SUPPLY (UPS) MARKET, BY POWER RATING, 2018-2033 (USD MILLION)
19.10.1 LESS THAN 3 KVA
19.10.2 3–10 KVA
19.10.3 10–20 KVA
19.10.4 20–50 KVA
19.10.5 50–100 KVA
19.10.6 100–200 KVA
19.10.7 200–500 KVA
19.10.8 500–1000 KVA
19.10.9 ABOVE 1000 KVA
19.11 NORTH AMERICA MANUFACTURING IN UNINTERRUPTIBLE POWER SUPPLY (UPS) MARKET, BY TOPOLOGY, 2018-2033 (USD MILLION)
19.11.1 LINE INTERACTIVE
19.11.2 STANDBY/OFFLINE
19.11.3 ONLINE / DOUBLE CONVERSION
19.12 NORTH AMERICA MANUFACTURING IN UNINTERRUPTIBLE POWER SUPPLY (UPS) MARKET, BY REGION, 2018-2033, USD MILLION
19.12.1 ASIA-PACIFIC
19.12.2 NORTH AMERICA
19.12.3 EUROPE
19.12.4 MIDDLE EAST & AFRICA
19.12.5 SOUTH AMERICA
19.13 NORTH AMERICA BFSI IN UNINTERRUPTIBLE POWER SUPPLY (UPS) MARKET, BY POWER RATING, 2018-2033 (USD MILLION)
19.13.1 LESS THAN 3 KVA
19.13.2 3–10 KVA
19.13.3 10–20 KVA
19.13.4 20–50 KVA
19.13.5 50–100 KVA
19.13.6 100–200 KVA
19.13.7 200–500 KVA
19.13.8 500–1000 KVA
19.13.9 ABOVE 1000 KVA
19.14 NORTH AMERICA BFSI IN UNINTERRUPTIBLE POWER SUPPLY (UPS) MARKET, BY TOPOLOGY, 2018-2033 (USD MILLION)
19.14.1 LINE INTERACTIVE
19.14.2 STANDBY/OFFLINE
19.14.3 ONLINE / DOUBLE CONVERSION
19.15 NORTH AMERICA BFSI IN UNINTERRUPTIBLE POWER SUPPLY (UPS) MARKET, BY REGION, 2018-2033, USD MILLION
19.15.1 ASIA-PACIFIC
19.15.2 NORTH AMERICA
19.15.3 EUROPE
19.15.4 MIDDLE EAST & AFRICA
19.15.5 SOUTH AMERICA
19.16 NORTH AMERICA GOVERNMENT & PUBLIC SECTOR IN UNINTERRUPTIBLE POWER SUPPLY (UPS) MARKET, BY POWER RATING, 2018-2033 (USD MILLION)
19.16.1 LESS THAN 3 KVA
19.16.2 3–10 KVA
19.16.3 10–20 KVA
19.16.4 20–50 KVA
19.16.5 50–100 KVA
19.16.6 100–200 KVA
19.16.7 200–500 KVA
19.16.8 500–1000 KVA
19.16.9 ABOVE 1000 KVA
19.17 NORTH AMERICA GOVERNMENT & PUBLIC SECTOR IN UNINTERRUPTIBLE POWER SUPPLY (UPS) MARKET, BY TOPOLOGY, 2018-2033 (USD MILLION)
19.17.1 LINE INTERACTIVE
19.17.2 STANDBY/OFFLINE
19.17.3 ONLINE / DOUBLE CONVERSION
19.18 NORTH AMERICA GOVERNMENT & PUBLIC SECTOR IN UNINTERRUPTIBLE POWER SUPPLY (UPS) MARKET, BY REGION, 2018-2033, USD MILLION
19.18.1 ASIA-PACIFIC
19.18.2 NORTH AMERICA
19.18.3 EUROPE
19.18.4 MIDDLE EAST & AFRICA
19.18.5 SOUTH AMERICA
19.19 NORTH AMERICA ENERGY & UTILITIES SECTOR IN UNINTERRUPTIBLE POWER SUPPLY (UPS) MARKET, BY POWER RATING, 2018-2033 (USD MILLION)
19.19.1 LESS THAN 3 KVA
19.19.2 3–10 KVA
19.19.3 10–20 KVA
19.19.4 20–50 KVA
19.19.5 50–100 KVA
19.19.6 100–200 KVA
19.19.7 200–500 KVA
19.19.8 500–1000 KVA
19.19.9 ABOVE 1000 KVA
19.2 NORTH AMERICA ENERGY & UTILITIES IN UNINTERRUPTIBLE POWER SUPPLY (UPS) MARKET, BY TOPOLOGY, 2018-2033 (USD MILLION)
19.20.1 LINE INTERACTIVE
19.20.2 STANDBY/OFFLINE
19.20.3 ONLINE / DOUBLE CONVERSION
19.21 NORTH AMERICA ENERGY & UTILITIES IN UNINTERRUPTIBLE POWER SUPPLY (UPS) MARKET, BY REGION, 2018-2033, USD MILLION
19.21.1 ASIA-PACIFIC
19.21.2 NORTH AMERICA
19.21.3 EUROPE
19.21.4 MIDDLE EAST & AFRICA
19.21.5 SOUTH AMERICA
19.22 NORTH AMERICA RESIDENTIAL IN UNINTERRUPTIBLE POWER SUPPLY (UPS) MARKET, BY POWER RATING, 2018-2033 (USD MILLION)
19.22.1 LESS THAN 3 KVA
19.22.2 3–10 KVA
19.22.3 10–20 KVA
19.22.4 20–50 KVA
19.22.5 50–100 KVA
19.22.6 ABOVE 100 KVA
19.23 NORTH AMERICA RESIDENTIAL IN UNINTERRUPTIBLE POWER SUPPLY (UPS) MARKET, BY TOPOLOGY, 2018-2033 (USD MILLION)
19.23.1 LINE INTERACTIVE
19.23.2 STANDBY/OFFLINE
19.23.3 ONLINE / DOUBLE CONVERSION
19.24 NORTH AMERICA RESIDENTIAL IN UNINTERRUPTIBLE POWER SUPPLY (UPS) MARKET, BY REGION, 2018-2033, USD MILLION
19.24.1 ASIA-PACIFIC
19.24.2 NORTH AMERICA
19.24.3 EUROPE
19.24.4 MIDDLE EAST & AFRICA
19.24.5 SOUTH AMERICA
19.25 NORTH AMERICA HEALTHCARE IN UNINTERRUPTIBLE POWER SUPPLY (UPS) MARKET, BY POWER RATING, 2018-2033 (USD MILLION)
19.25.1 LESS THAN 3 KVA
19.25.2 3–10 KVA
19.25.3 10–20 KVA
19.25.4 20–50 KVA
19.25.5 50–100 KVA
19.25.6 100–200 KVA
19.25.7 200–500 KVA
19.25.8 500–1000 KVA
19.25.9 ABOVE 1000 KVA
19.26 NORTH AMERICA HEALTHCARE IN UNINTERRUPTIBLE POWER SUPPLY (UPS) MARKET, BY TOPOLOGY, 2018-2033 (USD MILLION)
19.26.1 LINE INTERACTIVE
19.26.2 STANDBY/OFFLINE
19.26.3 ONLINE / DOUBLE CONVERSION
19.27 NORTH AMERICA HEALTHCARE IN UNINTERRUPTIBLE POWER SUPPLY (UPS) MARKET, BY REGION, 2018-2033, USD MILLION
19.27.1 ASIA-PACIFIC
19.27.2 NORTH AMERICA
19.27.3 EUROPE
19.27.4 MIDDLE EAST & AFRICA
19.27.5 SOUTH AMERICA
19.28 NORTH AMERICA RETAIL IN UNINTERRUPTIBLE POWER SUPPLY (UPS) MARKET, BY POWER RATING, 2018-2033 (USD MILLION)
19.28.1 LESS THAN 3 KVA
19.28.2 3–10 KVA
19.28.3 10–20 KVA
19.28.4 20–50 KVA
19.28.5 50–100 KVA
19.28.6 100–200 KVA
19.28.7 200–500 KVA
19.28.8 500–1000 KVA
19.28.9 ABOVE 1000 KVA
19.29 NORTH AMERICA RETAIL IN UNINTERRUPTIBLE POWER SUPPLY (UPS) MARKET, BY TOPOLOGY, 2018-2033 (USD MILLION)
19.29.1 LINE INTERACTIVE
19.29.2 STANDBY/OFFLINE
19.29.3 ONLINE / DOUBLE CONVERSION
19.3 NORTH AMERICA RETAIL IN UNINTERRUPTIBLE POWER SUPPLY (UPS) MARKET, BY REGION, 2018-2033, USD MILLION
19.30.1 ASIA-PACIFIC
19.30.2 NORTH AMERICA
19.30.3 EUROPE
19.30.4 MIDDLE EAST & AFRICA
19.30.5 SOUTH AMERICA
19.31 NORTH AMERICA CONSTRUCTION & REAL ESTATE IN UNINTERRUPTIBLE POWER SUPPLY (UPS) MARKET, BY POWER RATING, 2018-2033 (USD MILLION)
19.31.1 LESS THAN 3 KVA
19.31.2 3–10 KVA
19.31.3 10–20 KVA
19.31.4 20–50 KVA
19.31.5 50–100 KVA
19.31.6 100–200 KVA
19.31.7 200–500 KVA
19.31.8 500–1000 KVA
19.31.9 ABOVE 1000 KVA
19.32 NORTH AMERICA CONSTRUCTION & REAL ESTATE IN UNINTERRUPTIBLE POWER SUPPLY (UPS) MARKET, BY TOPOLOGY, 2018-2033 (USD MILLION)
19.32.1 LINE INTERACTIVE
19.32.2 STANDBY/OFFLINE
19.32.3 ONLINE / DOUBLE CONVERSION
19.33 NORTH AMERICA CONSTRUCTION & REAL ESTATE IN UNINTERRUPTIBLE POWER SUPPLY (UPS) MARKET, BY REGION, 2018-2033, USD MILLION
19.33.1 ASIA-PACIFIC
19.33.2 NORTH AMERICA
19.33.3 EUROPE
19.33.4 MIDDLE EAST & AFRICA
19.33.5 SOUTH AMERICA
19.34 NORTH AMERICA OIL & GAS IN UNINTERRUPTIBLE POWER SUPPLY (UPS) MARKET, BY POWER RATING, 2018-2033 (USD MILLION)
19.34.1 LESS THAN 3 KVA
19.34.2 3–10 KVA
19.34.3 10–20 KVA
19.34.4 20–50 KVA
19.34.5 50–100 KVA
19.34.6 100–200 KVA
19.34.7 200–500 KVA
19.34.8 500–1000 KVA
19.34.9 ABOVE 1000 KVA
19.35 NORTH AMERICA OIL & GAS IN UNINTERRUPTIBLE POWER SUPPLY (UPS) MARKET, BY TOPOLOGY, 2018-2033 (USD MILLION)
19.35.1 LINE INTERACTIVE
19.35.2 STANDBY/OFFLINE
19.35.3 ONLINE / DOUBLE CONVERSION
19.36 NORTH AMERICA OIL & GAS IN UNINTERRUPTIBLE POWER SUPPLY (UPS) MARKET, BY REGION, 2018-2033, USD MILLION
19.36.1 ASIA-PACIFIC
19.36.2 NORTH AMERICA
19.36.3 EUROPE
19.36.4 MIDDLE EAST & AFRICA
19.36.5 SOUTH AMERICA
19.37 NORTH AMERICA HOSPITALITY & TOURISM IN UNINTERRUPTIBLE POWER SUPPLY (UPS) MARKET, BY POWER RATING, 2018-2033 (USD MILLION)
19.37.1 LESS THAN 3 KVA
19.37.2 3–10 KVA
19.37.3 10–20 KVA
19.37.4 20–50 KVA
19.37.5 50–100 KVA
19.37.6 100–200 KVA
19.37.7 200–500 KVA
19.37.8 500–1000 KVA
19.37.9 ABOVE 1000 KVA
19.38 NORTH AMERICA HOSPITALITY & TOURISM IN UNINTERRUPTIBLE POWER SUPPLY (UPS) MARKET, BY TOPOLOGY, 2018-2033 (USD MILLION)
19.38.1 LINE INTERACTIVE
19.38.2 STANDBY/OFFLINE
19.38.3 ONLINE / DOUBLE CONVERSION
19.39 NORTH AMERICA HOSPITALITY & TOURISM IN UNINTERRUPTIBLE POWER SUPPLY (UPS) MARKET, BY REGION, 2018-2033, USD MILLION
19.39.1 ASIA-PACIFIC
19.39.2 NORTH AMERICA
19.39.3 EUROPE
19.39.4 MIDDLE EAST & AFRICA
19.39.5 SOUTH AMERICA
19.4 NORTH AMERICA TRANSPORTATION IN UNINTERRUPTIBLE POWER SUPPLY (UPS) MARKET, BY POWER RATING, 2018-2033 (USD MILLION)
19.40.1 LESS THAN 3 KVA
19.40.2 3–10 KVA
19.40.3 10–20 KVA
19.40.4 20–50 KVA
19.40.5 50–100 KVA
19.40.6 100–200 KVA
19.40.7 200–500 KVA
19.40.8 500–1000 KVA
19.40.9 ABOVE 1000 KVA
19.41 NORTH AMERICA TRANSPORTATION IN UNINTERRUPTIBLE POWER SUPPLY (UPS) MARKET, BY TOPOLOGY, 2018-2033 (USD MILLION)
19.41.1 LINE INTERACTIVE
19.41.2 STANDBY/OFFLINE
19.41.3 ONLINE / DOUBLE CONVERSION
19.42 NORTH AMERICA TRANSPORTATION IN UNINTERRUPTIBLE POWER SUPPLY (UPS) MARKET, BY REGION, 2018-2033, USD MILLION
19.42.1 ASIA-PACIFIC
19.42.2 NORTH AMERICA
19.42.3 EUROPE
19.42.4 MIDDLE EAST & AFRICA
19.42.5 SOUTH AMERICA
19.43 NORTH AMERICA EDUCATION IN UNINTERRUPTIBLE POWER SUPPLY (UPS) MARKET, BY POWER RATING, 2018-2033 (USD MILLION)
19.43.1 LESS THAN 3 KVA
19.43.2 3–10 KVA
19.43.3 10–20 KVA
19.43.4 20–50 KVA
19.43.5 50–100 KVA
19.43.6 100–200 KVA
19.43.7 200–500 KVA
19.43.8 500–1000 KVA
19.43.9 ABOVE 1000 KVA
19.44 NORTH AMERICA EDUCATION IN UNINTERRUPTIBLE POWER SUPPLY (UPS) MARKET, BY TOPOLOGY, 2018-2033 (USD MILLION)
19.44.1 LINE INTERACTIVE
19.44.2 STANDBY/OFFLINE
19.44.3 ONLINE / DOUBLE CONVERSION
19.45 NORTH AMERICA EDUCATION IN UNINTERRUPTIBLE POWER SUPPLY (UPS) MARKET, BY REGION, 2018-2033, USD MILLION
19.45.1 ASIA-PACIFIC
19.45.2 NORTH AMERICA
19.45.3 EUROPE
19.45.4 MIDDLE EAST & AFRICA
19.45.5 SOUTH AMERICA
19.46 NORTH AMERICA MEDIA AND ENTERTAINMENT IN UNINTERRUPTIBLE POWER SUPPLY (UPS) MARKET, BY POWER RATING, 2018-2033 (USD MILLION)
19.46.1 LESS THAN 3 KVA
19.46.2 3–10 KVA
19.46.3 10–20 KVA
19.46.4 20–50 KVA
19.46.5 50–100 KVA
19.46.6 100–200 KVA
19.46.7 200–500 KVA
19.46.8 500–1000 KVA
19.46.9 ABOVE 1000 KVA
19.47 NORTH AMERICA MEDIA AND ENTERTAINMENT IN UNINTERRUPTIBLE POWER SUPPLY (UPS) MARKET, BY TOPOLOGY, 2018-2033 (USD MILLION)
19.47.1 LINE INTERACTIVE
19.47.2 STANDBY/OFFLINE
19.47.3 ONLINE / DOUBLE CONVERSION
19.48 NORTH AMERICA MEDIA AND ENTERTAINMENT IN UNINTERRUPTIBLE POWER SUPPLY (UPS) MARKET, BY REGION, 2018-2033, USD MILLION
19.48.1 ASIA-PACIFIC
19.48.2 NORTH AMERICA
19.48.3 EUROPE
19.48.4 MIDDLE EAST & AFRICA
19.48.5 SOUTH AMERICA
19.49 NORTH AMERICA E-COMMERCE IN UNINTERRUPTIBLE POWER SUPPLY (UPS) MARKET, BY POWER RATING, 2018-2033 (USD MILLION)
19.49.1 LESS THAN 3 KVA
19.49.2 3–10 KVA
19.49.3 10–20 KVA
19.49.4 20–50 KVA
19.49.5 50–100 KVA
19.49.6 100–200 KVA
19.49.7 200–500 KVA
19.49.8 500–1000 KVA
19.49.9 ABOVE 1000 KVA
19.5 NORTH AMERICA E-COMMERCE IN UNINTERRUPTIBLE POWER SUPPLY (UPS) MARKET, BY TOPOLOGY, 2018-2033 (USD MILLION)
19.50.1 LINE INTERACTIVE
19.50.2 STANDBY/OFFLINE
19.50.3 ONLINE / DOUBLE CONVERSION
19.51 NORTH AMERICA E-COMMERCE IN UNINTERRUPTIBLE POWER SUPPLY (UPS) MARKET, BY REGION, 2018-2033, USD MILLION
19.51.1 ASIA-PACIFIC
19.51.2 NORTH AMERICA
19.51.3 EUROPE
19.51.4 MIDDLE EAST & AFRICA
19.51.5 SOUTH AMERICA
19.52 NORTH AMERICA GAMING IN UNINTERRUPTIBLE POWER SUPPLY (UPS) MARKET, BY POWER RATING, 2018-2033 (USD MILLION)
19.52.1 LESS THAN 3 KVA
19.52.2 3–10 KVA
19.52.3 10–20 KVA
19.52.4 20–50 KVA
19.52.5 50–100 KVA
19.52.6 100–200 KVA
19.52.7 200–500 KVA
19.52.8 500–1000 KVA
19.52.9 ABOVE 1000 KVA
19.53 NORTH AMERICA GAMING IN UNINTERRUPTIBLE POWER SUPPLY (UPS) MARKET, BY TOPOLOGY, 2018-2033 (USD MILLION)
19.53.1 LINE INTERACTIVE
19.53.2 STANDBY/OFFLINE
19.53.3 ONLINE / DOUBLE CONVERSION
19.54 NORTH AMERICA GAMING IN UNINTERRUPTIBLE POWER SUPPLY (UPS) MARKET, BY REGION, 2018-2033, USD MILLION
19.54.1 ASIA-PACIFIC
19.54.2 NORTH AMERICA
19.54.3 EUROPE
19.54.4 MIDDLE EAST & AFRICA
19.54.5 SOUTH AMERICA
19.55 NORTH AMERICA OTHERS IN UNINTERRUPTIBLE POWER SUPPLY (UPS) MARKET, BY POWER RATING, 2018-2033 (USD MILLION)
19.55.1 LESS THAN 3 KVA
19.55.2 3–10 KVA
19.55.3 10–20 KVA
19.55.4 20–50 KVA
19.55.5 50–100 KVA
19.55.6 100–200 KVA
19.55.7 200–500 KVA
19.55.8 500–1000 KVA
19.55.9 ABOVE 1000 KVA
19.56 NORTH AMERICA OTHERS IN UNINTERRUPTIBLE POWER SUPPLY (UPS) MARKET, BY TOPOLOGY, 2018-2033 (USD MILLION)
19.56.1 LINE INTERACTIVE
19.56.2 STANDBY/OFFLINE
19.56.3 ONLINE / DOUBLE CONVERSION
19.57 NORTH AMERICA GAMING IN UNINTERRUPTIBLE POWER SUPPLY (UPS) MARKET, BY REGION, 2018-2033, USD MILLION
19.57.1 ASIA-PACIFIC
19.57.2 NORTH AMERICA
19.57.3 EUROPE
19.57.4 MIDDLE EAST & AFRICA
19.57.5 SOUTH AMERICA
20 NORTH AMERICA UNINTERRUPTIBLE POWER SUPPLY (UPS) MARKET, BY SALES CHANNEL
20.1 OVERVIEW
20.2 NORTH AMERICA UNINTERRUPTIBLE POWER SUPPLY (UPS) MARKET, BY SALES CHANNEL, 2018-2033 (USD MILLION)
20.2.1 INDIRECT
20.2.2 DIRECT
20.3 NORTH AMERICA INDIRECT IN UNINTERRUPTIBLE POWER SUPPLY (UPS) MARKET, BY TYPE, 2018-2033 (USD MILLION)
20.3.1 DISTRIBUTOR/WHOLESALER
20.3.2 SPECIALTY
20.3.3 OTHERS
20.4 NORTH AMERICA INDIRECT IN UNINTERRUPTIBLE POWER SUPPLY (UPS) MARKET, BY REGION, 2018-2033, USD MILLION
20.4.1 ASIA-PACIFIC
20.4.2 NORTH AMERICA
20.4.3 EUROPE
20.4.4 MIDDLE EAST & AFRICA
20.4.5 SOUTH AMERICA
20.5 NORTH AMERICA DIRECT IN UNINTERRUPTIBLE POWER SUPPLY (UPS) MARKET, BY REGION, 2018-2033, USD MILLION
20.5.1 ASIA-PACIFIC
20.5.2 NORTH AMERICA
20.5.3 EUROPE
20.5.4 MIDDLE EAST & AFRICA
20.5.5 SOUTH AMERICA
21 NORTH AMERICA UNINTERRUPTIBLE POWER SUPPLY (UPS) MARKET, BY REGION
21.1 NORTH AMERICA
21.1.1 US
21.1.2 CANADA
21.1.3 MEXICO
22 NORTH AMERICA UNINTERRUPTIBLE POWER SUPPLY (UPS) MARKET
22.1 COMPANY SHARE ANALYSIS: GLOBAL
23 SWOT ANALYSIS
24 COMPANY PROFILES
24.1 SCHNEIDER ELECTRIC
24.1.1 COMPANY SNAPSHOT
24.1.2 REVENUE ANALYSIS
24.1.3 COMPANY SHARE ANALYSIS
24.1.4 PRODUCT PORTFOLIO
24.1.5 RECENT DEVELOPMENT
24.2 VERTIV GROUP CORP.
24.2.1 COMPANY SNAPSHOT
24.2.2 REVENUE ANALYSIS
24.2.3 COMPANY SHARE ANALYSIS
24.2.4 PRODUCT PORTFOLIO
24.2.5 RECENT DEVELOPMENT
24.3 EATON
24.3.1 COMPANY SNAPSHOT
24.3.2 REVENUE ANALYSIS
24.3.3 COMPANY SHARE ANALYSIS
24.3.4 PRODUCT PORTFOLIO
24.3.5 RECENT DEVELOPMENTS
24.4 ABB LTD
24.4.1 COMPANY SNAPSHOT
24.4.2 REVENUE ANALYSIS
24.4.3 COMPANY SHARE ANALYSIS
24.4.4 PRODUCT PORTFOLIO
24.4.5 RECENT DEVELOPMENT
24.5 HUAWEI TECHNOLOGIES
24.5.1 COMPANY SNAPSHOT
24.5.2 COMPANY SHARE ANALYSIS
24.5.3 PRODUCT PORTFOLIO
24.5.4 RECENT DEVELOPMENT
24.6 COMEX (PART OF AMETEX)
24.6.1 COMPANY SNAPSHOT
24.6.2 PRODUCT PORTFOLIO
24.6.3 RECENT DEVELOPMENT
24.7 CYBER POWER SYSTEMS (USA), INC.
24.7.1 COMPANY SNAPSHOT
24.7.2 PRODUCT PORTFOLIO
24.7.3 RECENT DEVELOPMENT
24.8 DELTA ELECTRONICS
24.8.1 COMPANY SNAPSHOT
24.8.2 REVENUE ANALYSIS
24.8.3 PRODUCT PORTFOLIO
24.8.4 RECENT DEVELOPMENT
24.9 FUJI ELECTRIC CO., LTD.
24.9.1 COMPANY SNAPSHOT
24.9.2 REVENUE ANALYSIS
24.9.3 PRODUCT PORTFOLIO
24.9.4 RECENT DEVELOPMENT
24.1 EL FATEH EST.
24.10.1 COMPANY SNAPSHOT
24.10.2 PRODUCT PORTFOLIO
24.10.3 RECENT DEVELOPMENT
24.11 EPS ELECTRIC
24.11.1 COMPANY SNAPSHOT
24.11.2 PRODUCT PORTFOLIO
24.11.3 RECENT DEVELOPMENT
24.12 FOX ELECTRONICS POWER
24.12.1 COMPANY SNAPSHOT
24.12.2 PRODUCT PORTFOLIO
24.12.3 RECENT DEVELOPMENT
24.13 INVT POWER SYSTEM (SHENZHEN) CO., LTD.
24.13.1 COMPANY SNAPSHOT
24.13.2 PRODUCT PORTFOLIO
24.13.3 RECENT DEVELOPMENT
24.14 IPS POWER
24.14.1 COMPANY SNAPSHOT
24.14.2 PRODUCT PORTFOLIO
24.14.3 RECENT DEVELOPMENT
24.15 KSTAR GROUP
24.15.1 COMPANY SNAPSHOT
24.15.2 PRODUCT PORTFOLIO
24.15.3 RECENT DEVELOPMENT
24.16 LEGRAND
24.16.1 COMPANY SNAPSHOT
24.16.2 REVENUE ANALYSIS
24.16.3 PRODUCT PORTFOLIO
24.16.4 RECENT DEVELOPMENT
24.17 MITSUBISHI ELECTRIC CORPORATION
24.17.1 COMPANY SNAPSHOT
24.17.2 REVENUE ANALYSIS
24.17.3 PRODUCT PORTFOLIO
24.17.4 RECENT DEVELOPMENTS
24.18 PHEONIX CONTACT
24.18.1 COMPANY SNAPSHOT
24.18.2 PRODUCT PORTFOLIO
24.18.3 RECENT DEVELOPMENT
24.19 RIELLO UPS
24.19.1 COMPANY SNAPSHOT
24.19.2 PRODUCT PORTFOLIO
24.19.3 RECENT DEVELOPMENT
24.2 SALICRU S.A.
24.20.1 COMPANY SNAPSHOT
24.20.2 PRODUCT PORTFOLIO
24.20.3 RECENT DEVELOPMENT
24.21 SENTAFE.
24.21.1 COMPANY SNAPSHOT
24.21.2 PRODUCT PORTFOLIO
24.21.3 RECENT DEVELOPMENT
24.22 SIEMENS
24.22.1 COMPANY SNAPSHOT
24.22.2 REVENUE ANALYSIS
24.22.3 PRODUCT PORTFOLIO
24.22.4 RECENT DEVELOPMENT
24.23 SOCOMEC GROUP
24.23.1 COMPANY SNAPSHOT
24.23.2 PRODUCT PORTFOLIO
24.23.3 RECENT DEVELOPMENT
24.24 TESCOM ELEKTRONIK A.Ş.
24.24.1 COMPANY SNAPSHOT
24.24.2 PRODUCT PORTFOLIO
24.24.3 RECENT DEVELOPMENT
24.25 TOSHIBA INTERNATIONAL CORPORATION
24.25.1 COMPANY SNAPSHOT
24.25.2 REVENUE ANALYSIS
24.25.3 PRODUCT PORTFOLIO
24.25.4 RECENT DEVELOPMENT
25 QUESTIONNAIRE
26 RELATED REPORTS
List of Table
TABLE 1 COMPANY COMPARATIVE ANALYSIS
TABLE 2 COMPANY SERVICE PLATFORM MATRIX
TABLE 3 REGIONAL OPPORTUNITY MATRIX
TABLE 4 NORTH AMERICA UPS VALUE CHAIN: STAGES, KEY ACTIVITIES, AND KEY PARTICIPANTS
TABLE 5 TECHNOLOGY MATRIX
TABLE 6 NORTH AMERICA UPS REGULATORY FRAMEWORK & APPROVAL TIMELINE
TABLE 7 NORTH AMERICA UNINTERRUPTIBLE POWER SUPPLY (UPS) MARKET, BY OFFERING, 2018-2033 (USD MILLION)
TABLE 8 NORTH AMERICA HARDWARE IN UNINTERRUPTIBLE POWER SUPPLY (UPS) MARKET, BY TYPE, 2018-2033 (USD MILLION)
TABLE 9 NORTH AMERICA BATTERY IN UNINTERRUPTIBLE POWER SUPPLY (UPS) MARKET, BY TYPE, 2018-2033 (USD MILLION)
TABLE 10 NORTH AMERICA BATTERY IN UNINTERRUPTIBLE POWER SUPPLY (UPS) MARKET, BY CONFIGURATION, 2018-2033 (USD MILLION)
TABLE 11 NORTH AMERICA ACCESSORIES IN UNINTERRUPTIBLE POWER SUPPLY (UPS) MARKET, BY TYPE, 2018-2033 (USD MILLION)
TABLE 12 NORTH AMERICA HARDWARE IN UNINTERRUPTIBLE POWER SUPPLY (UPS) MARKET, BY REGION, 2018-2033, USD MILLION
TABLE 13 NORTH AMERICA SERVICES IN UNINTERRUPTIBLE POWER SUPPLY (UPS) MARKET, BY TYPE, 2018-2033 (USD MILLION)
TABLE 14 NORTH AMERICA SERVICES IN UNINTERRUPTIBLE POWER SUPPLY (UPS) MARKET, BY REGION, 2018-2033, USD MILLION
TABLE 15 NORTH AMERICA SOFTWARE IN UNINTERRUPTIBLE POWER SUPPLY (UPS) MARKET, BY TYPE, 2018-2033 (USD MILLION)
TABLE 16 NORTH AMERICA SOFTWARE IN UNINTERRUPTIBLE POWER SUPPLY (UPS) MARKET, BY REGION, 2018-2033, USD MILLION
TABLE 17 NORTH AMERICA UNINTERRUPTIBLE POWER SUPPLY (UPS) MARKET, BY POWER RATING, 2018-2033 (USD MILLION)
TABLE 18 NORTH AMERICA UNINTERRUPTIBLE POWER SUPPLY (UPS) MARKET, BY POWER RATING, 2018-2033 (UNITS)
TABLE 19 NORTH AMERICA LESS THAN 3 KVA IN UNINTERRUPTIBLE POWER SUPPLY (UPS) MARKET, BY REGION, 2018-2033, USD MILLION
TABLE 20 NORTH AMERICA LESS THAN 3 KVA IN UNINTERRUPTIBLE POWER SUPPLY (UPS) MARKET, BY REGION, 2018-2033, UNITS
TABLE 21 NORTH AMERICA 3–10 KVA IN UNINTERRUPTIBLE POWER SUPPLY (UPS) MARKET, BY REGION, 2018-2033, USD MILLION
TABLE 22 NORTH AMERICA 3–10 KVA IN UNINTERRUPTIBLE POWER SUPPLY (UPS) MARKET, BY REGION, 2018-2033, UNITS
TABLE 23 NORTH AMERICA 10 KVA–20 KVA IN UNINTERRUPTIBLE POWER SUPPLY (UPS) MARKET, BY REGION, 2018-2033, USD MILLION
TABLE 24 NORTH AMERICA 10 KVA–20 KVA IN UNINTERRUPTIBLE POWER SUPPLY (UPS) MARKET, BY REGION, 2018-2033, UNITS
TABLE 25 NORTH AMERICA 20 KVA–50 KVA IN UNINTERRUPTIBLE POWER SUPPLY (UPS) MARKET, BY REGION, 2018-2033, USD MILLION
TABLE 26 NORTH AMERICA 20 KVA–50 KVA IN UNINTERRUPTIBLE POWER SUPPLY (UPS) MARKET, BY REGION, 2018-2033, UNITS
TABLE 27 NORTH AMERICA 50–100 KVA IN UNINTERRUPTIBLE POWER SUPPLY (UPS) MARKET, BY REGION, 2018-2033, USD MILLION
TABLE 28 NORTH AMERICA 50–100 KVA IN UNINTERRUPTIBLE POWER SUPPLY (UPS) MARKET, BY REGION, 2018-2033, UNITS
TABLE 29 NORTH AMERICA 100–200 KVA IN UNINTERRUPTIBLE POWER SUPPLY (UPS) MARKET, BY REGION, 2018-2033, USD MILLION
TABLE 30 NORTH AMERICA 100–200 KVA IN UNINTERRUPTIBLE POWER SUPPLY (UPS) MARKET, BY REGION, 2018-2033, UNITS
TABLE 31 NORTH AMERICA 200–500 KVA IN UNINTERRUPTIBLE POWER SUPPLY (UPS) MARKET, BY REGION, 2018-2033, USD MILLION
TABLE 32 NORTH AMERICA 200–500 KVA IN UNINTERRUPTIBLE POWER SUPPLY (UPS) MARKET, BY REGION, 2018-2033, UNITS
TABLE 33 NORTH AMERICA 500–1000 KVA IN UNINTERRUPTIBLE POWER SUPPLY (UPS) MARKET, BY REGION, 2018-2033, USD MILLION
TABLE 34 NORTH AMERICA 500–1000 KVA IN UNINTERRUPTIBLE POWER SUPPLY (UPS) MARKET, BY REGION, 2018-2033, UNITS
TABLE 35 NORTH AMERICA ABOVE 1000 KVA IN UNINTERRUPTIBLE POWER SUPPLY (UPS) MARKET, BY REGION, 2018-2033, USD MILLION
TABLE 36 NORTH AMERICA ABOVE 1000 KVA IN UNINTERRUPTIBLE POWER SUPPLY (UPS) MARKET, BY REGION, 2018-2033, UNITS
TABLE 37 NORTH AMERICA UNINTERRUPTIBLE POWER SUPPLY (UPS) MARKET, BY ORGANAIZATION SIZE , 2018-2033 (USD MILLION)
TABLE 38 NORTH AMERICA LARGE ENTERPRISE SIZE IN UNINTERRUPTIBLE POWER SUPPLY (UPS) MARKET, BY REGION, 2018-2033, USD MILLION
TABLE 39 NORTH AMERICA MEDIUM ENTERPRISE SIZE IN UNINTERRUPTIBLE POWER SUPPLY (UPS) MARKET, BY REGION, 2018-2033, USD MILLION
TABLE 40 NORTH AMERICA SMALL ENTERPRISE SIZE IN UNINTERRUPTIBLE POWER SUPPLY (UPS) MARKET, BY REGION, 2018-2033, USD MILLION
TABLE 41 NORTH AMERICA OTHERS IN UNINTERRUPTIBLE POWER SUPPLY (UPS) MARKET, BY REGION, 2018-2033, USD MILLION
TABLE 42 NORTH AMERICA UNINTERRUPTIBLE POWER SUPPLY (UPS) MARKET, BY FORM FACTOR , 2018-2033 (USD MILLION)
TABLE 43 NORTH AMERICA STANDALONE UPS IN UNINTERRUPTIBLE POWER SUPPLY (UPS) MARKET, BY REGION, 2018-2033, USD MILLION
TABLE 44 NORTH AMERICA CONTAINERIZED UPS SYSTEMS IN UNINTERRUPTIBLE POWER SUPPLY (UPS) MARKET, BY REGION, 2018-2033, USD MILLION
TABLE 45 NORTH AMERICA EMBEDDED UPS SYSTEMS IN UNINTERRUPTIBLE POWER SUPPLY (UPS) MARKET, BY REGION, 2018-2033, USD MILLION
TABLE 46 NORTH AMERICA UNINTERRUPTIBLE POWER SUPPLY (UPS) MARKET, BY APPLICATION, 2018-2033 (USD MILLION)
TABLE 47 NORTH AMERICA BACKUP POWER IN UNINTERRUPTIBLE POWER SUPPLY (UPS) MARKET, BY REGION, 2018-2033, USD MILLION
TABLE 48 NORTH AMERICA EMERGENCY POWER IN UNINTERRUPTIBLE POWER SUPPLY (UPS) MARKET, BY REGION, 2018-2033, USD MILLION
TABLE 49 NORTH AMERICA VOLTAGE REGULATION IN UNINTERRUPTIBLE POWER SUPPLY (UPS) MARKET, BY REGION, 2018-2033, USD MILLION
TABLE 50 NORTH AMERICA POWER CONDITIONING IN UNINTERRUPTIBLE POWER SUPPLY (UPS) MARKET, BY REGION, 2018-2033, USD MILLION
TABLE 51 NORTH AMERICA CRITICAL POWER PROTECTION IN UNINTERRUPTIBLE POWER SUPPLY (UPS) MARKET, BY REGION, 2018-2033, USD MILLION
TABLE 52 NORTH AMERICA UNINTERRUPTIBLE POWER SUPPLY (UPS) MARKET, BY PHASE, 2018-2033 (USD MILLION)
TABLE 53 NORTH AMERICA THREE PHASE IN UNINTERRUPTIBLE POWER SUPPLY (UPS) MARKET, BY REGION, 2018-2033, USD MILLION
TABLE 54 NORTH AMERICA SINGLE PHASE IN UNINTERRUPTIBLE POWER SUPPLY (UPS) MARKET, BY REGION, 2018-2033, USD MILLION
TABLE 55 NORTH AMERICA UNINTERRUPTIBLE POWER SUPPLY (UPS) MARKET, BY INSTALLATION TYPE , 2018-2033 (USD MILLION)
TABLE 56 NORTH AMERICA SINGLE PHASE IN UNINTERRUPTIBLE POWER SUPPLY (UPS) MARKET, BY REGION, 2018-2033, USD MILLION
TABLE 57 NORTH AMERICA TOWER-BASED IN UNINTERRUPTIBLE POWER SUPPLY (UPS) MARKET, BY REGION, 2018-2033, USD MILLION
TABLE 58 NORTH AMERICA FLOOR STANDING IN UNINTERRUPTIBLE POWER SUPPLY (UPS) MARKET, BY REGION, 2018-2033, USD MILLION
TABLE 59 NORTH AMERICA CABINET UPS IN UNINTERRUPTIBLE POWER SUPPLY (UPS) MARKET, BY REGION, 2018-2033, USD MILLION
TABLE 60 NORTH AMERICA WALL MOUNTED IN UNINTERRUPTIBLE POWER SUPPLY (UPS) MARKET, BY REGION, 2018-2033, USD MILLION
TABLE 61 NORTH AMERICA UNINTERRUPTIBLE POWER SUPPLY (UPS) MARKET, BY PRICE RANGE , 2018-2033 (USD MILLION)
TABLE 62 NORTH AMERICA MID IN UNINTERRUPTIBLE POWER SUPPLY (UPS) MARKET, BY REGION, 2018-2033, USD MILLION
TABLE 63 NORTH AMERICA LOW IN UNINTERRUPTIBLE POWER SUPPLY (UPS) MARKET, BY REGION, 2018-2033, USD MILLION
TABLE 64 NORTH AMERICA HIGH IN UNINTERRUPTIBLE POWER SUPPLY (UPS) MARKET, BY REGION, 2018-2033, USD MILLION
TABLE 65 NORTH AMERICA UNINTERRUPTIBLE POWER SUPPLY (UPS) MARKET, BY ENERGY STORAGE, 2018-2033 (USD MILLION)
TABLE 66 NORTH AMERICA VRLA IN UNINTERRUPTIBLE POWER SUPPLY (UPS) MARKET, BY REGION, 2018-2033, USD MILLION
TABLE 67 NORTH AMERICA LITHIUM-ION IN UNINTERRUPTIBLE POWER SUPPLY (UPS) MARKET, BY REGION, 2018-2033, USD MILLION
TABLE 68 NORTH AMERICA FLYWHEEL-BASED UPS IN UNINTERRUPTIBLE POWER SUPPLY (UPS) MARKET, BY REGION, 2018-2033, USD MILLION
TABLE 69 NORTH AMERICA SUPERCAPACITOR-BASED SYSTEMS IN UNINTERRUPTIBLE POWER SUPPLY (UPS) MARKET, BY REGION, 2018-2033, USD MILLION
TABLE 70 NORTH AMERICA UNINTERRUPTIBLE POWER SUPPLY (UPS) MARKET, BY TOPOLOGY, 2018-2033 (USD MILLION)
TABLE 71 NORTH AMERICA LINE INTERACTIVE IN UNINTERRUPTIBLE POWER SUPPLY (UPS) MARKET, BY REGION, 2018-2033, USD MILLION
TABLE 72 NORTH AMERICA STANDBY/OFFLINE IN UNINTERRUPTIBLE POWER SUPPLY (UPS) MARKET, BY REGION, 2018-2033, USD MILLION
TABLE 73 NORTH AMERICA ONLINE / DOUBLE CONVERSION IN UNINTERRUPTIBLE POWER SUPPLY (UPS) MARKET, BY REGION, 2018-2033, USD MILLION
TABLE 74 NORTH AMERICA UNINTERRUPTIBLE POWER SUPPLY (UPS) MARKET, BY DESIGN TYPE, 2018-2033 (USD MILLION)
TABLE 75 NORTH AMERICA CONVENTIONAL (MONOLITHIC) UPS IN UNINTERRUPTIBLE POWER SUPPLY (UPS) MARKET, BY REGION, 2018-2033, USD MILLION
TABLE 76 NORTH AMERICA MODULAR UPS IN UNINTERRUPTIBLE POWER SUPPLY (UPS) MARKET, BY REGION, 2018-2033, USD MILLION
TABLE 77 NORTH AMERICA UNINTERRUPTIBLE POWER SUPPLY (UPS) MARKET, BY VERTICLE, 2018-2033 (USD MILLION)
TABLE 78 NORTH AMERICA DATA CENTER IN UNINTERRUPTIBLE POWER SUPPLY (UPS) MARKET, BY TYPE, 2018-2033 (USD MILLION)
TABLE 79 NORTH AMERICA DATA CENTER IN UNINTERRUPTIBLE POWER SUPPLY (UPS) MARKET, BY POWER RATING, 2018-2033 (USD MILLION)
TABLE 80 NORTH AMERICA DATA CENTER IN UNINTERRUPTIBLE POWER SUPPLY (UPS) MARKET, BY TOPOLOGY, 2018-2033 (USD MILLION)
TABLE 81 NORTH AMERICA DATA CENTER IN UNINTERRUPTIBLE POWER SUPPLY (UPS) MARKET, BY REGION, 2018-2033, USD MILLION
TABLE 82 NORTH AMERICA IT & TELECOM IN UNINTERRUPTIBLE POWER SUPPLY (UPS) MARKET, BY POWER RATING, 2018-2033 (USD MILLION)
TABLE 83 NORTH AMERICA IT & TELECOM IN UNINTERRUPTIBLE POWER SUPPLY (UPS) MARKET, BY TOPOLOGY, 2018-2033 (USD MILLION)
TABLE 84 NORTH AMERICA IT & TELECOM IN UNINTERRUPTIBLE POWER SUPPLY (UPS) MARKET, BY REGION, 2018-2033, USD MILLION
TABLE 85 NORTH AMERICA MANUFACTURING IN UNINTERRUPTIBLE POWER SUPPLY (UPS) MARKET, BY POWER RATING, 2018-2033 (USD MILLION)
TABLE 86 NORTH AMERICA MANUFACTURING IN UNINTERRUPTIBLE POWER SUPPLY (UPS) MARKET, BY TOPOLOGY, 2018-2033 (USD MILLION)
TABLE 87 NORTH AMERICA MANUFACTURING IN UNINTERRUPTIBLE POWER SUPPLY (UPS) MARKET, BY REGION, 2018-2033, USD MILLION
TABLE 88 NORTH AMERICA BFSI IN UNINTERRUPTIBLE POWER SUPPLY (UPS) MARKET, BY POWER RATING, 2018-2033 (USD MILLION)
TABLE 89 NORTH AMERICA BFSI IN UNINTERRUPTIBLE POWER SUPPLY (UPS) MARKET, BY TOPOLOGY, 2018-2033 (USD MILLION)
TABLE 90 NORTH AMERICA BFSI IN UNINTERRUPTIBLE POWER SUPPLY (UPS) MARKET, BY REGION, 2018-2033, USD MILLION
TABLE 91 NORTH AMERICA GOVERNMENT & PUBLIC SECTOR IN UNINTERRUPTIBLE POWER SUPPLY (UPS) MARKET, BY POWER RATING, 2018-2033 (USD MILLION)
TABLE 92 NORTH AMERICA GOVERNMENT & PUBLIC SECTOR IN UNINTERRUPTIBLE POWER SUPPLY (UPS) MARKET, BY TOPOLOGY, 2018-2033 (USD MILLION)
TABLE 93 NORTH AMERICA GOVERNMENT & PUBLIC SECTOR IN UNINTERRUPTIBLE POWER SUPPLY (UPS) MARKET, BY REGION, 2018-2033, USD MILLION
TABLE 94 NORTH AMERICA ENERGY & UTILITIES SECTOR IN UNINTERRUPTIBLE POWER SUPPLY (UPS) MARKET, BY POWER RATING, 2018-2033 (USD MILLION)
TABLE 95 NORTH AMERICA ENERGY & UTILITIES IN UNINTERRUPTIBLE POWER SUPPLY (UPS) MARKET, BY TOPOLOGY, 2018-2033 (USD MILLION)
TABLE 96 NORTH AMERICA ENERGY & UTILITIES IN UNINTERRUPTIBLE POWER SUPPLY (UPS) MARKET, BY REGION, 2018-2033, USD MILLION
TABLE 97 NORTH AMERICA RESIDENTIAL IN UNINTERRUPTIBLE POWER SUPPLY (UPS) MARKET, BY POWER RATING, 2018-2033 (USD MILLION)
TABLE 98 NORTH AMERICA RESIDENTIAL IN UNINTERRUPTIBLE POWER SUPPLY (UPS) MARKET, BY TOPOLOGY, 2018-2033 (USD MILLION)
TABLE 99 NORTH AMERICA RESIDENTIAL IN UNINTERRUPTIBLE POWER SUPPLY (UPS) MARKET, BY REGION, 2018-2033, USD MILLION
TABLE 100 NORTH AMERICA HEALTHCARE IN UNINTERRUPTIBLE POWER SUPPLY (UPS) MARKET, BY POWER RATING, 2018-2033 (USD MILLION)
TABLE 101 NORTH AMERICA HEALTHCARE IN UNINTERRUPTIBLE POWER SUPPLY (UPS) MARKET, BY TOPOLOGY, 2018-2033 (USD MILLION)
TABLE 102 NORTH AMERICA HEALTHCARE IN UNINTERRUPTIBLE POWER SUPPLY (UPS) MARKET, BY REGION, 2018-2033, USD MILLION
TABLE 103 NORTH AMERICA RETAIL IN UNINTERRUPTIBLE POWER SUPPLY (UPS) MARKET, BY POWER RATING, 2018-2033 (USD MILLION)
TABLE 104 NORTH AMERICA RETAIL IN UNINTERRUPTIBLE POWER SUPPLY (UPS) MARKET, BY TOPOLOGY, 2018-2033 (USD MILLION)
TABLE 105 NORTH AMERICA RETAIL IN UNINTERRUPTIBLE POWER SUPPLY (UPS) MARKET, BY REGION, 2018-2033, USD MILLION
TABLE 106 NORTH AMERICA CONSTRUCTION & REAL ESTATE IN UNINTERRUPTIBLE POWER SUPPLY (UPS) MARKET, BY POWER RATING, 2018-2033 (USD MILLION)
TABLE 107 NORTH AMERICA CONSTRUCTION & REAL ESTATE IN UNINTERRUPTIBLE POWER SUPPLY (UPS) MARKET, BY TOPOLOGY, 2018-2033 (USD MILLION)
TABLE 108 NORTH AMERICA CONSTRUCTION & REAL ESTATE IN UNINTERRUPTIBLE POWER SUPPLY (UPS) MARKET, BY REGION, 2018-2033, USD MILLION
TABLE 109 NORTH AMERICA OIL & GAS IN UNINTERRUPTIBLE POWER SUPPLY (UPS) MARKET, BY POWER RATING, 2018-2033 (USD MILLION)
TABLE 110 NORTH AMERICA OIL & GAS IN UNINTERRUPTIBLE POWER SUPPLY (UPS) MARKET, BY TOPOLOGY, 2018-2033 (USD MILLION)
TABLE 111 NORTH AMERICA OIL & GAS IN UNINTERRUPTIBLE POWER SUPPLY (UPS) MARKET, BY REGION, 2018-2033, USD MILLION
TABLE 112 NORTH AMERICA HOSPITALITY & TOURISM IN UNINTERRUPTIBLE POWER SUPPLY (UPS) MARKET, BY POWER RATING, 2018-2033 (USD MILLION)
TABLE 113 NORTH AMERICA HOSPITALITY & TOURISM IN UNINTERRUPTIBLE POWER SUPPLY (UPS) MARKET, BY TOPOLOGY, 2018-2033 (USD MILLION)
TABLE 114 NORTH AMERICA HOSPITALITY & TOURISM IN UNINTERRUPTIBLE POWER SUPPLY (UPS) MARKET, BY REGION, 2018-2033, USD MILLION
TABLE 115 NORTH AMERICA TRANSPORTATION IN UNINTERRUPTIBLE POWER SUPPLY (UPS) MARKET, BY POWER RATING, 2018-2033 (USD MILLION)
TABLE 116 NORTH AMERICA TRANSPORTATION IN UNINTERRUPTIBLE POWER SUPPLY (UPS) MARKET, BY TOPOLOGY, 2018-2033 (USD MILLION)
TABLE 117 NORTH AMERICA TRANSPORTATION IN UNINTERRUPTIBLE POWER SUPPLY (UPS) MARKET, BY REGION, 2018-2033, USD MILLION
TABLE 118 NORTH AMERICA EDUCATION IN UNINTERRUPTIBLE POWER SUPPLY (UPS) MARKET, BY POWER RATING, 2018-2033 (USD MILLION)
TABLE 119 NORTH AMERICA EDUCATION IN UNINTERRUPTIBLE POWER SUPPLY (UPS) MARKET, BY TOPOLOGY, 2018-2033 (USD MILLION)
TABLE 120 NORTH AMERICA EDUCATION IN UNINTERRUPTIBLE POWER SUPPLY (UPS) MARKET, BY REGION, 2018-2033, USD MILLION
TABLE 121 NORTH AMERICA MEDIA AND ENTERTAINMENT IN UNINTERRUPTIBLE POWER SUPPLY (UPS) MARKET, BY POWER RATING, 2018-2033 (USD MILLION)
TABLE 122 NORTH AMERICA MEDIA AND ENTERTAINMENT IN UNINTERRUPTIBLE POWER SUPPLY (UPS) MARKET, BY TOPOLOGY, 2018-2033 (USD MILLION)
TABLE 123 NORTH AMERICA MEDIA AND ENTERTAINMENT IN UNINTERRUPTIBLE POWER SUPPLY (UPS) MARKET, BY REGION, 2018-2033, USD MILLION
TABLE 124 NORTH AMERICA E-COMMERCE IN UNINTERRUPTIBLE POWER SUPPLY (UPS) MARKET, BY POWER RATING, 2018-2033 (USD MILLION)
TABLE 125 NORTH AMERICA E-COMMERCE IN UNINTERRUPTIBLE POWER SUPPLY (UPS) MARKET, BY TOPOLOGY, 2018-2033 (USD MILLION)
TABLE 126 NORTH AMERICA E-COMMERCE IN UNINTERRUPTIBLE POWER SUPPLY (UPS) MARKET, BY REGION, 2018-2033, USD MILLION
TABLE 127 NORTH AMERICA GAMING IN UNINTERRUPTIBLE POWER SUPPLY (UPS) MARKET, BY POWER RATING, 2018-2033 (USD MILLION)
TABLE 128 NORTH AMERICA GAMING IN UNINTERRUPTIBLE POWER SUPPLY (UPS) MARKET, BY TOPOLOGY, 2018-2033 (USD MILLION)
TABLE 129 NORTH AMERICA GAMING IN UNINTERRUPTIBLE POWER SUPPLY (UPS) MARKET, BY REGION, 2018-2033, USD MILLION
TABLE 130 NORTH AMERICA OTHERS IN UNINTERRUPTIBLE POWER SUPPLY (UPS) MARKET, BY POWER RATING, 2018-2033 (USD MILLION)
TABLE 131 NORTH AMERICA OTHERS IN UNINTERRUPTIBLE POWER SUPPLY (UPS) MARKET, BY TOPOLOGY, 2018-2033 (USD MILLION)
TABLE 132 NORTH AMERICA GAMING IN UNINTERRUPTIBLE POWER SUPPLY (UPS) MARKET, BY REGION, 2018-2033, USD MILLION
TABLE 133 NORTH AMERICA UNINTERRUPTIBLE POWER SUPPLY (UPS) MARKET, BY SALES CHANNEL, 2018-2033 (USD MILLION)
TABLE 134 NORTH AMERICA INDIRECT IN UNINTERRUPTIBLE POWER SUPPLY (UPS) MARKET, BY TYPE, 2018-2033 (USD MILLION)
TABLE 135 NORTH AMERICA INDIRECT IN UNINTERRUPTIBLE POWER SUPPLY (UPS) MARKET, BY REGION, 2018-2033, USD MILLION
TABLE 136 NORTH AMERICA DIRECT IN UNINTERRUPTIBLE POWER SUPPLY (UPS) MARKET, BY REGION, 2018-2033, USD MILLION
TABLE 137 NORTH AMERICA UNINTERRUPTIBLE POWER SUPPLY (UPS) MARKET, BY COUNTRY, 2018-2033 (USD MILLION)
TABLE 138 NORTH AMERICA UNINTERRUPTIBLE POWER SUPPLY (UPS) MARKET, BY COUNTRY, 2018-2033 (UNITS)
TABLE 139 NORTH AMERICA UNINTERRUPTIBLE POWER SUPPLY (UPS) MARKET, BY OFFERING, 2018-2033 (USD MILLION)
TABLE 140 NORTH AMERICA HARDWARE IN UNINTERRUPTIBLE POWER SUPPLY (UPS) MARKET, BY TYPE, 2018-2033 (USD MILLION)
TABLE 141 NORTH AMERICA BATTERY IN UNINTERRUPTIBLE POWER SUPPLY (UPS) MARKET, BY TYPE, 2018-2033 (USD MILLION)
TABLE 142 NORTH AMERICA BATTERY IN UNINTERRUPTIBLE POWER SUPPLY (UPS) MARKET, BY CONFIGURATION, 2018-2033 (USD MILLION)
TABLE 143 NORTH AMERICA ACCESSORIES IN UNINTERRUPTIBLE POWER SUPPLY (UPS) MARKET, BY TYPE, 2018-2033 (USD MILLION)
TABLE 144 NORTH AMERICA SERVICES IN UNINTERRUPTIBLE POWER SUPPLY (UPS) MARKET, BY TYPE, 2018-2033 (USD MILLION)
TABLE 145 NORTH AMERICA SOFTWARE IN UNINTERRUPTIBLE POWER SUPPLY (UPS) MARKET, BY TYPE, 2018-2033 (USD MILLION)
TABLE 146 NORTH AMERICA UNINTERRUPTIBLE POWER SUPPLY (UPS) MARKET, BY POWER RATING, 2018-2033 (USD MILLION)
TABLE 147 NORTH AMERICA UNINTERRUPTIBLE POWER SUPPLY (UPS) MARKET, BY POWER RATING, 2018-2033 (UNITS)
TABLE 148 NORTH AMERICA UNINTERRUPTIBLE POWER SUPPLY (UPS) MARKET, BY ORGANAIZATION SIZE , 2018-2033 (USD MILLION)
TABLE 149 NORTH AMERICA UNINTERRUPTIBLE POWER SUPPLY (UPS) MARKET, BY FORM FACTOR , 2018-2033 (USD MILLION)
TABLE 150 NORTH AMERICA UNINTERRUPTIBLE POWER SUPPLY (UPS) MARKET, BY APPLICATION, 2018-2033 (USD MILLION)
TABLE 151 NORTH AMERICA UNINTERRUPTIBLE POWER SUPPLY (UPS) MARKET, BY PHASE, 2018-2033 (USD MILLION)
TABLE 152 NORTH AMERICA UNINTERRUPTIBLE POWER SUPPLY (UPS) MARKET, BY INSTALLATION TYPE , 2018-2033 (USD MILLION)
TABLE 153 NORTH AMERICA UNINTERRUPTIBLE POWER SUPPLY (UPS) MARKET, BY PRICE RANGE , 2018-2033 (USD MILLION)
TABLE 154 NORTH AMERICA UNINTERRUPTIBLE POWER SUPPLY (UPS) MARKET, BY ENERGY STORAGE, 2018-2033 (USD MILLION)
TABLE 155 NORTH AMERICA UNINTERRUPTIBLE POWER SUPPLY (UPS) MARKET, BY TOPOLOGY, 2018-2033 (USD MILLION)
TABLE 156 NORTH AMERICA UNINTERRUPTIBLE POWER SUPPLY (UPS) MARKET, BY DESIGN TYPE, 2018-2033 (USD MILLION)
TABLE 157 NORTH AMERICA UNINTERRUPTIBLE POWER SUPPLY (UPS) MARKET, BY VERTICLE, 2018-2033 (USD MILLION)
TABLE 158 NORTH AMERICA DATA CENTER IN UNINTERRUPTIBLE POWER SUPPLY (UPS) MARKET, BY TYPE, 2018-2033 (USD MILLION)
TABLE 159 NORTH AMERICA DATA CENTER IN UNINTERRUPTIBLE POWER SUPPLY (UPS) MARKET, BY POWER RATING, 2018-2033 (USD MILLION)
TABLE 160 NORTH AMERICA DATA CENTER IN UNINTERRUPTIBLE POWER SUPPLY (UPS) MARKET, BY TOPOLOGY, 2018-2033 (USD MILLION)
TABLE 161 NORTH AMERICA IT & TELECOM IN UNINTERRUPTIBLE POWER SUPPLY (UPS) MARKET, BY POWER RATING, 2018-2033 (USD MILLION)
TABLE 162 NORTH AMERICA IT & TELECOM IN UNINTERRUPTIBLE POWER SUPPLY (UPS) MARKET, BY TOPOLOGY, 2018-2033 (USD MILLION)
TABLE 163 NORTH AMERICA MANUFACTURING IN UNINTERRUPTIBLE POWER SUPPLY (UPS) MARKET, BY POWER RATING, 2018-2033 (USD MILLION)
TABLE 164 NORTH AMERICA MANUFACTURING IN UNINTERRUPTIBLE POWER SUPPLY (UPS) MARKET, BY TOPOLOGY, 2018-2033 (USD MILLION)
TABLE 165 NORTH AMERICA BFSI IN UNINTERRUPTIBLE POWER SUPPLY (UPS) MARKET, BY POWER RATING, 2018-2033 (USD MILLION)
TABLE 166 NORTH AMERICA BFSI IN UNINTERRUPTIBLE POWER SUPPLY (UPS) MARKET, BY TOPOLOGY, 2018-2033 (USD MILLION)
TABLE 167 NORTH AMERICA GOVERNMENT & PUBLIC SECTOR IN UNINTERRUPTIBLE POWER SUPPLY (UPS) MARKET, BY POWER RATING, 2018-2033 (USD MILLION)
TABLE 168 NORTH AMERICA GOVERNMENT & PUBLIC SECTOR IN UNINTERRUPTIBLE POWER SUPPLY (UPS) MARKET, BY TOPOLOGY, 2018-2033 (USD MILLION)
TABLE 169 NORTH AMERICA ENERGY & UTILITIES SECTOR IN UNINTERRUPTIBLE POWER SUPPLY (UPS) MARKET, BY POWER RATING, 2018-2033 (USD MILLION)
TABLE 170 NORTH AMERICA ENERGY & UTILITIES IN UNINTERRUPTIBLE POWER SUPPLY (UPS) MARKET, BY TOPOLOGY, 2018-2033 (USD MILLION)
TABLE 171 NORTH AMERICA RESIDENTIAL IN UNINTERRUPTIBLE POWER SUPPLY (UPS) MARKET, BY POWER RATING, 2018-2033 (USD MILLION)
TABLE 172 NORTH AMERICA RESIDENTIAL IN UNINTERRUPTIBLE POWER SUPPLY (UPS) MARKET, BY TOPOLOGY, 2018-2033 (USD MILLION)
TABLE 173 NORTH AMERICA HEALTHCARE IN UNINTERRUPTIBLE POWER SUPPLY (UPS) MARKET, BY POWER RATING, 2018-2033 (USD MILLION)
TABLE 174 NORTH AMERICA HEALTHCARE IN UNINTERRUPTIBLE POWER SUPPLY (UPS) MARKET, BY TOPOLOGY, 2018-2033 (USD MILLION)
TABLE 175 NORTH AMERICA RETAIL IN UNINTERRUPTIBLE POWER SUPPLY (UPS) MARKET, BY POWER RATING, 2018-2033 (USD MILLION)
TABLE 176 NORTH AMERICA RETAIL IN UNINTERRUPTIBLE POWER SUPPLY (UPS) MARKET, BY TOPOLOGY, 2018-2033 (USD MILLION)
TABLE 177 NORTH AMERICA CONSTRUCTION & REAL ESTATE IN UNINTERRUPTIBLE POWER SUPPLY (UPS) MARKET, BY POWER RATING, 2018-2033 (USD MILLION)
TABLE 178 NORTH AMERICA CONSTRUCTION & REAL ESTATE IN UNINTERRUPTIBLE POWER SUPPLY (UPS) MARKET, BY TOPOLOGY, 2018-2033 (USD MILLION)
TABLE 179 NORTH AMERICA OIL & GAS IN UNINTERRUPTIBLE POWER SUPPLY (UPS) MARKET, BY POWER RATING, 2018-2033 (USD MILLION)
TABLE 180 NORTH AMERICA OIL & GAS IN UNINTERRUPTIBLE POWER SUPPLY (UPS) MARKET, BY TOPOLOGY, 2018-2033 (USD MILLION)
TABLE 181 NORTH AMERICA HOSPITALITY & TOURISM IN UNINTERRUPTIBLE POWER SUPPLY (UPS) MARKET, BY POWER RATING, 2018-2033 (USD MILLION)
TABLE 182 NORTH AMERICA HOSPITALITY & TOURISM IN UNINTERRUPTIBLE POWER SUPPLY (UPS) MARKET, BY TOPOLOGY, 2018-2033 (USD MILLION)
TABLE 183 NORTH AMERICA TRANSPORTATION IN UNINTERRUPTIBLE POWER SUPPLY (UPS) MARKET, BY POWER RATING, 2018-2033 (USD MILLION)
TABLE 184 NORTH AMERICA TRANSPORTATION IN UNINTERRUPTIBLE POWER SUPPLY (UPS) MARKET, BY TOPOLOGY, 2018-2033 (USD MILLION)
TABLE 185 NORTH AMERICA EDUCATION IN UNINTERRUPTIBLE POWER SUPPLY (UPS) MARKET, BY POWER RATING, 2018-2033 (USD MILLION)
TABLE 186 NORTH AMERICA EDUCATION IN UNINTERRUPTIBLE POWER SUPPLY (UPS) MARKET, BY TOPOLOGY, 2018-2033 (USD MILLION)
TABLE 187 NORTH AMERICA MEDIA AND ENTERTAINMENT IN UNINTERRUPTIBLE POWER SUPPLY (UPS) MARKET, BY POWER RATING, 2018-2033 (USD MILLION)
TABLE 188 NORTH AMERICA MEDIA AND ENTERTAINMENT IN UNINTERRUPTIBLE POWER SUPPLY (UPS) MARKET, BY TOPOLOGY, 2018-2033 (USD MILLION)
TABLE 189 NORTH AMERICA E-COMMERCE IN UNINTERRUPTIBLE POWER SUPPLY (UPS) MARKET, BY POWER RATING, 2018-2033 (USD MILLION)
TABLE 190 NORTH AMERICA E-COMMERCE IN UNINTERRUPTIBLE POWER SUPPLY (UPS) MARKET, BY TOPOLOGY, 2018-2033 (USD MILLION)
TABLE 191 NORTH AMERICA GAMING IN UNINTERRUPTIBLE POWER SUPPLY (UPS) MARKET, BY POWER RATING, 2018-2033 (USD MILLION)
TABLE 192 NORTH AMERICA GAMING IN UNINTERRUPTIBLE POWER SUPPLY (UPS) MARKET, BY TOPOLOGY, 2018-2033 (USD MILLION)
TABLE 193 NORTH AMERICA OTHERS IN UNINTERRUPTIBLE POWER SUPPLY (UPS) MARKET, BY POWER RATING, 2018-2033 (USD MILLION)
TABLE 194 NORTH AMERICA OTHERS IN UNINTERRUPTIBLE POWER SUPPLY (UPS) MARKET, BY TOPOLOGY, 2018-2033 (USD MILLION)
TABLE 195 NORTH AMERICA UNINTERRUPTIBLE POWER SUPPLY (UPS) MARKET, BY SALES CHANNEL, 2018-2033 (USD MILLION)
TABLE 196 NORTH AMERICA INDIRECT IN UNINTERRUPTIBLE POWER SUPPLY (UPS) MARKET, BY TYPE, 2018-2033 (USD MILLION)
TABLE 197 US UNINTERRUPTIBLE POWER SUPPLY (UPS) MARKET, BY OFFERING, 2018-2033 (USD MILLION)
TABLE 198 US HARDWARE IN UNINTERRUPTIBLE POWER SUPPLY (UPS) MARKET, BY TYPE, 2018-2033 (USD MILLION)
TABLE 199 US BATTERY IN UNINTERRUPTIBLE POWER SUPPLY (UPS) MARKET, BY TYPE, 2018-2033 (USD MILLION)
TABLE 200 US BATTERY IN UNINTERRUPTIBLE POWER SUPPLY (UPS) MARKET, BY CONFIGURATION, 2018-2033 (USD MILLION)
TABLE 201 US ACCESSORIES IN UNINTERRUPTIBLE POWER SUPPLY (UPS) MARKET, BY TYPE, 2018-2033 (USD MILLION)
TABLE 202 US SERVICES IN UNINTERRUPTIBLE POWER SUPPLY (UPS) MARKET, BY TYPE, 2018-2033 (USD MILLION)
TABLE 203 US SOFTWARE IN UNINTERRUPTIBLE POWER SUPPLY (UPS) MARKET, BY TYPE, 2018-2033 (USD MILLION)
TABLE 204 US UNINTERRUPTIBLE POWER SUPPLY (UPS) MARKET, BY POWER RATING, 2018-2033 (USD MILLION)
TABLE 205 US UNINTERRUPTIBLE POWER SUPPLY (UPS) MARKET, BY POWER RATING, 2018-2033 (UNITS)
TABLE 206 US UNINTERRUPTIBLE POWER SUPPLY (UPS) MARKET, BY ORGANAIZATION SIZE , 2018-2033 (USD MILLION)
TABLE 207 US UNINTERRUPTIBLE POWER SUPPLY (UPS) MARKET, BY FORM FACTOR , 2018-2033 (USD MILLION)
TABLE 208 US UNINTERRUPTIBLE POWER SUPPLY (UPS) MARKET, BY APPLICATION, 2018-2033 (USD MILLION)
TABLE 209 US UNINTERRUPTIBLE POWER SUPPLY (UPS) MARKET, BY PHASE, 2018-2033 (USD MILLION)
TABLE 210 US UNINTERRUPTIBLE POWER SUPPLY (UPS) MARKET, BY INSTALLATION TYPE , 2018-2033 (USD MILLION)
TABLE 211 US UNINTERRUPTIBLE POWER SUPPLY (UPS) MARKET, BY PRICE RANGE , 2018-2033 (USD MILLION)
TABLE 212 US UNINTERRUPTIBLE POWER SUPPLY (UPS) MARKET, BY ENERGY STORAGE, 2018-2033 (USD MILLION)
TABLE 213 US UNINTERRUPTIBLE POWER SUPPLY (UPS) MARKET, BY TOPOLOGY, 2018-2033 (USD MILLION)
TABLE 214 US UNINTERRUPTIBLE POWER SUPPLY (UPS) MARKET, BY DESIGN TYPE, 2018-2033 (USD MILLION)
TABLE 215 US UNINTERRUPTIBLE POWER SUPPLY (UPS) MARKET, BY VERTICLE, 2018-2033 (USD MILLION)
TABLE 216 US DATA CENTER IN UNINTERRUPTIBLE POWER SUPPLY (UPS) MARKET, BY TYPE, 2018-2033 (USD MILLION)
TABLE 217 US DATA CENTER IN UNINTERRUPTIBLE POWER SUPPLY (UPS) MARKET, BY POWER RATING, 2018-2033 (USD MILLION)
TABLE 218 US DATA CENTER IN UNINTERRUPTIBLE POWER SUPPLY (UPS) MARKET, BY TOPOLOGY, 2018-2033 (USD MILLION)
TABLE 219 US IT & TELECOM IN UNINTERRUPTIBLE POWER SUPPLY (UPS) MARKET, BY POWER RATING, 2018-2033 (USD MILLION)
TABLE 220 US IT & TELECOM IN UNINTERRUPTIBLE POWER SUPPLY (UPS) MARKET, BY TOPOLOGY, 2018-2033 (USD MILLION)
TABLE 221 US MANUFACTURING IN UNINTERRUPTIBLE POWER SUPPLY (UPS) MARKET, BY POWER RATING, 2018-2033 (USD MILLION)
TABLE 222 US MANUFACTURING IN UNINTERRUPTIBLE POWER SUPPLY (UPS) MARKET, BY TOPOLOGY, 2018-2033 (USD MILLION)
TABLE 223 US BFSI IN UNINTERRUPTIBLE POWER SUPPLY (UPS) MARKET, BY POWER RATING, 2018-2033 (USD MILLION)
TABLE 224 US BFSI IN UNINTERRUPTIBLE POWER SUPPLY (UPS) MARKET, BY TOPOLOGY, 2018-2033 (USD MILLION)
TABLE 225 US GOVERNMENT & PUBLIC SECTOR IN UNINTERRUPTIBLE POWER SUPPLY (UPS) MARKET, BY POWER RATING, 2018-2033 (USD MILLION)
TABLE 226 US GOVERNMENT & PUBLIC SECTOR IN UNINTERRUPTIBLE POWER SUPPLY (UPS) MARKET, BY TOPOLOGY, 2018-2033 (USD MILLION)
TABLE 227 US ENERGY & UTILITIES SECTOR IN UNINTERRUPTIBLE POWER SUPPLY (UPS) MARKET, BY POWER RATING, 2018-2033 (USD MILLION)
TABLE 228 US ENERGY & UTILITIES IN UNINTERRUPTIBLE POWER SUPPLY (UPS) MARKET, BY TOPOLOGY, 2018-2033 (USD MILLION)
TABLE 229 US RESIDENTIAL IN UNINTERRUPTIBLE POWER SUPPLY (UPS) MARKET, BY POWER RATING, 2018-2033 (USD MILLION)
TABLE 230 US RESIDENTIAL IN UNINTERRUPTIBLE POWER SUPPLY (UPS) MARKET, BY TOPOLOGY, 2018-2033 (USD MILLION)
TABLE 231 US HEALTHCARE IN UNINTERRUPTIBLE POWER SUPPLY (UPS) MARKET, BY POWER RATING, 2018-2033 (USD MILLION)
TABLE 232 US HEALTHCARE IN UNINTERRUPTIBLE POWER SUPPLY (UPS) MARKET, BY TOPOLOGY, 2018-2033 (USD MILLION)
TABLE 233 US RETAIL IN UNINTERRUPTIBLE POWER SUPPLY (UPS) MARKET, BY POWER RATING, 2018-2033 (USD MILLION)
TABLE 234 US RETAIL IN UNINTERRUPTIBLE POWER SUPPLY (UPS) MARKET, BY TOPOLOGY, 2018-2033 (USD MILLION)
TABLE 235 US CONSTRUCTION & REAL ESTATE IN UNINTERRUPTIBLE POWER SUPPLY (UPS) MARKET, BY POWER RATING, 2018-2033 (USD MILLION)
TABLE 236 US CONSTRUCTION & REAL ESTATE IN UNINTERRUPTIBLE POWER SUPPLY (UPS) MARKET, BY TOPOLOGY, 2018-2033 (USD MILLION)
TABLE 237 US OIL & GAS IN UNINTERRUPTIBLE POWER SUPPLY (UPS) MARKET, BY POWER RATING, 2018-2033 (USD MILLION)
TABLE 238 US OIL & GAS IN UNINTERRUPTIBLE POWER SUPPLY (UPS) MARKET, BY TOPOLOGY, 2018-2033 (USD MILLION)
TABLE 239 US HOSPITALITY & TOURISM IN UNINTERRUPTIBLE POWER SUPPLY (UPS) MARKET, BY POWER RATING, 2018-2033 (USD MILLION)
TABLE 240 US HOSPITALITY & TOURISM IN UNINTERRUPTIBLE POWER SUPPLY (UPS) MARKET, BY TOPOLOGY, 2018-2033 (USD MILLION)
TABLE 241 US TRANSPORTATION IN UNINTERRUPTIBLE POWER SUPPLY (UPS) MARKET, BY POWER RATING, 2018-2033 (USD MILLION)
TABLE 242 US TRANSPORTATION IN UNINTERRUPTIBLE POWER SUPPLY (UPS) MARKET, BY TOPOLOGY, 2018-2033 (USD MILLION)
TABLE 243 US EDUCATION IN UNINTERRUPTIBLE POWER SUPPLY (UPS) MARKET, BY POWER RATING, 2018-2033 (USD MILLION)
TABLE 244 US EDUCATION IN UNINTERRUPTIBLE POWER SUPPLY (UPS) MARKET, BY TOPOLOGY, 2018-2033 (USD MILLION)
TABLE 245 US MEDIA AND ENTERTAINMENT IN UNINTERRUPTIBLE POWER SUPPLY (UPS) MARKET, BY POWER RATING, 2018-2033 (USD MILLION)
TABLE 246 US MEDIA AND ENTERTAINMENT IN UNINTERRUPTIBLE POWER SUPPLY (UPS) MARKET, BY TOPOLOGY, 2018-2033 (USD MILLION)
TABLE 247 US E-COMMERCE IN UNINTERRUPTIBLE POWER SUPPLY (UPS) MARKET, BY POWER RATING, 2018-2033 (USD MILLION)
TABLE 248 US E-COMMERCE IN UNINTERRUPTIBLE POWER SUPPLY (UPS) MARKET, BY TOPOLOGY, 2018-2033 (USD MILLION)
TABLE 249 US GAMING IN UNINTERRUPTIBLE POWER SUPPLY (UPS) MARKET, BY POWER RATING, 2018-2033 (USD MILLION)
TABLE 250 US GAMING IN UNINTERRUPTIBLE POWER SUPPLY (UPS) MARKET, BY TOPOLOGY, 2018-2033 (USD MILLION)
TABLE 251 US OTHERS IN UNINTERRUPTIBLE POWER SUPPLY (UPS) MARKET, BY POWER RATING, 2018-2033 (USD MILLION)
TABLE 252 US OTHERS IN UNINTERRUPTIBLE POWER SUPPLY (UPS) MARKET, BY TOPOLOGY, 2018-2033 (USD MILLION)
TABLE 253 US UNINTERRUPTIBLE POWER SUPPLY (UPS) MARKET, BY SALES CHANNEL, 2018-2033 (USD MILLION)
TABLE 254 US INDIRECT IN UNINTERRUPTIBLE POWER SUPPLY (UPS) MARKET, BY TYPE, 2018-2033 (USD MILLION)
TABLE 255 CANADA UNINTERRUPTIBLE POWER SUPPLY (UPS) MARKET, BY OFFERING, 2018-2033 (USD MILLION)
TABLE 256 CANADA HARDWARE IN UNINTERRUPTIBLE POWER SUPPLY (UPS) MARKET, BY TYPE, 2018-2033 (USD MILLION)
TABLE 257 CANADA BATTERY IN UNINTERRUPTIBLE POWER SUPPLY (UPS) MARKET, BY TYPE, 2018-2033 (USD MILLION)
TABLE 258 CANADA BATTERY IN UNINTERRUPTIBLE POWER SUPPLY (UPS) MARKET, BY CONFIGURATION, 2018-2033 (USD MILLION)
TABLE 259 CANADA ACCESSORIES IN UNINTERRUPTIBLE POWER SUPPLY (UPS) MARKET, BY TYPE, 2018-2033 (USD MILLION)
TABLE 260 CANADA SERVICES IN UNINTERRUPTIBLE POWER SUPPLY (UPS) MARKET, BY TYPE, 2018-2033 (USD MILLION)
TABLE 261 CANADA SOFTWARE IN UNINTERRUPTIBLE POWER SUPPLY (UPS) MARKET, BY TYPE, 2018-2033 (USD MILLION)
TABLE 262 CANADA UNINTERRUPTIBLE POWER SUPPLY (UPS) MARKET, BY POWER RATING, 2018-2033 (USD MILLION)
TABLE 263 CANADA UNINTERRUPTIBLE POWER SUPPLY (UPS) MARKET, BY POWER RATING, 2018-2033 (UNITS)
TABLE 264 CANADA UNINTERRUPTIBLE POWER SUPPLY (UPS) MARKET, BY ORGANAIZATION SIZE , 2018-2033 (USD MILLION)
TABLE 265 CANADA UNINTERRUPTIBLE POWER SUPPLY (UPS) MARKET, BY FORM FACTOR , 2018-2033 (USD MILLION)
TABLE 266 CANADA UNINTERRUPTIBLE POWER SUPPLY (UPS) MARKET, BY APPLICATION, 2018-2033 (USD MILLION)
TABLE 267 CANADA UNINTERRUPTIBLE POWER SUPPLY (UPS) MARKET, BY PHASE, 2018-2033 (USD MILLION)
TABLE 268 CANADA UNINTERRUPTIBLE POWER SUPPLY (UPS) MARKET, BY INSTALLATION TYPE , 2018-2033 (USD MILLION)
TABLE 269 CANADA UNINTERRUPTIBLE POWER SUPPLY (UPS) MARKET, BY PRICE RANGE , 2018-2033 (USD MILLION)
TABLE 270 CANADA UNINTERRUPTIBLE POWER SUPPLY (UPS) MARKET, BY ENERGY STORAGE, 2018-2033 (USD MILLION)
TABLE 271 CANADA UNINTERRUPTIBLE POWER SUPPLY (UPS) MARKET, BY TOPOLOGY, 2018-2033 (USD MILLION)
TABLE 272 CANADA UNINTERRUPTIBLE POWER SUPPLY (UPS) MARKET, BY DESIGN TYPE, 2018-2033 (USD MILLION)
TABLE 273 CANADA UNINTERRUPTIBLE POWER SUPPLY (UPS) MARKET, BY VERTICLE, 2018-2033 (USD MILLION)
TABLE 274 CANADA DATA CENTER IN UNINTERRUPTIBLE POWER SUPPLY (UPS) MARKET, BY TYPE, 2018-2033 (USD MILLION)
TABLE 275 CANADA DATA CENTER IN UNINTERRUPTIBLE POWER SUPPLY (UPS) MARKET, BY POWER RATING, 2018-2033 (USD MILLION)
TABLE 276 CANADA DATA CENTER IN UNINTERRUPTIBLE POWER SUPPLY (UPS) MARKET, BY TOPOLOGY, 2018-2033 (USD MILLION)
TABLE 277 CANADA IT & TELECOM IN UNINTERRUPTIBLE POWER SUPPLY (UPS) MARKET, BY POWER RATING, 2018-2033 (USD MILLION)
TABLE 278 CANADA IT & TELECOM IN UNINTERRUPTIBLE POWER SUPPLY (UPS) MARKET, BY TOPOLOGY, 2018-2033 (USD MILLION)
TABLE 279 CANADA MANUFACTURING IN UNINTERRUPTIBLE POWER SUPPLY (UPS) MARKET, BY POWER RATING, 2018-2033 (USD MILLION)
TABLE 280 CANADA MANUFACTURING IN UNINTERRUPTIBLE POWER SUPPLY (UPS) MARKET, BY TOPOLOGY, 2018-2033 (USD MILLION)
TABLE 281 CANADA BFSI IN UNINTERRUPTIBLE POWER SUPPLY (UPS) MARKET, BY POWER RATING, 2018-2033 (USD MILLION)
TABLE 282 CANADA BFSI IN UNINTERRUPTIBLE POWER SUPPLY (UPS) MARKET, BY TOPOLOGY, 2018-2033 (USD MILLION)
TABLE 283 CANADA GOVERNMENT & PUBLIC SECTOR IN UNINTERRUPTIBLE POWER SUPPLY (UPS) MARKET, BY POWER RATING, 2018-2033 (USD MILLION)
TABLE 284 CANADA GOVERNMENT & PUBLIC SECTOR IN UNINTERRUPTIBLE POWER SUPPLY (UPS) MARKET, BY TOPOLOGY, 2018-2033 (USD MILLION)
TABLE 285 CANADA ENERGY & UTILITIES SECTOR IN UNINTERRUPTIBLE POWER SUPPLY (UPS) MARKET, BY POWER RATING, 2018-2033 (USD MILLION)
TABLE 286 CANADA ENERGY & UTILITIES IN UNINTERRUPTIBLE POWER SUPPLY (UPS) MARKET, BY TOPOLOGY, 2018-2033 (USD MILLION)
TABLE 287 CANADA RESIDENTIAL IN UNINTERRUPTIBLE POWER SUPPLY (UPS) MARKET, BY POWER RATING, 2018-2033 (USD MILLION)
TABLE 288 CANADA RESIDENTIAL IN UNINTERRUPTIBLE POWER SUPPLY (UPS) MARKET, BY TOPOLOGY, 2018-2033 (USD MILLION)
TABLE 289 CANADA HEALTHCARE IN UNINTERRUPTIBLE POWER SUPPLY (UPS) MARKET, BY POWER RATING, 2018-2033 (USD MILLION)
TABLE 290 CANADA HEALTHCARE IN UNINTERRUPTIBLE POWER SUPPLY (UPS) MARKET, BY TOPOLOGY, 2018-2033 (USD MILLION)
TABLE 291 CANADA RETAIL IN UNINTERRUPTIBLE POWER SUPPLY (UPS) MARKET, BY POWER RATING, 2018-2033 (USD MILLION)
TABLE 292 CANADA RETAIL IN UNINTERRUPTIBLE POWER SUPPLY (UPS) MARKET, BY TOPOLOGY, 2018-2033 (USD MILLION)
TABLE 293 CANADA CONSTRUCTION & REAL ESTATE IN UNINTERRUPTIBLE POWER SUPPLY (UPS) MARKET, BY POWER RATING, 2018-2033 (USD MILLION)
TABLE 294 CANADA CONSTRUCTION & REAL ESTATE IN UNINTERRUPTIBLE POWER SUPPLY (UPS) MARKET, BY TOPOLOGY, 2018-2033 (USD MILLION)
TABLE 295 CANADA OIL & GAS IN UNINTERRUPTIBLE POWER SUPPLY (UPS) MARKET, BY POWER RATING, 2018-2033 (USD MILLION)
TABLE 296 CANADA OIL & GAS IN UNINTERRUPTIBLE POWER SUPPLY (UPS) MARKET, BY TOPOLOGY, 2018-2033 (USD MILLION)
TABLE 297 CANADA HOSPITALITY & TOURISM IN UNINTERRUPTIBLE POWER SUPPLY (UPS) MARKET, BY POWER RATING, 2018-2033 (USD MILLION)
TABLE 298 CANADA HOSPITALITY & TOURISM IN UNINTERRUPTIBLE POWER SUPPLY (UPS) MARKET, BY TOPOLOGY, 2018-2033 (USD MILLION)
TABLE 299 CANADA TRANSPORTATION IN UNINTERRUPTIBLE POWER SUPPLY (UPS) MARKET, BY POWER RATING, 2018-2033 (USD MILLION)
TABLE 300 CANADA TRANSPORTATION IN UNINTERRUPTIBLE POWER SUPPLY (UPS) MARKET, BY TOPOLOGY, 2018-2033 (USD MILLION)
TABLE 301 CANADA EDUCATION IN UNINTERRUPTIBLE POWER SUPPLY (UPS) MARKET, BY POWER RATING, 2018-2033 (USD MILLION)
TABLE 302 CANADA EDUCATION IN UNINTERRUPTIBLE POWER SUPPLY (UPS) MARKET, BY TOPOLOGY, 2018-2033 (USD MILLION)
TABLE 303 CANADA MEDIA AND ENTERTAINMENT IN UNINTERRUPTIBLE POWER SUPPLY (UPS) MARKET, BY POWER RATING, 2018-2033 (USD MILLION)
TABLE 304 CANADA MEDIA AND ENTERTAINMENT IN UNINTERRUPTIBLE POWER SUPPLY (UPS) MARKET, BY TOPOLOGY, 2018-2033 (USD MILLION)
TABLE 305 CANADA E-COMMERCE IN UNINTERRUPTIBLE POWER SUPPLY (UPS) MARKET, BY POWER RATING, 2018-2033 (USD MILLION)
TABLE 306 CANADA E-COMMERCE IN UNINTERRUPTIBLE POWER SUPPLY (UPS) MARKET, BY TOPOLOGY, 2018-2033 (USD MILLION)
TABLE 307 CANADA GAMING IN UNINTERRUPTIBLE POWER SUPPLY (UPS) MARKET, BY POWER RATING, 2018-2033 (USD MILLION)
TABLE 308 CANADA GAMING IN UNINTERRUPTIBLE POWER SUPPLY (UPS) MARKET, BY TOPOLOGY, 2018-2033 (USD MILLION)
TABLE 309 CANADA OTHERS IN UNINTERRUPTIBLE POWER SUPPLY (UPS) MARKET, BY POWER RATING, 2018-2033 (USD MILLION)
TABLE 310 CANADA OTHERS IN UNINTERRUPTIBLE POWER SUPPLY (UPS) MARKET, BY TOPOLOGY, 2018-2033 (USD MILLION)
TABLE 311 CANADA UNINTERRUPTIBLE POWER SUPPLY (UPS) MARKET, BY SALES CHANNEL, 2018-2033 (USD MILLION)
TABLE 312 CANADA INDIRECT IN UNINTERRUPTIBLE POWER SUPPLY (UPS) MARKET, BY TYPE, 2018-2033 (USD MILLION)
TABLE 313 MEXICO UNINTERRUPTIBLE POWER SUPPLY (UPS) MARKET, BY OFFERING, 2018-2033 (USD MILLION)
TABLE 314 MEXICO HARDWARE IN UNINTERRUPTIBLE POWER SUPPLY (UPS) MARKET, BY TYPE, 2018-2033 (USD MILLION)
TABLE 315 MEXICO BATTERY IN UNINTERRUPTIBLE POWER SUPPLY (UPS) MARKET, BY TYPE, 2018-2033 (USD MILLION)
TABLE 316 MEXICO BATTERY IN UNINTERRUPTIBLE POWER SUPPLY (UPS) MARKET, BY CONFIGURATION, 2018-2033 (USD MILLION)
TABLE 317 MEXICO ACCESSORIES IN UNINTERRUPTIBLE POWER SUPPLY (UPS) MARKET, BY TYPE, 2018-2033 (USD MILLION)
TABLE 318 MEXICO SERVICES IN UNINTERRUPTIBLE POWER SUPPLY (UPS) MARKET, BY TYPE, 2018-2033 (USD MILLION)
TABLE 319 MEXICO SOFTWARE IN UNINTERRUPTIBLE POWER SUPPLY (UPS) MARKET, BY TYPE, 2018-2033 (USD MILLION)
TABLE 320 MEXICO UNINTERRUPTIBLE POWER SUPPLY (UPS) MARKET, BY POWER RATING, 2018-2033 (USD MILLION)
TABLE 321 MEXICO UNINTERRUPTIBLE POWER SUPPLY (UPS) MARKET, BY POWER RATING, 2018-2033 (UNITS)
TABLE 322 MEXICO UNINTERRUPTIBLE POWER SUPPLY (UPS) MARKET, BY ORGANAIZATION SIZE , 2018-2033 (USD MILLION)
TABLE 323 MEXICO UNINTERRUPTIBLE POWER SUPPLY (UPS) MARKET, BY FORM FACTOR , 2018-2033 (USD MILLION)
TABLE 324 MEXICO UNINTERRUPTIBLE POWER SUPPLY (UPS) MARKET, BY APPLICATION, 2018-2033 (USD MILLION)
TABLE 325 MEXICO UNINTERRUPTIBLE POWER SUPPLY (UPS) MARKET, BY PHASE, 2018-2033 (USD MILLION)
TABLE 326 MEXICO UNINTERRUPTIBLE POWER SUPPLY (UPS) MARKET, BY INSTALLATION TYPE , 2018-2033 (USD MILLION)
TABLE 327 MEXICO UNINTERRUPTIBLE POWER SUPPLY (UPS) MARKET, BY PRICE RANGE , 2018-2033 (USD MILLION)
TABLE 328 MEXICO UNINTERRUPTIBLE POWER SUPPLY (UPS) MARKET, BY ENERGY STORAGE, 2018-2033 (USD MILLION)
TABLE 329 MEXICO UNINTERRUPTIBLE POWER SUPPLY (UPS) MARKET, BY TOPOLOGY, 2018-2033 (USD MILLION)
TABLE 330 MEXICO UNINTERRUPTIBLE POWER SUPPLY (UPS) MARKET, BY DESIGN TYPE, 2018-2033 (USD MILLION)
TABLE 331 MEXICO UNINTERRUPTIBLE POWER SUPPLY (UPS) MARKET, BY VERTICLE, 2018-2033 (USD MILLION)
TABLE 332 MEXICO DATA CENTER IN UNINTERRUPTIBLE POWER SUPPLY (UPS) MARKET, BY TYPE, 2018-2033 (USD MILLION)
TABLE 333 MEXICO DATA CENTER IN UNINTERRUPTIBLE POWER SUPPLY (UPS) MARKET, BY POWER RATING, 2018-2033 (USD MILLION)
TABLE 334 MEXICO DATA CENTER IN UNINTERRUPTIBLE POWER SUPPLY (UPS) MARKET, BY TOPOLOGY, 2018-2033 (USD MILLION)
TABLE 335 MEXICO IT & TELECOM IN UNINTERRUPTIBLE POWER SUPPLY (UPS) MARKET, BY POWER RATING, 2018-2033 (USD MILLION)
TABLE 336 MEXICO IT & TELECOM IN UNINTERRUPTIBLE POWER SUPPLY (UPS) MARKET, BY TOPOLOGY, 2018-2033 (USD MILLION)
TABLE 337 MEXICO MANUFACTURING IN UNINTERRUPTIBLE POWER SUPPLY (UPS) MARKET, BY POWER RATING, 2018-2033 (USD MILLION)
TABLE 338 MEXICO MANUFACTURING IN UNINTERRUPTIBLE POWER SUPPLY (UPS) MARKET, BY TOPOLOGY, 2018-2033 (USD MILLION)
TABLE 339 MEXICO BFSI IN UNINTERRUPTIBLE POWER SUPPLY (UPS) MARKET, BY POWER RATING, 2018-2033 (USD MILLION)
TABLE 340 MEXICO BFSI IN UNINTERRUPTIBLE POWER SUPPLY (UPS) MARKET, BY TOPOLOGY, 2018-2033 (USD MILLION)
TABLE 341 MEXICO GOVERNMENT & PUBLIC SECTOR IN UNINTERRUPTIBLE POWER SUPPLY (UPS) MARKET, BY POWER RATING, 2018-2033 (USD MILLION)
TABLE 342 MEXICO GOVERNMENT & PUBLIC SECTOR IN UNINTERRUPTIBLE POWER SUPPLY (UPS) MARKET, BY TOPOLOGY, 2018-2033 (USD MILLION)
TABLE 343 MEXICO ENERGY & UTILITIES SECTOR IN UNINTERRUPTIBLE POWER SUPPLY (UPS) MARKET, BY POWER RATING, 2018-2033 (USD MILLION)
TABLE 344 MEXICO ENERGY & UTILITIES IN UNINTERRUPTIBLE POWER SUPPLY (UPS) MARKET, BY TOPOLOGY, 2018-2033 (USD MILLION)
TABLE 345 MEXICO RESIDENTIAL IN UNINTERRUPTIBLE POWER SUPPLY (UPS) MARKET, BY POWER RATING, 2018-2033 (USD MILLION)
TABLE 346 MEXICO RESIDENTIAL IN UNINTERRUPTIBLE POWER SUPPLY (UPS) MARKET, BY TOPOLOGY, 2018-2033 (USD MILLION)
TABLE 347 MEXICO HEALTHCARE IN UNINTERRUPTIBLE POWER SUPPLY (UPS) MARKET, BY POWER RATING, 2018-2033 (USD MILLION)
TABLE 348 MEXICO HEALTHCARE IN UNINTERRUPTIBLE POWER SUPPLY (UPS) MARKET, BY TOPOLOGY, 2018-2033 (USD MILLION)
TABLE 349 MEXICO RETAIL IN UNINTERRUPTIBLE POWER SUPPLY (UPS) MARKET, BY POWER RATING, 2018-2033 (USD MILLION)
TABLE 350 MEXICO RETAIL IN UNINTERRUPTIBLE POWER SUPPLY (UPS) MARKET, BY TOPOLOGY, 2018-2033 (USD MILLION)
TABLE 351 MEXICO CONSTRUCTION & REAL ESTATE IN UNINTERRUPTIBLE POWER SUPPLY (UPS) MARKET, BY POWER RATING, 2018-2033 (USD MILLION)
TABLE 352 MEXICO CONSTRUCTION & REAL ESTATE IN UNINTERRUPTIBLE POWER SUPPLY (UPS) MARKET, BY TOPOLOGY, 2018-2033 (USD MILLION)
TABLE 353 MEXICO OIL & GAS IN UNINTERRUPTIBLE POWER SUPPLY (UPS) MARKET, BY POWER RATING, 2018-2033 (USD MILLION)
TABLE 354 MEXICO OIL & GAS IN UNINTERRUPTIBLE POWER SUPPLY (UPS) MARKET, BY TOPOLOGY, 2018-2033 (USD MILLION)
TABLE 355 MEXICO HOSPITALITY & TOURISM IN UNINTERRUPTIBLE POWER SUPPLY (UPS) MARKET, BY POWER RATING, 2018-2033 (USD MILLION)
TABLE 356 MEXICO HOSPITALITY & TOURISM IN UNINTERRUPTIBLE POWER SUPPLY (UPS) MARKET, BY TOPOLOGY, 2018-2033 (USD MILLION)
TABLE 357 MEXICO TRANSPORTATION IN UNINTERRUPTIBLE POWER SUPPLY (UPS) MARKET, BY POWER RATING, 2018-2033 (USD MILLION)
TABLE 358 MEXICO TRANSPORTATION IN UNINTERRUPTIBLE POWER SUPPLY (UPS) MARKET, BY TOPOLOGY, 2018-2033 (USD MILLION)
TABLE 359 MEXICO EDUCATION IN UNINTERRUPTIBLE POWER SUPPLY (UPS) MARKET, BY POWER RATING, 2018-2033 (USD MILLION)
TABLE 360 MEXICO EDUCATION IN UNINTERRUPTIBLE POWER SUPPLY (UPS) MARKET, BY TOPOLOGY, 2018-2033 (USD MILLION)
TABLE 361 MEXICO MEDIA AND ENTERTAINMENT IN UNINTERRUPTIBLE POWER SUPPLY (UPS) MARKET, BY POWER RATING, 2018-2033 (USD MILLION)
TABLE 362 MEXICO MEDIA AND ENTERTAINMENT IN UNINTERRUPTIBLE POWER SUPPLY (UPS) MARKET, BY TOPOLOGY, 2018-2033 (USD MILLION)
TABLE 363 MEXICO E-COMMERCE IN UNINTERRUPTIBLE POWER SUPPLY (UPS) MARKET, BY POWER RATING, 2018-2033 (USD MILLION)
TABLE 364 MEXICO E-COMMERCE IN UNINTERRUPTIBLE POWER SUPPLY (UPS) MARKET, BY TOPOLOGY, 2018-2033 (USD MILLION)
TABLE 365 MEXICO GAMING IN UNINTERRUPTIBLE POWER SUPPLY (UPS) MARKET, BY POWER RATING, 2018-2033 (USD MILLION)
TABLE 366 MEXICO GAMING IN UNINTERRUPTIBLE POWER SUPPLY (UPS) MARKET, BY TOPOLOGY, 2018-2033 (USD MILLION)
TABLE 367 MEXICO OTHERS IN UNINTERRUPTIBLE POWER SUPPLY (UPS) MARKET, BY POWER RATING, 2018-2033 (USD MILLION)
TABLE 368 MEXICO OTHERS IN UNINTERRUPTIBLE POWER SUPPLY (UPS) MARKET, BY TOPOLOGY, 2018-2033 (USD MILLION)
TABLE 369 MEXICO UNINTERRUPTIBLE POWER SUPPLY (UPS) MARKET, BY SALES CHANNEL, 2018-2033 (USD MILLION)
TABLE 370 MEXICO INDIRECT IN UNINTERRUPTIBLE POWER SUPPLY (UPS) MARKET, BY TYPE, 2018-2033 (USD MILLION)
List of Figure
FIGURE 1 NORTH AMERICA UNINTERRUPTIBLE POWER SUPPLY (UPS) MARKET: SEGMENTATION
FIGURE 2 NORTH AMERICA UNINTERRUPTIBLE POWER SUPPLY (UPS) MARKET: DATA TRIANGULATION
FIGURE 3 NORTH AMERICA UNINTERRUPTIBLE POWER SUPPLY (UPS) MARKET: DROC ANALYSIS
FIGURE 4 NORTH AMERICA UNINTERRUPTIBLE POWER SUPPLY (UPS) MARKET: NORTH AMERICA VS REGIONAL ANALYSIS
FIGURE 5 NORTH AMERICA UNINTERRUPTIBLE POWER SUPPLY (UPS) MARKET: COMPANY RESEARCH ANALYSIS
FIGURE 6 NORTH AMERICA UNINTERRUPTIBLE POWER SUPPLY (UPS) MARKET: INTERVIEW DEMOGRAPHICS
FIGURE 7 NORTH AMERICA UNINTERRUPTIBLE POWER SUPPLY (UPS) MARKET: DBMR MARKET POSITION GRID
FIGURE 8 NORTH AMERICA UNINTERRUPTIBLE POWER SUPPLY (UPS) MARKET: MARKET APPLICATION COVERAGE GRID
FIGURE 9 STRATEGIC DECISIONS
FIGURE 10 THREE SEGMENTS COMPRISE THE NORTH AMERICA UNINTERRUPTIBLE POWER SUPPLY (UPS) MARKET, BY OFFERING (2025)
FIGURE 11 NORTH AMERICA UNINTERRUPTIBLE POWER SUPPLY (UPS) MARKET: SEGMENTATION
FIGURE 12 ACCELERATION OF NATIONAL DIGITAL TRANSFORMATION AND DATA LOCALIZATION INFRASTRUCTURE DEVELOPMENT EXPECTED TO DRIVE THE NORTH AMERICA UNINTERRUPTIBLE POWER SUPPLY (UPS) MARKET IN THE FORECAST PERIOD OF 2025 TO 2033
FIGURE 13 HARDWARE SEGMENT IS EXPECTED TO ACCOUNT FOR THE LARGEST SHARE OF THE NORTH AMERICA UNINTERRUPTIBLE POWER SUPPLY (UPS) MARKET IN 2025 & 2032
FIGURE 14 PORTER’S FIVE FORCES
FIGURE 15 NORTH AMERICA UNINTERRUPTIBLE POWER SUPPLY (UPS) MARKET, 2025-2033, AVERAGE SELLING PRICE (USD THOUSAND /THOUSAND UNITS)
FIGURE 16 TOTAL PATENTS IN THE NORTH AMERICA UPS MARKET
FIGURE 17 NORTH AMERICA UPS MARKET VALUE CHAIN — EIGHT STAGES FROM RAW MATERIALS TO MANAGED SERVICES
FIGURE 18 DRIVER, RESTRAINTS, OPPORTUNITIES & CHALLENGES ANALYSIS OF NORTH AMERICA UNINTERRUPTIBLE POWER SUPPLY (UPS) MARKET
FIGURE 19 UNINTERRUPTIBLE POWER SUPPLY (UPS) MARKET: BY OFFERING, 2025
FIGURE 20 NORTH AMERICA UNINTERRUPTIBLE POWER SUPPLY (UPS) MARKET: BY POWER RATING, 2025
FIGURE 21 NORTH AMERICA UNINTERRUPTIBLE POWER SUPPLY (UPS) MARKET: BY ORGANIZATION SIZE, 2025
FIGURE 22 NORTH AMERICA UNINTERRUPTIBLE POWER SUPPLY (UPS) MARKET: BY FORM FACTOR, 2025
FIGURE 23 NORTH AMERICA UNINTERRUPTIBLE POWER SUPPLY (UPS) MARKET: BY APPLICATION, 2025
FIGURE 24 NORTH AMERICA UNINTERRUPTIBLE POWER SUPPLY (UPS) MARKET: BY PHASE, 2025
FIGURE 25 NORTH AMERICA UNINTERRUPTIBLE POWER SUPPLY (UPS) MARKET: BY INSTALLATION TYPE, 2025
FIGURE 26 NORTH AMERICA UNINTERRUPTIBLE POWER SUPPLY (UPS) MARKET: BY PRICE RANGE 2025
FIGURE 27 NORTH AMERICA UNINTERRUPTIBLE POWER SUPPLY (UPS) MARKET: BY ENERGY STORAGE 2025
FIGURE 28 NORTH AMERICA UNINTERRUPTIBLE POWER SUPPLY (UPS) MARKET: BY TOPOLOGY 2025
FIGURE 29 NORTH AMERICA UNINTERRUPTIBLE POWER SUPPLY (UPS) MARKET: BY DESIGN TYPE, 2025
FIGURE 30 NORTH AMERICA UNINTERRUPTIBLE POWER SUPPLY (UPS) MARKET: BY VERTICLE, 2025
FIGURE 31 NORTH AMERICA UNINTERRUPTIBLE POWER SUPPLY (UPS) MARKET: BY SALES CHANNEL, 2025
FIGURE 32 NORTH AMERICA UNINTERRUPTIBLE POWER SUPPLY (UPS) MARKET: SNAPSHOT (2025)
FIGURE 33 NORTH AMERICA UNINTERRUPTIBLE POWER SUPPLY (UPS) MARKET: COMPANY SHARE 2025 (%)
North America Uninterruptible Power Supply Ups Market, Supply Chain Analysis and Ecosystem Framework
To support market growth and help clients navigate the impact of geopolitical shifts, DBMR has integrated in-depth supply chain analysis into its North America Uninterruptible Power Supply Ups Market research reports. This addition empowers clients to respond effectively to global changes affecting their industries. The supply chain analysis section includes detailed insights such as North America Uninterruptible Power Supply Ups Market consumption and production by country, price trend analysis, the impact of tariffs and geopolitical developments, and import and export trends by country and HSN code. It also highlights major suppliers with data on production capacity and company profiles, as well as key importers and exporters. In addition to research, DBMR offers specialized supply chain consulting services backed by over a decade of experience, providing solutions like supplier discovery, supplier risk assessment, price trend analysis, impact evaluation of inflation and trade route changes, and comprehensive market trend analysis.
Data collection and base year analysis are done using data collection modules with large sample sizes. The stage includes obtaining market information or related data through various sources and strategies. It includes examining and planning all the data acquired from the past in advance. It likewise envelops the examination of information inconsistencies seen across different information sources. The market data is analysed and estimated using market statistical and coherent models. Also, market share analysis and key trend analysis are the major success factors in the market report. To know more, please request an analyst call or drop down your inquiry.
The key research methodology used by DBMR research team is data triangulation which involves data mining, analysis of the impact of data variables on the market and primary (industry expert) validation. Data models include Vendor Positioning Grid, Market Time Line Analysis, Market Overview and Guide, Company Positioning Grid, Patent Analysis, Pricing Analysis, Company Market Share Analysis, Standards of Measurement, Global versus Regional and Vendor Share Analysis. To know more about the research methodology, drop in an inquiry to speak to our industry experts.
Data Bridge Market Research is a leader in advanced formative research. We take pride in servicing our existing and new customers with data and analysis that match and suits their goal. The report can be customized to include price trend analysis of target brands understanding the market for additional countries (ask for the list of countries), clinical trial results data, literature review, refurbished market and product base analysis. Market analysis of target competitors can be analyzed from technology-based analysis to market portfolio strategies. We can add as many competitors that you require data about in the format and data style you are looking for. Our team of analysts can also provide you data in crude raw excel files pivot tables (Fact book) or can assist you in creating presentations from the data sets available in the report.


