
North America Unmanned Marine Vehicles Market
Market Size in USD Billion
 USD
2.08 Billion
USD
4.69 Billion
2025
2033
USD
2.08 Billion
USD
4.69 Billion
2025
2033
| 2026 - 2033 | |
| USD 2.08 Billion | |
| USD 4.69 Billion | |
| % | |
|
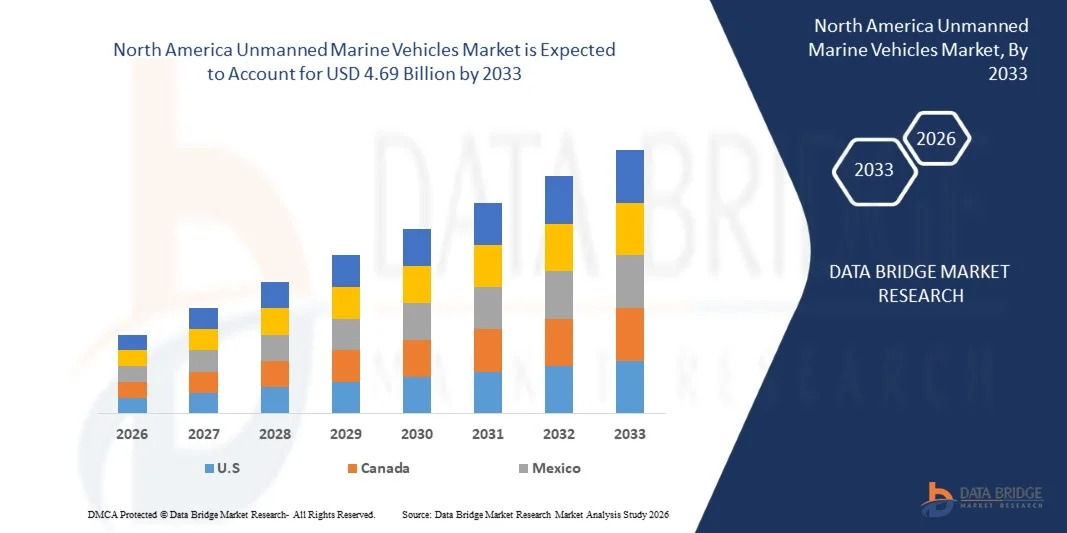
North America Unmanned Marine Vehicles Market Size
- The North America Unmanned Marine Vehicles Market is expected to reach USD 4.69 billion by 2033 from USD 2.08 billion in 2025, growing with a substantial CAGR of 10.8% in the forecast period of 2026 to 2033
- The North America Unmanned Marine Vehicles Market is witnessing robust growth, driven by increasing industrial operations, rising environmental concerns, and heightened emphasis on worker safety across sectors such as manufacturing, construction, mining, and chemical processing. Additionally, the growing population and intensified focus on disaster preparedness and environmental monitoring continue to accelerate the adoption of unmanned marine solutions for inspection, surveillance, and operational efficiency.
- Market growth is further bolstered by supportive government policies, increased funding for maritime infrastructure, and rising demand from industries requiring precision monitoring and autonomous marine operations. Moreover, cost-efficient production capabilities in countries like Indonesia, Vietnam, and Thailand, along with the expanding presence of regional manufacturers, strengthen the Asia-Pacific region’s competitive position in the global market. Continuous innovation in vehicle autonomy, navigation systems, and sensor technology is also sustaining long-term growth prospects across the region.
North America Unmanned Marine Vehicles Market Analysis
- Unmanned marine vehicles are increasingly critical for operations in challenging and high-risk maritime environments, providing autonomous solutions for inspection, monitoring, and data collection across sectors such as offshore energy, shipping, defense, and environmental research. Their advanced navigation and sensor technologies enable safer, more efficient, and sustainable marine operations.
- Expanding industrial activities, rapid urban development, and stricter workplace safety standards across the Asia-Pacific region are fueling strong demand for unmanned marine vehicles. Sectors such as offshore energy, shipping, defense, and environmental monitoring increasingly depend on these autonomous systems for precise, safe, and efficient maritime operations.
- Additionally, growing emphasis on regulatory compliance, environmental monitoring, and operational safety continues to drive market adoption, particularly for advanced unmanned marine vehicles that offer superior navigation, data collection, and endurance capabilities compared to conventional manned systems.
- U.S. is projected to lead the North America Unmanned Marine Vehicles Market in 2025, holding a commanding 77.62%market share. This leadership is driven by robust industrial activity, growing construction projects, and increased adoption of safety measures in factories and high-risk work environments. Supportive government initiatives aimed at enhancing workplace safety and reducing environmental impact further strengthen the region’s dominant position.
- The Remotely Operated Vehicles (ROV) segment is expected to dominate the North America Unmanned Marine Vehicles Market due to its cost-effectiveness, high bandwidth capability over short distances, and increasing deployment in offshore oil & gas operations, subsea construction, marine research, and underwater inspection tasks where real-time control and high-quality video transmission are critical
Report Scope and North America Unmanned Marine Vehicles Market Segmentation
|
Attributes |
North America Unmanned Marine Vehicles Key Market Insights |
|
Segments Covered |
|
|
Countries Covered |
North America
|
|
Key Market Players |
|
|
Market Opportunities |
|
|
Value Added Data Infosets |
In addition to the market insights such as market value, growth rate, market segments, geographical coverage, market players, and market scenario, the market report curated by the Data Bridge Market Research team includes in-depth expert analysis, import/export analysis, pricing analysis, production consumption analysis, and pestle analysis. |
North America Unmanned Marine Vehicles Market Trends
“Growing Adoption of Unmanned Marine Vehicles Across Global Maritime Operations”
- The rapid expansion of maritime, offshore, and naval activities worldwide is a major factor driving the adoption of unmanned marine vehicles (UMVs). As shipping, offshore exploration, and marine research operations scale up, organizations increasingly rely on UMVs for safe, efficient, and cost-effective deployment in hazardous or hard-to-access marine environments.
- UMVs play a critical role in safeguarding human resources and operational continuity. By performing underwater inspections, surveillance, mapping, and maintenance tasks, these vehicles minimize the risks to personnel while ensuring uninterrupted operations across ports, offshore platforms, naval missions, and scientific research expeditions.
- The increasing use of advanced marine operations such as deep-sea exploration, underwater pipeline monitoring, mine detection, and offshore construction has fueled demand for sophisticated UMVs equipped with high-precision sensors, autonomous navigation systems, and robust communication capabilities. These vehicles enhance operational efficiency, safety, and data accuracy in challenging maritime conditions.
- Countries heavily investing in maritime infrastructure, naval modernization, and offshore development—such as the United States, China, and European nations—are driving UMV deployment. Labor-intensive and high-risk marine operations in these regions increasingly depend on unmanned systems to comply with safety regulations, reduce operational costs, and improve mission reliability.
- Overall, the growing scale of global maritime, offshore, and naval operations positions unmanned marine vehicles as an essential component of modern marine strategy. UMVs support personnel safety, operational efficiency, regulatory compliance, and sustainable expansion of maritime and offshore activities worldwide.
North America Unmanned Marine Vehicles Market Dynamics
Driver
“Increasing Defense Modernization & Naval Surveillance Needs”
- Defense forces across the globe are accelerating programs to modernize naval fleets, strengthen coastal security, and enhance maritime domain awareness. Unmanned Marine Vehicles (UMVs), including Unmanned Surface Vehicles (USVs) and Autonomous Underwater Vehicles (AUVs), are now central to these modernization plans due to their ability to conduct long-endurance missions without risking human life. They support a wide range of tactical and strategic applications, such as intelligence gathering, mine detection, anti-submarine warfare, and persistent surveillance of territorial waters. Rising geopolitical tensions and increasing maritime boundary disputes have further intensified the need for systems that offer real-time situational awareness and rapid threat detection.
- UMVs equipped with advanced sonar, radar, and electro-optical sensors enable militaries to perform complex reconnaissance operations with high precision and minimal operational cost. Their ability to remain undetected, operate in denied environments, and execute missions autonomously is pushing governments to allocate significant budgets toward unmanned maritime systems. Strategic naval collaborations, defense alliances, and increasing investments in indigenous defense technologies are further promoting their adoption. As emerging threats evolve, navies seek technologically advanced platforms capable of adapting quickly to dynamic maritime landscapes
For instance,
- In February 2025, , according to the Naval Sea Systems Command article, the U.S. Navy awarded contracts to expand deployment of advanced Mine Countermeasures Unmanned Surface Vehicles (USVs), ensuring these platforms are more capable in naval operations like minehunting and mine neutralization. This award reflects the Navy’s strategic emphasis on unmanned systems that enhance maritime domain awareness, coastal security, and fleet protection — key aspects of defense modernization.
- As of January 11, 2024, article published by the Naval Sea Systems Command states that the U.S. Navy announced the launch of the Vanguard Unmanned Surface Vessel (OUSV3), built from the keel up for autonomous operation. Vanguard reflects the Pentagon’s investment in unmanned maritime technologies to advance autonomous surveillance, reconnaissance, and integrated naval operations — a key modernization milestone.
- On December 18, 2024, press release published in America’s Navy, the U.S. Navy reported successful completion of a 720-hour propulsion test demonstrating that unmanned surface vessels can operate autonomously and continuously for at least 30 days. This milestone highlights defense efforts to validate endurance and resilience of unmanned platforms, enabling persistent surveillance and extended maritime missions.
- According to the article published on May 20, 2024 in NAVALNEWS, the U.S. Pacific Fleet established Unmanned Surface Vessel Squadron Three (USVRON 3) to expand unmanned platform operations with Global Autonomous Reconnaissance Crafts (GARCs). This initiative reflects organizational and capability expansion within naval forces to integrate unmanned systems into defense operations.
- In conclusion, growing emphasis on defense modernization and maritime security will remain one of the strongest drivers for UMV adoption. Their capability to enhance surveillance, reduce operational risk, and improve mission efficiency makes them indispensable for future naval operations. As countries continue to strengthen their maritime defense posture, demand for autonomous marine vehicles is expected to accelerate, ensuring long-term market growth and sustained strategic relevance in global naval ecosystems.
Restraint/Challenge
“High Procurement and Maintenance Costs”
- UMVs incorporate advanced components such as pressure-resistant hulls, high-powered sonar, autonomy modules, and marine-grade materials, making initial procurement costs relatively high. Their specialized manufacturing processes, rigorous testing, and integration of state-of-the-art electronics significantly increase capital expenditure for end users. These costs are often prohibitive for smaller research institutions, academic organizations, and developing economies, creating disparities in global adoption rates.
- Maintenance expenses also contribute heavily to total ownership costs. Regular system upgrades, battery replacements, corrosion management, sensor recalibration, and mission-specific payload maintenance all require specialized facilities and skilled technicians. Operational logistics like launch and retrieval equipment further add to cost burdens. Without substantial budgets or access to shared infrastructure, stakeholders may limit UMV procurement or rely on less capable alternatives.
For instance,
- As per the news article published on Congress.gov in March 2025, The U.S. Congress Research Service (CRS) report on Large Unmanned Surface and Undersea Vehicles (LUSV/LDUUV) highlights concerns about cost escalation and affordability of unmanned maritime systems. Senior Navy leadership has questioned the “exquisite, expensive” designs of current USV fleets, emphasizing a need to simplify and reduce procurement costs so that mass production becomes feasible underscoring how high unit costs are a barrier to large-scale deployment.
- In September 2025, as per the press releases by SAAB AB, the National Oceanic and Atmospheric Administration (NOAA) awarded Saab a contract worth ~USD 1.7 million for development of a long-range autonomous underwater vehicle (AUV). While this is a smaller research contract, it demonstrates that even government science programs must allocate significant funds for procurement of specialized UMVs due to advanced sensor integration and robust design requirements — reflecting how capital costs for even modest UMV deployments remain high.
- In conclusion, high procurement and lifecycle maintenance costs remain critical barriers to widespread UMV adoption. While technological advancements continue to improve performance, affordability challenges slow market penetration—particularly in cost-sensitive sectors. Reducing manufacturing expenses and expanding leasing or service-based models will be essential for enabling broader global usage.
North America Unmanned Marine Vehicles Market Scope
The North America Unmanned Marine Vehicles Market is segmented into seven notable segments based on the vehicle type, system component, propulsion, application, end user, distribution channel and operation.
By Vehicle type
On the basis of Vehicle type, the North America Unmanned Marine Vehicles Market is segmented into autonomous underwater vehicles (AUV), remotely operated vehicles (ROV), surface unmanned marine vehicles (USV), autonomous surface vehicles (ASV), hybrid systems and others. In 2026 the Remotely Operated Vehicles (ROV) segment is expected to dominate the North America Unmanned Marine Vehicles Market with The Market Share of 36.97% due to its cost-effectiveness, high bandwidth capability over short distances, and increasing deployment in offshore oil & gas operations, subsea construction, marine research, and underwater inspection tasks where real-time control and high-quality video transmission are critical.
The Remotely Operated Vehicles (ROV) segment is projected to register a CAGR of 9.7%, driven by stricter industrial safety regulations, escalating environmental pollution, expanding construction and manufacturing operations, and continued demand for advanced respiratory protection in emerging Asia-Pacific markets.
By System Component
On the basis of System component, the North America Unmanned Marine Vehicles Market is segmented into sensors & payloads, control systems, launch & recovery systems and others. In 2026 Sensors & Payloads is expected to dominate the North America Unmanned Marine Vehicles Market with The Market Share of 34.48% due to rapid advancements in marine sensing technologies, increasing need for high-resolution seabed mapping, growth in naval ISR missions, and rising use of multi-mission sonar and camera systems for oceanographic, environmental, and commercial underwater operations.
The System Component segment is projected to grow at a CAGR of 11.2%, supported by ongoing technological advancements, widespread adoption by key manufacturers, benefits from regulatory compliance, and sustained demand across industrial and healthcare applications.
By Propulsion
On the basis of Propulsion, the North America Unmanned Marine Vehicles Market is segmented into diesel engine systems, electric drive systems, battery modules and fuel cell systems. In 2026, the Diesel engine systems segment is anticipated to dominate the North America Unmanned Marine Vehicles Market with The Market Share of 35.29% due to its superior endurance, high power output, operational reliability in long-distance missions, and widespread adoption in large AUVs and USVs requiring extended operational ranges for defense patrols, offshore surveys, and deep-water exploration.
The Diesel Engine Systems segment is projected to grow at a CAGR of 10.9%, driven by heightened awareness of occupational respiratory risks, escalating exposure to environmental pollution, and the implementation of stricter workplace health and safety regulations across the Asia-Pacific region.
By Application
On the basis of Application, the North America Unmanned Marine Vehicles Market is segmented into defense & security, oil & gas exploration, oceanographic survey, search & rescue, underwater inspection & maintenance, scientific research, commercial shipping and others. In 2026 the Defense & Security segment is anticipated to dominate the North America Unmanned Marine Vehicles Market with The Market Share of 44.56% due to surging demand for naval modernization, increased focus on mine countermeasures, anti-submarine warfare, maritime surveillance, and the growing need for unmanned systems capable of enhancing situational awareness and reducing human risk in hostile marine environments.
The Defense & Security segment is projected to grow at a CAGR of 11.1%, driven by rapid industrialization, ongoing infrastructure development, stricter enforcement of occupational safety standards, and rising adoption of personal protective equipment (PPE) across developing Asia-Pacific economies.
By End user
On the basis of End user, the North America Unmanned Marine Vehicles Market is segmented into navy, coast guard, research institutes, oil & gas industry, environmental agencies, maritime security organizations, port authorities, salvage & rescue operations and others. In 2026, the Navy segment is anticipated to dominate the North America Unmanned Marine Vehicles Market with The Market Share of 42.17% due to the rising adoption of unmanned platforms for ISR missions, increased investments in autonomous maritime capabilities, and the need for cost-effective solutions for persistent surveillance, underwater threat detection, and extended-range operations.
The Navy segment is projected to grow at a CAGR of 10.8%, driven by a rising preference for long-term supply agreements, optimized logistics, lower intermediary expenses, and increasing demand from large-scale industrial and institutional clients.
By Distribution channel
On the basis of Distribution channel, the North America Unmanned Marine Vehicles Market is segmented into direct sales, Distributors, online platforms and system integrators. In 2026 the Direct Sales segment is anticipated to dominate the North America Unmanned Marine Vehicles Market with The Market Share of 48.30% due to large-scale procurement programs by defense forces, oil & gas companies, and research organizations that prefer direct manufacturer agreements for customized UMV configurations, long-term service contracts, and greater control over mission-specific system integration.
The Direct Sales segment is expected to grow at a CAGR of 11.0%, supported by increasing preference for long-term supply contracts, streamlined logistics, reduced intermediary costs, and growing demand from large-scale industrial and institutional buyers
By Operation
On the basis of operation, the North America Unmanned Marine Vehicles Market is segmented into autonomous and remote controlled. In 2026 the Remote Controlled segment is anticipated to dominate the North America Unmanned Marine Vehicles Market with The Market Share of 57.19% due to the continued preference for operator-guided missions in subsea inspection, repair, rescue operations, and offshore industrial tasks where real-time maneuverability, precision handling, and immediate human decision-making are essential.
The Remote Controlled segment is expected to grow at a CAGR of 10.6%, fueled by increasing preference for long-term supply agreements, streamlined logistics, reduced intermediary costs, and rising demand from large-scale industrial and institutional buyers.
North America Unmanned Marine Vehicles Market Regional Analysis
- U.S. represents a significant growth market for unmanned marine vehicles, supported by its expansive maritime geography, increasing offshore activities, and sustained investments in port development and naval modernization. The country’s extensive coastline, busy sea lanes, and growing focus on maritime security and offshore monitoring continue to drive steady demand for UMVs across defense, hydrographic surveying, and offshore infrastructure inspection applications.
- Canada is witnessing rising adoption of unmanned marine vehicles as it accelerates development across shipbuilding, offshore energy, and maritime surveillance operations. Expanding port infrastructure, increased emphasis on coastal monitoring, and growing participation in regional maritime trade are encouraging the use of UMVs to enhance operational efficiency, safety, and data accuracy in complex marine environments.
- Mexico growing focus on maritime logistics, offshore resource management, and naval capability enhancement is further supporting UMV demand. Ongoing investments in port expansion, coastal infrastructure, and maritime security initiatives are increasing the need for unmanned systems capable of conducting surveillance, inspection, and monitoring tasks, positioning UMVs as critical enablers of safe and modern maritime operation s
U.S. North America Unmanned Marine Vehicles Market Insight
U.S. North America Unmanned Marine Vehicles Market is experiencing strong growth, supported by increasing maritime activity, expanding offshore operations, and sustained investments in port infrastructure and naval capability development. Heightened focus on maritime security, offshore asset monitoring, and hydrographic surveying—combined with Indonesia’s extensive coastline and strategic sea lanes—is driving consistent demand for UMVs across defense, offshore energy, and marine research applications, positioning the country as a key market within the North America region.
Canada North America Unmanned Marine Vehicles Market Insight
Canada North America Unmanned Marine Vehicles Market is expanding steadily, driven by rapid development in shipbuilding, offshore energy, and maritime logistics sectors. Growing emphasis on coastal surveillance, underwater inspection, and port modernization—alongside increasing adoption of advanced maritime technologies—is boosting demand for UMVs. The country’s strong orientation toward maritime trade and export-driven growth further reinforces the need for reliable unmanned systems to support safe, efficient, and data-driven marine operations.
North America Unmanned Marine Vehicles Market Share
The unmanned marine vehicles industry is primarily led by well-established companies, including:
- L3Harris Technologies, Inc. (U.S)
- Kongsberg Discovery (Norway)
- Oceaneering International, Inc. (U.S)
- Subsea 7 (Luxembourg)
- BAE Systems (U Kingdom)
- Thales Group (France)
- Fugro (Netherlands)
- Elbit Systems (Israel)
- QinetiQ (U.K.)
- Saab AB (Sweden)
- Teledyne Marine Technologies Incorporated (U.S)
- Edge Autonomy Operations, LLC (U.S)
- Liquid Robotics (A Boeing Company) (U.S)
- Rovco Ltd. (U.K.)
- Bluefin Robotics (U.S)
- Sea Robotics Corporation (U.S)
- Cellula Robotics Ltd (U.K.)
- Chance Maritime Technologies (U.S)
- Deep Ocean Engineering, Inc. (U.S)
- Sea Machines Robotics, Inc. (U.S)
Latest Developments in the North America Unmanned Marine Vehicles Market
- In May 2022, leading marine technology providers expanded their unmanned marine vehicle portfolios by introducing next-generation autonomous and remotely operated platforms designed to support offshore inspection, seabed mapping, and maritime surveillance missions. These launches strengthened suppliers’ capabilities to serve defense, offshore energy, and research applications across Asia-Pacific.
- In October 2025, regional maritime security assessments highlighted rising surveillance requirements across major shipping corridors in the Indo-Pacific, prompting increased deployment of unmanned surface and underwater vehicles for continuous monitoring, threat detection, and situational awareness in high-traffic maritime zones.
- In November 2023, an environmental and maritime infrastructure analysis by an international research organization emphasized that coastal nations in Southeast Asia—such as Indonesia, Thailand, and Vietnam—are increasingly relying on unmanned marine vehicles during periods of heightened maritime congestion and environmental stress to support coastal monitoring, pollution assessment, and underwater inspection activities.
- In November 2024, a regional maritime authority released updated technical guidance for offshore infrastructure inspection and subsea operations, recommending the use of autonomous and remotely operated marine systems to reduce human exposure in hazardous underwater environments, thereby creating opportunities for advanced UMVs in offshore energy and port maintenance applications.
- In March 2025, maritime safety agencies in Australia published revised operational guidelines encouraging the use of unmanned marine vehicles for post-disaster coastal assessment and underwater inspection following cyclones and extreme weather events, reinforcing the role of UMVs in emergency response, environmental assessment, and recovery operations
SKU-

- Interactive Data Analysis Dashboard
- Company Analysis Dashboard for high growth potential opportunities
- Research Analyst Access for customization & queries
- Competitor Analysis with Interactive dashboard
- Latest News, Updates & Trend analysis
- Harness the Power of Benchmark Analysis for Comprehensive Competitor Tracking
Table of Content
1 INTRODUCTION
1.1 OBJECTIVES OF THE STUDY
1.2 MARKET DEFINITION
1.3 OVERVIEW OF NORTH AMERICA UNMANNED MARINE VEHICLES MARKET
1.4 CURRENCY AND PRICING
1.5 LIMITATIONS
1.6 MARKETS COVERED
2 MARKET SEGMENTATION
2.1 MARKETS COVERED
2.2 GEOGRAPHICAL SCOPE
2.3 YEARS CONSIDERED FOR THE STUDY
2.4 DBMR TRIPOD DATA VALIDATION MODEL
2.5 PRIMARY INTERVIEWS WITH KEY OPINION LEADERS
2.6 DBMR MARKET POSITION GRID
2.7 VENDOR SHARE ANALYSIS
2.8 MULTIVARIATE MODELING
2.9 VEHICLE TYPE TIMELINE CURVE
2.1 MARKET END-USER COVERAGE GRID
2.11 SECONDARY SOURCES
2.12 ASSUMPTIONS
3 EXECUTIVE SUMMARY
4 PREMIUM INSIGHTS
4.1 PESTEL ANALYSIS
4.1.1 POLITICAL FACTORS
4.1.2 ECONOMIC FACTORS
4.1.3 SOCIAL FACTORS
4.1.4 TECHNOLOGICAL FACTORS
4.1.5 ENVIRONMENTAL FACTORS
4.1.6 LEGAL FACTORS
4.2 PORTER’S FIVE FORCES ANALYSIS
4.2.1 THREAT OF NEW ENTRANTS
4.2.2 BARGAINING POWER OF SUPPLIERS
4.2.3 BARGAINING POWER OF BUYERS
4.2.4 THREAT OF SUBSTITUTE PRODUCTS
4.2.5 INDUSTRY RIVALRY
4.3 CASE STUDY ANALYSIS
4.3.1 CASE STUDY 1: KONGSBERG MARITIME & THE DEEP-OCEAN RESEARCH CONSORTIUM
4.3.2 CASE STUDY 2: L3HARRIS & THE COASTAL BORDER SURVEILLANCE AUTHORITY
4.3.3 CASE STUDY 3: TELEDYNE MARINE & THE OFFSHORE ENERGY INFRASTRUCTURE OPERATOR
4.3.4 CASE STUDY 4: SAAB & THE NAVAL ANTI-SUBMARINE WARFARE (ASW) TRAINING PROGRAM
4.3.5 CASE STUDY 5: OCEAN INFINITY & THE FLEET-BASED AUTONOMOUS SURVEY MODEL
4.3.6 CONCLUSION
4.4 SUPPLY CHAIN ANALYSIS
4.4.1 OVERVIEW
4.4.2 RAW MATERIALS
4.4.3 MANUFACTURING, INTEGRATION & TESTING
4.4.4 DISTRIBUTION & LOGISTICS
4.4.5 END USERS
4.5 IMPORT EXPORT SCENARIO
4.6 REGIONAL GROWTH OPPORTUNITIES IN THE NORTH AMERICA UNMANNED MARINE VEHICLES MARKET
4.6.1 NORTH AMERICA: OPPORTUNITY SHAPED BY MARITIME MODERNIZATION AND ADVANCED OCEAN RESEARCH
4.6.2 EUROPE: OPPORTUNITY DRIVEN BY SUSTAINABILITY, BLUE-ECONOMY STRATEGIES, AND JOINT MARITIME SECURITY EFFORTS
4.7 ASIA-PACIFIC: OPPORTUNITY FUELED BY MARITIME SURVEILLANCE NEEDS AND OFFSHORE ENERGY EXPANSION
4.7.1 MIDDLE EAST & AFRICA: OPPORTUNITY EMERGING FROM COASTAL SECURITY, PORT EXPANSION, AND MARINE ECOLOGY MONITORING
4.7.2 SOUTH AMERICA: OPPORTUNITY INFLUENCED BY FISHERIES CONTROL, OFFSHORE OIL DEVELOPMENT, AND MARINE RESEARCH
4.8 KEY STRATEGIC INITIATIVES BY OEMS IN THE NORTH AMERICA UNMANNED MARINE VEHICLES MARKET
4.8.1 ADVANCEMENT OF AUTONOMY AND INTELLIGENT NAVIGATION SYSTEMS
4.8.2 COLLABORATIVE DEVELOPMENT AND CROSS-SECTOR PARTNERSHIPS
4.8.3 MODULAR AND SCALABLE DESIGN PHILOSOPHY
4.8.4 EMPHASIS ON SUSTAINABLE MARINE TECHNOLOGY AND LOW-EMISSION OPERATIONS
4.8.5 STRENGTHENING OF AFTER-SALES SUPPORT AND INTEGRATED SERVICE ECOSYSTEMS
4.9 PATENT ANALYSIS – NORTH AMERICA UNMANNED MARINE VEHICLES MARKET
4.9.1 EVOLVING PATENT TRENDS IN THE UMV SPACE
4.9.2 CORE TECHNOLOGICAL THEMES REFLECTED IN PATENT FILINGS
4.9.3 REPRESENTATIVE PATENTS AND THEIR STRATEGIC MARKET IMPLICATIONS
4.9.4 GEOGRAPHIC AND INSTITUTIONAL PATENT STRENGTH
4.9.5 LONG-TERM STRATEGIC INTERPRETATION FOR MARKET STAKEHOLDERS
4.1 BRAND COMPARISON
4.11 COMPANY VS BRAND OVERVIEW — UNMANNED MARINE VEHICLES
4.12 CONSUMER BUYING BEHAVIOR IN THE NORTH AMERICA UNMANNED MARINE VEHICLES MARKET
4.12.1 TECHNOLOGICAL SOPHISTICATION
4.12.2 OPERATIONAL EFFICIENCY AND COST-EFFECTIVENESS
4.12.3 BRAND REPUTATION AND TRUST
4.12.4 VERSATILITY AND CUSTOMIZATION
4.12.5 AFTER-SALES SUPPORT AND REGULATORY COMPLIANCE
4.13 COMPANY COMPARATIVE ANALYSIS
5 TARIFFS & IMPACT ON THE NORTH AMERICA UNMANNED MARINE VEHICLES MARKET
5.1 TARIFF IMPACT ON MANUFACTURING AND EXPORT
6 REGULATORY STANDARDS OF NORTH AMERICA UNMANNED MARINE VEHICLES MARKET.
7 MARKET OVERVIEW
7.1 DRIVERS
7.1.1 INCREASING DEFENSE MODERNIZATION & NAVAL SURVEILLANCE NEEDS
7.1.2 GROWING OFFSHORE OIL, GAS, AND RENEWABLE ENERGY EXPLORATION
7.1.3 RISING DEMAND FOR OCEANOGRAPHIC AND ENVIRONMENTAL MONITORING
7.1.4 ADVANCEMENTS IN AUTONOMY, AI, AND SENSOR FUSION TECHNOLOGIES
7.2 RESTRAINTS
7.2.1 HIGH PROCUREMENT AND MAINTENANCE COSTS
7.2.2 COMMUNICATION AND CONTROL LIMITATIONS IN DEEP-SEA ENVIRONMENTS
7.3 OPPORTUNITIES
7.3.1 INTEGRATION WITH SMART PORTS AND DIGITAL MARITIME ECOSYSTEMS
7.3.2 GROWING COMMERCIAL APPLICATIONS BEYOND DEFENSE
7.4 CHALLENGES
7.4.1 NAVIGATIONAL SAFETY AND COLLISION AVOIDANCE IN MIXED TRAFFIC
7.4.2 HARSH OCEAN CONDITIONS AFFECTING RELIABILITY AND ENDURANCE
8 NORTH AMERICA UNMANNED MARINE VEHICLES MARKET, BY VEHICLE TYPE,
8.1.1 REMOTELY OPERATED VEHICLES (ROV)
8.1.2 AUTONOMOUS UNDERWATER VEHICLES (AUV)
8.1.3 SURFACE UNMANNED MARINE VEHICLES (USV)
8.1.4 AUTONOMOUS SURFACE VEHICLES (ASV)
8.1.5 HYBRID SYSTEMS
8.1.6 OTHERS
8.2 NORTH AMERICA REMOTELY OPERATED VEHICLES (ROV) IN UNMANNED MARINE VEHICLES MARKET, BY REGION, 2018-2033 (USD THOUSAND)
8.2.1 NORTH AMERICA
8.2.2 EUROPE
8.2.3 ASIA-PACIFIC
8.2.4 SOUTH AMERICA
8.2.5 MIDDLE EAST AND AFRICA
8.3 NORTH AMERICA REMOTELY OPERATED VEHICLES (ROV) IN UNMANNED MARINE VEHICLES MARKET, BY DEPTH RATING, 2018-2033 (USD THOUSAND)
8.3.1 SHALLOW WATER ROV
8.3.2 DEEP-WATER ROV
8.3.3 MID-WATER ROV
8.4 NORTH AMERICA REMOTELY OPERATED VEHICLES (ROV) IN UNMANNED MARINE VEHICLES MARKET, BY TASK TYPE, 2018-2033 (USD THOUSAND)
8.4.1 WORK-CLASS
8.4.2 OBSERVATION-CLASS
8.5 NORTH AMERICA AUTONOMOUS UNDERWATER VEHICLES (AUV) IN UNMANNED MARINE VEHICLES MARKET, BY REGION, 2018-2033 (USD THOUSAND)
8.5.1 NORTH AMERICA
8.5.2 EUROPE
8.5.3 ASIA-PACIFIC
8.5.4 SOUTH AMERICA
8.5.5 MIDDLE EAST AND AFRICA
8.6 NORTH AMERICA AUTONOMOUS UNDERWATER VEHICLES (AUV) IN UNMANNED MARINE VEHICLES MARKET, BY CONFIGURATION, 2018-2033 (USD THOUSAND)
8.6.1 MAN-PORTABLE
8.6.2 LIGHT-WEIGHT
8.6.3 HEAVY-WEIGHT
8.6.4 LARGE
8.6.5 ELECTRIC
8.6.6 DIESEL
8.6.7 HYBRID
8.7 NORTH AMERICA SURFACE UNMANNED MARINE VEHICLES (USV) IN UNMANNED MARINE VEHICLES MARKET, BY REGION, 2018-2033 (USD THOUSAND)
8.7.1 NORTH AMERICA
8.7.2 EUROPE
8.7.3 ASIA-PACIFIC
8.7.4 SOUTH AMERICA
8.7.5 MIDDLE EAST AND AFRICA
8.8 NORTH AMERICA SURFACE UNMANNED MARINE VEHICLES (USV) IN UNMANNED MARINE VEHICLES MARKET, BY OPERATION, 2018-2033 (USD THOUSAND)
8.8.1 REMOTE CONTROLLED
8.8.2 AUTONOMOUS
8.9 NORTH AMERICA SURFACE UNMANNED MARINE VEHICLES (USV) IN UNMANNED MARINE VEHICLES MARKET, BY HULL TYPE, 2018-2033 (USD THOUSAND)
8.9.1 MONOHULL
8.9.2 MULTIHULL (CATAMARAN/TRIMARAN)
8.1 NORTH AMERICA AUTONOMOUS SURFACE VEHICLES (ASV) IN UNMANNED MARINE VEHICLES MARKET, BY REGION, 2018-2033 (USD THOUSAND)
8.10.1 NORTH AMERICA
8.10.2 EUROPE
8.10.3 ASIA-PACIFIC
8.10.4 SOUTH AMERICA
8.10.5 MIDDLE EAST AND AFRICA
8.11 NORTH AMERICA AUTONOMOUS SURFACE VEHICLES (ASV) IN UNMANNED MARINE VEHICLES MARKET, BY APPLICATION, 2018-2033 (USD THOUSAND)
8.11.1 HYDROGRAPHIC SURVEY
8.11.2 INTELLIGENCE, SURVEILLANCE & RECONNAISSANCE (ISR)
8.11.3 ENVIRONMENTAL MONITORING
8.11.4 ANTI-SUBMARINE WARFARE (ASW)
8.12 NORTH AMERICA HYBRID SYSTEMS IN UNMANNED MARINE VEHICLES MARKET, BY REGION, 2018-2033 (USD THOUSAND)
8.12.1 NORTH AMERICA
8.12.2 EUROPE
8.12.3 ASIA-PACIFIC
8.12.4 SOUTH AMERICA
8.12.5 MIDDLE EAST AND AFRICA
8.13 NORTH AMERICA OTHERS IN UNMANNED MARINE VEHICLES MARKET, BY REGION, 2018-2033 (USD THOUSAND)
8.13.1 NORTH AMERICA
8.13.2 EUROPE
8.13.3 ASIA-PACIFIC
8.13.4 SOUTH AMERICA
8.13.5 MIDDLE EAST AND AFRICA
9 NORTH AMERICA UNMANNED MARINE VEHICLES MARKET, BY SYSTEM COMPONENT, 2018-2033 (USD THOUSAND)
9.1 OVERVIEW
9.1.1 SENSORS & PAYLOADS
9.1.2 CONTROL SYSTEMS
9.1.3 LAUNCH & RECOVERY SYSTEMS
9.1.4 OTHERS
9.2 NORTH AMERICA SENSORS & PAYLOADS IN UNMANNED MARINE VEHICLES MARKET, BY REGION, 2018-2033 (USD THOUSAND)
9.2.1 NORTH AMERICA
9.2.2 EUROPE
9.2.3 ASIA-PACIFIC
9.2.4 SOUTH AMERICA
9.2.5 MIDDLE EAST AND AFRICA
9.3 NORTH AMERICA SENSORS & PAYLOADS IN UNMANNED MARINE VEHICLES MARKET, BY TYPE, 2018-2033 (USD THOUSAND)
9.3.1 SONAR SYSTEMS
9.3.2 COMMUNICATION SYSTEMS
9.3.3 CAMERA SYSTEMS
9.3.4 GPS & NAVIGATION MODULES
9.4 NORTH AMERICA SONAR SYSTEMS IN UNMANNED MARINE VEHICLES MARKET, BY TYPE, 2018-2033 (USD THOUSAND)
9.4.1 MULTIBEAM SONAR
9.4.2 SIDE-SCAN SONAR
9.4.3 1.21.4 SUB-BOTTOM PROFILERS
9.5 NORTH AMERICA CONTROL SYSTEMS IN UNMANNED MARINE VEHICLES MARKET, BY REGION, 2018-2033 (USD THOUSAND)
9.5.1 NORTH AMERICA
9.5.2 EUROPE
9.5.3 ASIA-PACIFIC
9.5.4 SOUTH AMERICA
9.5.5 MIDDLE EAST AND AFRICA
9.6 NORTH AMERICA CONTROL SYSTEMS IN UNMANNED MARINE VEHICLES MARKET, BY TYPE, 2018-2033 (USD THOUSAND)
9.6.1 REMOTE CONTROL MODULES
9.6.2 AUTONOMOUS CONTROL SOFTWARE
9.7 NORTH AMERICA LAUNCH & RECOVERY SYSTEMS IN UNMANNED MARINE VEHICLES MARKET, BY REGION, 2018-2033 (USD THOUSAND)
9.7.1 NORTH AMERICA
9.7.2 EUROPE
9.7.3 ASIA-PACIFIC
9.7.4 SOUTH AMERICA
9.7.5 MIDDLE EAST AND AFRICA
9.8 NORTH AMERICA OTHERS IN UNMANNED MARINE VEHICLES MARKET, BY REGION, 2018-2033 (USD THOUSAND)
9.8.1 NORTH AMERICA
9.8.2 EUROPE
9.8.3 ASIA-PACIFIC
9.8.4 SOUTH AMERICA
9.8.5 MIDDLE EAST AND AFRICA
10 NORTH AMERICA UNMANNED MARINE VEHICLES MARKET, BY PROPULSION, 2018-2033 (USD THOUSAND)
10.1 OVERVIEW
10.1.1 DIESEL ENGINE SYSTEMS
10.1.2 ELECTRIC DRIVE SYSTEMS
10.1.3 BATTERY MODULES
10.1.4 FUEL CELL SYSTEMS
10.2 NORTH AMERICA DIESEL ENGINE SYSTEMS IN UNMANNED MARINE VEHICLES MARKET, BY REGION, 2018-2033 (USD THOUSAND)
10.2.1 NORTH AMERICA
10.2.2 EUROPE
10.2.3 ASIA-PACIFIC
10.2.4 SOUTH AMERICA
10.2.5 MIDDLE EAST AND AFRICA
10.3 NORTH AMERICA ELECTRIC DRIVE SYSTEMS IN UNMANNED MARINE VEHICLES MARKET, BY REGION, 2018-2033 (USD THOUSAND)
10.3.1 NORTH AMERICA
10.3.2 EUROPE
10.3.3 ASIA-PACIFIC
10.3.4 SOUTH AMERICA
10.3.5 MIDDLE EAST AND AFRICA
10.4 NORTH AMERICA BATTERY MODULES IN UNMANNED MARINE VEHICLES MARKET, BY REGION, 2018-2033 (USD THOUSAND)
10.4.1 NORTH AMERICA
10.4.2 EUROPE
10.4.3 ASIA-PACIFIC
10.4.4 SOUTH AMERICA
10.4.5 MIDDLE EAST AND AFRICA
10.5 NORTH AMERICA FUEL CELL SYSTEMS IN UNMANNED MARINE VEHICLES MARKET, BY REGION, 2018-2033 (USD THOUSAND)
10.5.1 NORTH AMERICA
10.5.2 EUROPE
10.5.3 ASIA-PACIFIC
10.5.4 SOUTH AMERICA
10.5.5 MIDDLE EAST AND AFRICA
11 NORTH AMERICA UNMANNED MARINE VEHICLES MARKET, BY APPLICATION, 2018-2033 (USD THOUSAND)
11.1 OVERVIEW
11.1.1 DEFENSE & SECURITY
11.1.2 OIL & GAS EXPLORATION
11.1.3 UNDERWATER INSPECTION & MAINTENANCE
11.1.4 OCEANOGRAPHIC SURVEY
11.1.5 SCIENTIFIC RESEARCH
11.1.6 COMMERCIAL SHIPPING
11.1.7 SEARCH & RESCUE
11.1.8 OTHERS
11.2 NORTH AMERICA DEFENSE & SECURITY IN UNMANNED MARINE VEHICLES MARKET, BY REGION, 2018-2033 (USD THOUSAND)
11.2.1 NORTH AMERICA
11.2.2 EUROPE
11.2.3 ASIA-PACIFIC
11.2.4 SOUTH AMERICA
11.2.5 MIDDLE EAST AND AFRICA
11.3 NORTH AMERICA DEFENSE & SECURITY IN UNMANNED MARINE VEHICLES MARKET, BY TYPE, 2018-2033 (USD THOUSAND)
11.3.1 INTELLIGENCE, SURVEILLANCE & RECONNAISSANCE
11.3.2 MINE COUNTERMEASURES
11.3.3 ANTI-SUBMARINE WARFARE
11.3.4 MARITIME PATROL
11.4 NORTH AMERICA OIL & GAS EXPLORATION IN UNMANNED MARINE VEHICLES MARKET, BY REGION, 2018-2033 (USD THOUSAND)
11.4.1 NORTH AMERICA
11.4.2 EUROPE
11.4.3 ASIA-PACIFIC
11.4.4 SOUTH AMERICA
11.4.5 MIDDLE EAST AND AFRICA
11.5 NORTH AMERICA OIL & GAS EXPLORATION IN UNMANNED MARINE VEHICLES MARKET, BY TYPE, 2018-2033 (USD THOUSAND)
11.5.1 PIPELINE INSPECTION
11.5.2 OFFSHORE RIG MONITORING
11.6 NORTH AMERICA UNDERWATER INSPECTION & MAINTENANCE IN UNMANNED MARINE VEHICLES MARKET, BY REGION, 2018-2033 (USD THOUSAND)
11.6.1 NORTH AMERICA
11.6.2 EUROPE
11.6.3 ASIA-PACIFIC
11.6.4 SOUTH AMERICA
11.6.5 MIDDLE EAST AND AFRICA
11.7 NORTH AMERICA OCEANOGRAPHIC SURVEY IN UNMANNED MARINE VEHICLES MARKET, BY REGION, 2018-2033 (USD THOUSAND)
11.7.1 NORTH AMERICA
11.7.2 EUROPE
11.7.3 ASIA-PACIFIC
11.7.4 SOUTH AMERICA
11.7.5 MIDDLE EAST AND AFRICA
11.8 NORTH AMERICA OCEANOGRAPHIC SURVEY IN UNMANNED MARINE VEHICLES MARKET, BY TYPE, 2018-2033 (USD THOUSAND)
11.8.1 HYDROGRAPHIC MAPPING
11.8.2 ENVIRONMENTAL MONITORING
11.9 NORTH AMERICA SCIENTIFIC RESEARCH IN UNMANNED MARINE VEHICLES MARKET, BY REGION, 2018-2033 (USD THOUSAND)
11.9.1 NORTH AMERICA
11.9.2 EUROPE
11.9.3 ASIA-PACIFIC
11.9.4 SOUTH AMERICA
11.9.5 MIDDLE EAST AND AFRICA
11.1 NORTH AMERICA COMMERCIAL SHIPPING IN UNMANNED MARINE VEHICLES MARKET, BY REGION, 2018-2033 (USD THOUSAND)
11.10.1 NORTH AMERICA
11.10.2 EUROPE
11.10.3 ASIA-PACIFIC
11.10.4 SOUTH AMERICA
11.10.5 MIDDLE EAST AND AFRICA
11.11 NORTH AMERICA SEARCH & RESCUE IN UNMANNED MARINE VEHICLES MARKET, BY REGION, 2018-2033 (USD THOUSAND)
11.11.1 NORTH AMERICA
11.11.2 EUROPE
11.11.3 ASIA-PACIFIC
11.11.4 SOUTH AMERICA
11.11.5 MIDDLE EAST AND AFRICA
11.12 NORTH AMERICA OTHERS IN UNMANNED MARINE VEHICLES MARKET, BY REGION, 2018-2033 (USD THOUSAND)
11.12.1 NORTH AMERICA
11.12.2 EUROPE
11.12.3 ASIA-PACIFIC
11.12.4 SOUTH AMERICA
11.12.5 MIDDLE EAST AND AFRICA
12 NORTH AMERICA UNMANNED MARINE VEHICLES MARKET, BY END USER, 2018-2033 (USD THOUSAND)
12.1 OVERVIEW
12.1.1 NAVY
12.1.2 OIL & GAS INDUSTRY
12.1.3 RESEARCH INSTITUTES
12.1.4 MARITIME SECURITY ORGANIZATIONS (NON-NAVY, NON-COAST-GUARD SECURITY AGENCIES)
12.1.5 COAST GUARD
12.1.6 ENVIRONMENTAL AGENCIES
12.1.7 PORT AUTHORITIES
12.1.8 SALVAGE & RESCUE OPERATIONS
12.1.9 OTHERS
12.2 NORTH AMERICA NAVY IN UNMANNED MARINE VEHICLES MARKET, BY REGION, 2018-2033 (USD THOUSAND)
12.2.1 NORTH AMERICA
12.2.2 EUROPE
12.2.3 ASIA-PACIFIC
12.2.4 SOUTH AMERICA
12.2.5 MIDDLE EAST AND AFRICA
12.3 NORTH AMERICA OIL & GAS INDUSTRY IN UNMANNED MARINE VEHICLES MARKET, BY REGION, 2018-2033 (USD THOUSAND)
12.3.1 NORTH AMERICA
12.3.2 EUROPE
12.3.3 ASIA-PACIFIC
12.3.4 SOUTH AMERICA
12.3.5 MIDDLE EAST AND AFRICA
12.4 NORTH AMERICA RESEARCH INSTITUTES IN UNMANNED MARINE VEHICLES MARKET, BY REGION, 2018-2033 (USD THOUSAND)
12.4.1 NORTH AMERICA
12.4.2 EUROPE
12.4.3 ASIA-PACIFIC
12.4.4 SOUTH AMERICA
12.4.5 MIDDLE EAST AND AFRICA
12.5 NORTH AMERICA MARITIME SECURITY ORGANIZATIONS (NON-NAVY, NON-COAST-GUARD SECURITY AGENCIES) IN UNMANNED MARINE VEHICLES MARKET, BY REGION, 2018-2033 (USD THOUSAND)
12.5.1 NORTH AMERICA
12.5.2 EUROPE
12.5.3 ASIA-PACIFIC
12.5.4 SOUTH AMERICA
12.5.5 MIDDLE EAST AND AFRICA
12.6 NORTH AMERICA COAST GUARD IN UNMANNED MARINE VEHICLES MARKET, BY REGION, 2018-2033 (USD THOUSAND)
12.6.1 NORTH AMERICA
12.6.2 EUROPE
12.6.3 ASIA-PACIFIC
12.6.4 SOUTH AMERICA
12.6.5 MIDDLE EAST AND AFRICA
12.7 NORTH AMERICA ENVIRONMENTAL AGENCIES IN UNMANNED MARINE VEHICLES MARKET, BY REGION, 2018-2033 (USD THOUSAND)
12.7.1 NORTH AMERICA
12.7.2 EUROPE
12.7.3 ASIA-PACIFIC
12.7.4 SOUTH AMERICA
12.7.5 MIDDLE EAST AND AFRICA
12.8 NORTH AMERICA PORT AUTHORITIES IN UNMANNED MARINE VEHICLES MARKET, BY REGION, 2018-2033 (USD THOUSAND)
12.8.1 NORTH AMERICA
12.8.2 EUROPE
12.8.3 ASIA-PACIFIC
12.8.4 SOUTH AMERICA
12.8.5 MIDDLE EAST AND AFRICA
12.9 NORTH AMERICA SALVAGE & RESCUE OPERATIONS IN UNMANNED MARINE VEHICLES MARKET, BY REGION, 2018-2033 (USD THOUSAND)
12.9.1 NORTH AMERICA
12.9.2 EUROPE
12.9.3 ASIA-PACIFIC
12.9.4 SOUTH AMERICA
12.9.5 MIDDLE EAST AND AFRICA
12.1 NORTH AMERICA OTHERS IN UNMANNED MARINE VEHICLES MARKET, BY REGION, 2018-2033 (USD THOUSAND)
12.10.1 NORTH AMERICA
12.10.2 EUROPE
12.10.3 ASIA-PACIFIC
12.10.4 SOUTH AMERICA
12.10.5 MIDDLE EAST AND AFRICA
13 NORTH AMERICA UNMANNED MARINE VEHICLES MARKET, BY DISTRIBUTION CHANNEL, 2018-2033 (USD THOUSAND)
13.1 OVERVIEW
13.1.1 DIRECT SALES
13.1.2 SYSTEM INTEGRATORS
13.1.3 DISTRIBUTORS
13.1.4 ONLINE PLATFORMS
13.2 NORTH AMERICA DIRECT SALES IN UNMANNED MARINE VEHICLES MARKET, BY REGION, 2018-2033 (USD THOUSAND)
13.2.1 NORTH AMERICA
13.2.2 EUROPE
13.2.3 ASIA-PACIFIC
13.2.4 SOUTH AMERICA
13.2.5 MIDDLE EAST AND AFRICA
13.3 NORTH AMERICA SYSTEM INTEGRATORS IN UNMANNED MARINE VEHICLES MARKET, BY REGION, 2018-2033 (USD THOUSAND)
13.3.1 NORTH AMERICA
13.3.2 EUROPE
13.3.3 ASIA-PACIFIC
13.3.4 SOUTH AMERICA
13.3.5 MIDDLE EAST AND AFRICA
13.4 NORTH AMERICA DISTRIBUTORS IN UNMANNED MARINE VEHICLES MARKET, BY REGION, 2018-2033 (USD THOUSAND)
13.4.1 NORTH AMERICA
13.4.2 EUROPE
13.4.3 ASIA-PACIFIC
13.4.4 SOUTH AMERICA
13.4.5 MIDDLE EAST AND AFRICA
13.5 NORTH AMERICA ONLINE PLATFORMS IN UNMANNED MARINE VEHICLES MARKET, BY REGION, 2018-2033 (USD THOUSAND)
13.5.1 NORTH AMERICA
13.5.2 EUROPE
13.5.3 ASIA-PACIFIC
13.5.4 SOUTH AMERICA
13.5.5 MIDDLE EAST AND AFRICA
14 NORTH AMERICA UNMANNED MARINE VEHICLES MARKET, BY OPERATION, 2018-2033 (USD THOUSAND)
14.1 OVERVIEW
14.1.1 REMOTE CONTROLLED
14.1.2 AUTONOMOUS
14.2 NORTH AMERICA REMOTE CONTROLLED IN UNMANNED MARINE VEHICLES MARKET, BY REGION, 2018-2033 (USD THOUSAND)
14.2.1 NORTH AMERICA
14.2.2 EUROPE
14.2.3 ASIA-PACIFIC
14.2.4 SOUTH AMERICA
14.2.5 MIDDLE EAST AND AFRICA
14.3 NORTH AMERICA AUTONOMOUS IN UNMANNED MARINE VEHICLES MARKET, BY REGION, 2018-2033 (USD THOUSAND)
14.3.1 NORTH AMERICA
14.3.2 EUROPE
14.3.3 ASIA-PACIFIC
14.3.4 SOUTH AMERICA
14.3.5 MIDDLE EAST AND AFRICA
15 NORTH AMERICA UNMANNED MARINE VEHICLES MARKET, BY REGION
15.1 NORTH AMERICA
15.1.1 CANADA
15.1.2 MEXICO
16 NORTH AMERICA UNMANNED MARINE VEHICLES MARKET: COMPANY LANDSCAPE
16.1 MANUFACTURER COMPANY SHARE ANALYSIS: NORTH AMERICA
17 SWOT ANALYSIS
18 COMPANY PROFILES
18.1 L3HARRIS TECHNOLOGIES, INC.
18.1.1 COMPANY SNAPSHOT
18.1.2 REVENUE ANALYSIS
18.1.3 COMPANY SHARE ANALYSIS
18.1.4 PRODUCT PORTFOLIO
18.1.5 RECENT DEVELOPMENT
18.2 KONGSBERG DISCOVERY
18.2.1 COMPANY SNAPSHOT
18.2.2 COMPANY SHARE ANALYSIS
18.2.3 PRODUCT PORTFOLIO
18.2.4 RECENT DEVELOPMENT
18.3 OCEANEERING INTERNATIONAL,INC
18.3.1 COMPANY SNAPSHOT
18.3.2 REVENUE ANALYSIS
18.3.3 COMPANY SHARE ANALYSIS
18.3.4 SERVICE PORTFOLIO
18.3.5 RECENT DEVELOPMENT
18.4 SUBSEA 7
18.4.1 COMPANY SNAPSHOT
18.4.2 REVENUE ANALYSIS
18.4.3 COMPANY SHARE ANALYSIS
18.4.4 SERVICE PORTFOLIO
18.4.5 RECENT DEVELOPMENT
18.5 BAE SYSTEM
18.5.1 COMPANY SNAPSHOT
18.5.2 REVENUE ANALYSIS
18.5.3 COMPANY SHARE ANALYSIS
18.5.4 PRODUCT PORTFOLIO
18.5.5 RECENT DEVELOPMENT
18.6 ASV MOG (MARINE OPERATIONS GROUP)
18.6.1 COMPANY SNAPSHOT
18.6.2 PRODUCT PORTFOLIO
18.6.3 RECENT DEVELOPMENT
18.7 BLUEFIN ROBOTICS
18.7.1 COMPANY SNAPSHOT
18.7.2 PRODUCT/SERVICE PORTFOLIO
18.7.3 RECENT DEVELOPMENT
18.8 CELLULA ROBOTICS LTD
18.8.1 COMPANY SNAPSHOT
18.8.2 PRODUCT PORTFOLIO
18.8.3 RECENT DEVELOPMENT
18.9 CHANCE MARITIME TECHNOLOGIES
18.9.1 COMPANY SNAPSHOT
18.9.2 PRODUCT PORTFOLIO
18.9.3 RECENT DEVELOPMENT
18.1 DEEP OCEAN ENGINEERING, INC..
18.10.1 COMPANY SNAPSHOT
18.10.2 PRODUCT PORTFOLIO
18.10.3 RECENT DEVELOPMENT
18.11 ELBIT SYSTEMS
18.11.1 COMPANY SNAPSHOT
18.11.2 REVENUE ANALYSIS
18.11.3 PRODUCT PORTFOLIO
18.11.4 RECENT DEVELOPMENT
18.12 EXIAL TECHNOLOGIES
18.12.1 COMPANY SNAPSHOT
18.12.2 REVENUE ANALYSIS
18.12.3 PRODUCT/SERVICE PORTFOLIO
18.12.4 RECENT DEVELOPMENT
18.13 FUGRO
18.13.1 COMPANY SNAPSHOT
18.13.2 REVENUE ANALYSIS
18.13.3 PRODUCT PORTFOLIO
18.13.4 RECENT DEVELOPMENT
18.14 GENERAL DYNAMICS MISSION SYSTEMS
18.14.1 COMPANY SNAPSHOT
18.14.2 PRODUCT PORTFOLIO
18.14.3 RECENT DEVELOPMENT
18.15 LIQUID ROBOTICS (A BOEING COMPANY)
18.15.1 COMPANY SNAPSHOT
18.15.2 PRODUCT PORTFOLIO
18.15.3 RECENT DEVELOPMENT
18.16 MAPMARINE TECHNOLOGIES
18.16.1 COMPANY SNAPSHOT
18.16.2 PRODUCT PORTFOLIO
18.16.3 RECENT DEVELOPMENT
18.17 MARITIME ROBOTICS
18.17.1 COMPANY SNAPSHOT
18.17.2 PRODUCT/SERVICE PORTFOLIO
18.17.3 RECENT DEVELOPMENT
18.18 OCEANALPHA
18.18.1 COMPANY SNAPSHOT
18.18.2 PRODUCT PORTFOLIO
18.18.3 RECENT DEVELOPMENT
18.19 QINETIQ
18.19.1 COMPANY SNAPSHOT
18.19.2 REVENUE ANALYSIS
18.19.3 PRODUCT/SERVICE PORTFOLIO
18.19.4 RECENT DEVELOPMENT
18.2 ROVCO LTD.
18.20.1 COMPANY SNAPSHOT
18.20.2 PRODUCT PORTFOLIO
18.20.3 RECENT DEVELOPMENT
18.21 SAAB AB
18.21.1 COMPANY SNAPSHOT
18.21.2 REVENUE ANALYSIS
18.21.3 PRODUCT PORTFOLIO
18.21.4 RECENT DEVELOPMENT
18.22 SEA MACHINES ROBOTICS, INC.
18.22.1 COMPANY SNAPSHOT
18.22.2 PRODUCT PORTFOLIO
18.22.3 RECENT DEVELOPMENT
18.23 SONARDYNE INTERNATIONAL LTD.
18.23.1 COMPANY SNAPSHOT
18.23.2 PRODUCT/SERVICE PORTFOLIO
18.23.3 RECENT DEVELOPMENT
18.24 SEA ROBOTICS CORPORATION
18.24.1 COMPANY SNAPSHOT
18.24.2 PRODUCT PORTFOLIO
18.24.3 RECENT DEVELOPMENT
18.25 SEA-KIT INTERNATIONAL
18.25.1 COMPANY SNAPSHOT
18.25.2 PRODUCT PORTFOLIO
18.25.3 RECENT DEVELOPMENT
18.26 SUBSEA TECH
18.26.1 COMPANY SNAPSHOT
18.26.2 PRODUCT PORTFOLIO
18.26.3 RECENT DEVELOPMENT
18.27 TELEDYNE MARINE TECHNOLOGIES INCORPORATED.
18.27.1 COMPANY SNAPSHOT
18.27.2 PRODUCT PORTFOLIO
18.27.3 RECENT DEVELOPMENT
18.28 THALES GROUP
18.28.1 COMPANY SNAPSHOT
18.28.2 REVENUE ANALYSIS
18.28.3 PRODUCT PORTFOLIO
18.28.4 RECENT DEVELOPMENT
18.29 TKMS (ATLAS ELEKTRONIK)
18.29.1 COMPANY SNAPSHOT
18.29.2 PRODUCT PORTFOLIO
18.29.3 RECENT DEVELOPMENT
18.3 VARD AS
18.30.1 COMPANY SNAPSHOT
18.30.2 PRODUCT PORTFOLIO
18.30.3 RECENT DEVELOPMENT
19 QUESTIONNAIRE
20 RELATED REPORTS
List of Table
TABLE 1 REGIONAL GROWTH OPPORTUNITIES IN THE NORTH AMERICA UMV MARKET
TABLE 2 REGIONAL RESTRAINTS, KEY INITIATIVES, AND FUTURE INVESTMENT HOTSPOTS – NORTH AMERICA UMV MARKET
TABLE 3 BRAND COMPARISON
TABLE 4 COMPANY VS BRAND OVERVIEW — UNMANNED MARINE VEHICLES
TABLE 5 NORTH AMERICA UNMANNED MARINE VEHICLES MARKET, BY VEHICLE TYPE, 2018-2033 (USD THOUSAND)
TABLE 6 NORTH AMERICA UNMANNED MARINE VEHICLES MARKET, BY VEHICLE TYPE, 2018-2033 (UNITS)
TABLE 7 NORTH AMERICA REMOTELY OPERATED VEHICLES (ROV) IN UNMANNED MARINE VEHICLES MARKET, BY REGION, 2018-2033 (USD THOUSAND)
TABLE 8 NORTH AMERICA REMOTELY OPERATED VEHICLES (ROV) IN UNMANNED MARINE VEHICLES MARKET, BY DEPTH RATING, 2018-2033 (USD THOUSAND)
TABLE 9 NORTH AMERICA REMOTELY OPERATED VEHICLES (ROV) IN UNMANNED MARINE VEHICLES MARKET, BY TASK TYPE, 2018-2033 (USD THOUSAND)
TABLE 10 NORTH AMERICA AUTONOMOUS UNDERWATER VEHICLES (AUV) IN UNMANNED MARINE VEHICLES MARKET, BY REGION, 2018-2033 (USD THOUSAND)
TABLE 11 NORTH AMERICA AUTONOMOUS UNDERWATER VEHICLES (AUV) IN UNMANNED MARINE VEHICLES MARKET, BY CONFIGURATION, 2018-2033 (USD THOUSAND)
TABLE 12 NORTH AMERICA AUTONOMOUS UNDERWATER VEHICLES (AUV) IN UNMANNED MARINE VEHICLES MARKET, BY PROPULSION, 2018-2033 (USD THOUSAND)
TABLE 13 NORTH AMERICA SURFACE UNMANNED MARINE VEHICLES (USV) IN UNMANNED MARINE VEHICLES MARKET, BY REGION, 2018-2033 (USD THOUSAND)
TABLE 14 NORTH AMERICA SURFACE UNMANNED MARINE VEHICLES (USV) IN UNMANNED MARINE VEHICLES MARKET, BY OPERATION, 2018-2033 (USD THOUSAND)
TABLE 15 NORTH AMERICA SURFACE UNMANNED MARINE VEHICLES (USV) IN UNMANNED MARINE VEHICLES MARKET, BY HULL TYPE, 2018-2033 (USD THOUSAND)
TABLE 16 NORTH AMERICA AUTONOMOUS SURFACE VEHICLES (ASV) IN UNMANNED MARINE VEHICLES MARKET, BY REGION, 2018-2033 (USD THOUSAND)
TABLE 17 NORTH AMERICA AUTONOMOUS SURFACE VEHICLES (ASV) IN UNMANNED MARINE VEHICLES MARKET, BY APPLICATION, 2018-2033 (USD THOUSAND)
TABLE 18 NORTH AMERICA HYBRID SYSTEMS IN UNMANNED MARINE VEHICLES MARKET, BY REGION, 2018-2033 (USD THOUSAND)
TABLE 19 NORTH AMERICA OTHERS IN UNMANNED MARINE VEHICLES MARKET, BY REGION, 2018-2033 (USD THOUSAND)
TABLE 20 NORTH AMERICA UNMANNED MARINE VEHICLES MARKET, BY SYSTEM COMPONENT, 2018-2033 (USD THOUSAND)
TABLE 21 NORTH AMERICA UNMANNED MARINE VEHICLES MARKET, BY SYSTEM COMPONENT, 2018-2033 (UNITS)
TABLE 22 NORTH AMERICA SENSORS & PAYLOADS IN UNMANNED MARINE VEHICLES MARKET, BY REGION, 2018-2033 (USD THOUSAND)
TABLE 23 NORTH AMERICA SENSORS & PAYLOADS IN UNMANNED MARINE VEHICLES MARKET, BY TYPE, 2018-2033 (USD THOUSAND)
TABLE 24 NORTH AMERICA SONAR SYSTEMS IN UNMANNED MARINE VEHICLES MARKET, BY TYPE, 2018-2033 (USD THOUSAND)
TABLE 25 NORTH AMERICA CONTROL SYSTEMS IN UNMANNED MARINE VEHICLES MARKET, BY REGION, 2018-2033 (USD THOUSAND)
TABLE 26 NORTH AMERICA CONTROL SYSTEMS IN UNMANNED MARINE VEHICLES MARKET, BY TYPE, 2018-2033 (USD THOUSAND)
TABLE 27 NORTH AMERICA LAUNCH & RECOVERY SYSTEMS IN UNMANNED MARINE VEHICLES MARKET, BY REGION, 2018-2033 (USD THOUSAND)
TABLE 28 NORTH AMERICA OTHERS IN UNMANNED MARINE VEHICLES MARKET, BY REGION, 2018-2033 (USD THOUSAND)
TABLE 29 NORTH AMERICA UNMANNED MARINE VEHICLES MARKET, BY PROPULSION, 2018-2033 (USD THOUSAND)
TABLE 30 NORTH AMERICA UNMANNED MARINE VEHICLES MARKET, BY PROPULSION, 2018-2033 (UNITS)
TABLE 31 NORTH AMERICA DIESEL ENGINE SYSTEMS IN UNMANNED MARINE VEHICLES MARKET, BY REGION, 2018-2033 (USD THOUSAND)
TABLE 32 NORTH AMERICA ELECTRIC DRIVE SYSTEMS IN UNMANNED MARINE VEHICLES MARKET, BY REGION, 2018-2033 (USD THOUSAND)
TABLE 33 NORTH AMERICA BATTERY MODULES IN UNMANNED MARINE VEHICLES MARKET, BY REGION, 2018-2033 (USD THOUSAND)
TABLE 34 NORTH AMERICA FUEL CELL SYSTEMS IN UNMANNED MARINE VEHICLES MARKET, BY REGION, 2018-2033 (USD THOUSAND)
TABLE 35 NORTH AMERICA UNMANNED MARINE VEHICLES MARKET, BY APPLICATION, 2018-2033 (USD THOUSAND)
TABLE 36 NORTH AMERICA UNMANNED MARINE VEHICLES MARKET, BY APPLICATION, 2018-2033 (UNITS)
TABLE 37 NORTH AMERICA DEFENSE & SECURITY IN UNMANNED MARINE VEHICLES MARKET, BY REGION, 2018-2033 (USD THOUSAND)
TABLE 38 NORTH AMERICA DEFENSE & SECURITY IN UNMANNED MARINE VEHICLES MARKET, BY TYPE, 2018-2033 (USD THOUSAND)
TABLE 39 NORTH AMERICA OIL & GAS EXPLORATION IN UNMANNED MARINE VEHICLES MARKET, BY REGION, 2018-2033 (USD THOUSAND)
TABLE 40 NORTH AMERICA OIL & GAS EXPLORATION IN UNMANNED MARINE VEHICLES MARKET, BY TYPE, 2018-2033 (USD THOUSAND)
TABLE 41 NORTH AMERICA UNDERWATER INSPECTION & MAINTENANCE IN UNMANNED MARINE VEHICLES MARKET, BY REGION, 2018-2033 (USD THOUSAND)
TABLE 42 NORTH AMERICA OCEANOGRAPHIC SURVEY IN UNMANNED MARINE VEHICLES MARKET, BY REGION, 2018-2033 (USD THOUSAND)
TABLE 43 NORTH AMERICA OCEANOGRAPHIC SURVEY IN UNMANNED MARINE VEHICLES MARKET, BY TYPE, 2018-2033 (USD THOUSAND)
TABLE 44 NORTH AMERICA SCIENTIFIC RESEARCH IN UNMANNED MARINE VEHICLES MARKET, BY REGION, 2018-2033 (USD THOUSAND)
TABLE 45 NORTH AMERICA COMMERCIAL SHIPPING IN UNMANNED MARINE VEHICLES MARKET, BY REGION, 2018-2033 (USD THOUSAND)
TABLE 46 NORTH AMERICA SEARCH & RESCUE IN UNMANNED MARINE VEHICLES MARKET, BY REGION, 2018-2033 (USD THOUSAND)
TABLE 47 NORTH AMERICA OTHERS IN UNMANNED MARINE VEHICLES MARKET, BY REGION, 2018-2033 (USD THOUSAND)
TABLE 48 NORTH AMERICA UNMANNED MARINE VEHICLES MARKET, BY END USER, 2018-2033 (USD THOUSAND)
TABLE 49 NORTH AMERICA UNMANNED MARINE VEHICLES MARKET, BY END USER, 2018-2033 (UNITS)
TABLE 50 NORTH AMERICA NAVY IN UNMANNED MARINE VEHICLES MARKET, BY REGION, 2018-2033 (USD THOUSAND)
TABLE 51 NORTH AMERICA OIL & GAS INDUSTRY IN UNMANNED MARINE VEHICLES MARKET, BY REGION, 2018-2033 (USD THOUSAND)
TABLE 52 NORTH AMERICA RESEARCH INSTITUTES IN UNMANNED MARINE VEHICLES MARKET, BY REGION, 2018-2033 (USD THOUSAND)
TABLE 53 NORTH AMERICA MARITIME SECURITY ORGANIZATIONS (NON-NAVY, NON-COAST-GUARD SECURITY AGENCIES) IN UNMANNED MARINE VEHICLES MARKET, BY REGION, 2018-2033 (USD THOUSAND)
TABLE 54 NORTH AMERICA COAST GUARD IN UNMANNED MARINE VEHICLES MARKET, BY REGION, 2018-2033 (USD THOUSAND)
TABLE 55 NORTH AMERICA ENVIRONMENTAL AGENCIES IN UNMANNED MARINE VEHICLES MARKET, BY REGION, 2018-2033 (USD THOUSAND)
TABLE 56 NORTH AMERICA PORT AUTHORITIES IN UNMANNED MARINE VEHICLES MARKET, BY REGION, 2018-2033 (USD THOUSAND)
TABLE 57 NORTH AMERICA SALVAGE & RESCUE OPERATIONS IN UNMANNED MARINE VEHICLES MARKET, BY REGION, 2018-2033 (USD THOUSAND)
TABLE 58 NORTH AMERICA OTHERS IN UNMANNED MARINE VEHICLES MARKET, BY REGION, 2018-2033 (USD THOUSAND)
TABLE 59 NORTH AMERICA UNMANNED MARINE VEHICLES MARKET, BY DISTRIBUTION CHANNEL, 2018-2033 (USD THOUSAND)
TABLE 60 NORTH AMERICA UNMANNED MARINE VEHICLES MARKET, BY DISTRIBUTION CHANNEL, 2018-2033 (UNITS)
TABLE 61 NORTH AMERICA DIRECT SALES IN UNMANNED MARINE VEHICLES MARKET, BY REGION, 2018-2033 (USD THOUSAND)
TABLE 62 NORTH AMERICA SYSTEM INTEGRATORS IN UNMANNED MARINE VEHICLES MARKET, BY REGION, 2018-2033 (USD THOUSAND)
TABLE 63 NORTH AMERICA DISTRIBUTORS IN UNMANNED MARINE VEHICLES MARKET, BY REGION, 2018-2033 (USD THOUSAND)
TABLE 64 NORTH AMERICA ONLINE PLATFORMS IN UNMANNED MARINE VEHICLES MARKET, BY REGION, 2018-2033 (USD THOUSAND)
TABLE 65 NORTH AMERICA UNMANNED MARINE VEHICLES MARKET, BY OPERATION, 2018-2033 (USD THOUSAND)
TABLE 66 NORTH AMERICA UNMANNED MARINE VEHICLES MARKET, BY OPERATION, 2018-2033 (UNITS)
TABLE 67 NORTH AMERICA REMOTE CONTROLLED IN UNMANNED MARINE VEHICLES MARKET, BY REGION, 2018-2033 (USD THOUSAND)
TABLE 68 NORTH AMERICA AUTONOMOUS IN UNMANNED MARINE VEHICLES MARKET, BY REGION, 2018-2033 (USD THOUSAND)
TABLE 69 NORTH AMERICA UNMANNED MARINE VEHICLES MARKET, 2018-2033, (USD THOUSAND)
TABLE 70 NORTH AMERICA UNMANNED MARINE VEHICLES MARKET, BY REGION, 2018-2033, (USD THOUSAND)
TABLE 71 NORTH AMERICA UNMANNED MARINE VEHICLES MARKET, BY REGION, 2018-2033, (UNITS)
TABLE 72 USD THOUSAND
TABLE 73 NORTH AMERICA UNMANNED MARINE VEHICLES MARKET, BY VEHICLE TYPE, 2018-2033 (USD THOUSAND)
TABLE 74 NORTH AMERICA UNMANNED MARINE VEHICLES MARKET, BY VEHICLE TYPE, 2018-2033 (UNITS)
TABLE 75 NORTH AMERICA REMOTELY OPERATED VEHICLES (ROV) IN UNMANNED MARINE VEHICLES MARKET, BY DEPTH RATING, 2018-2033 (USD THOUSAND)
TABLE 76 NORTH AMERICA REMOTELY OPERATED VEHICLES (ROV) IN UNMANNED MARINE VEHICLES MARKET, BY TASK TYPE, 2018-2033 (USD THOUSAND)
TABLE 77 NORTH AMERICA AUTONOMOUS UNDERWATER VEHICLES (AUV) IN UNMANNED MARINE VEHICLES MARKET, BY CONFIGURATION, 2018-2033 (USD THOUSAND)
TABLE 78 NORTH AMERICA AUTONOMOUS UNDERWATER VEHICLES (AUV) IN UNMANNED MARINE VEHICLES MARKET, BY PROPULSION, 2018-2033 (USD THOUSAND)
TABLE 79 NORTH AMERICA SURFACE UNMANNED MARINE VEHICLES (USV) IN UNMANNED MARINE VEHICLES MARKET, BY OPERATION, 2018-2033 (USD THOUSAND)
TABLE 80 NORTH AMERICA SURFACE UNMANNED MARINE VEHICLES (USV) IN UNMANNED MARINE VEHICLES MARKET, BY HULL TYPE, 2018-2033 (USD THOUSAND)
TABLE 81 NORTH AMERICA AUTONOMOUS SURFACE VEHICLES (ASV) IN UNMANNED MARINE VEHICLES MARKET, BY APPLICATION, 2018-2033 (USD THOUSAND)
TABLE 82 NORTH AMERICA UNMANNED MARINE VEHICLES MARKET, BY SYSTEM COMPONENT, 2018-2033 (USD THOUSAND)
TABLE 83 NORTH AMERICA UNMANNED MARINE VEHICLES MARKET, BY SYSTEM COMPONENT, 2018-2033 (UNITS)
TABLE 84 NORTH AMERICA SENSORS & PAYLOADS IN UNMANNED MARINE VEHICLES MARKET, BY TYPE, 2018-2033 (USD THOUSAND)
TABLE 85 NORTH AMERICA SONAR SYSTEMS IN UNMANNED MARINE VEHICLES MARKET, BY TYPE, 2018-2033 (USD THOUSAND)
TABLE 86 NORTH AMERICA CONTROL SYSTEMS IN UNMANNED MARINE VEHICLES MARKET, BY TYPE, 2018-2033 (USD THOUSAND)
TABLE 87 NORTH AMERICA UNMANNED MARINE VEHICLES MARKET, BY PROPULSION, 2018-2033 (USD THOUSAND)
TABLE 88 NORTH AMERICA UNMANNED MARINE VEHICLES MARKET, BY PROPULSION, 2018-2033 (UNITS)
TABLE 89 NORTH AMERICA UNMANNED MARINE VEHICLES MARKET, BY APPLICATION, 2018-2033 (USD THOUSAND)
TABLE 90 NORTH AMERICA UNMANNED MARINE VEHICLES MARKET, BY APPLICATION, 2018-2033 (UNITS)
TABLE 91 NORTH AMERICA DEFENSE & SECURITY IN UNMANNED MARINE VEHICLES MARKET, BY TYPE, 2018-2033 (USD THOUSAND)
TABLE 92 NORTH AMERICA OIL & GAS EXPLORATION IN UNMANNED MARINE VEHICLES MARKET, BY TYPE, 2018-2033 (USD THOUSAND)
TABLE 93 NORTH AMERICA OCEANOGRAPHIC SURVEY IN UNMANNED MARINE VEHICLES MARKET, BY TYPE, 2018-2033 (USD THOUSAND)
TABLE 94 NORTH AMERICA UNMANNED MARINE VEHICLES MARKET, BY END USER, 2018-2033 (USD THOUSAND)
TABLE 95 NORTH AMERICA UNMANNED MARINE VEHICLES MARKET, BY END USER, 2018-2033 (UNITS)
TABLE 96 NORTH AMERICA UNMANNED MARINE VEHICLES MARKET, BY DISTRIBUTION CHANNEL, 2018-2033 (USD THOUSAND)
TABLE 97 NORTH AMERICA UNMANNED MARINE VEHICLES MARKET, BY DISTRIBUTION CHANNEL, 2018-2033 (UNITS)
TABLE 98 NORTH AMERICA UNMANNED MARINE VEHICLES MARKET, BY OPERATION, 2018-2033 (USD THOUSAND)
TABLE 99 NORTH AMERICA UNMANNED MARINE VEHICLES MARKET, BY OPERATION, 2018-2033 (UNITS)
TABLE 100 REGION
TABLE 101 NORTH AMERICA UNMANNED MARINE VEHICLES MARKET, BY COUNTRY, 2018-2033 (USD THOUSAND)
TABLE 102 NORTH AMERICA UNMANNED MARINE VEHICLES MARKET, BY COUNTRY, 2018-2033 (UNITS)
TABLE 103 USD MILLION
TABLE 104 NORTH AMERICA UNMANNED MARINE VEHICLES MARKET, BY VEHICLE TYPE, 2018-2033 (USD THOUSAND)
TABLE 105 NORTH AMERICA UNMANNED MARINE VEHICLES MARKET, BY VEHICLE TYPE, 2018-2033 (UNITS)
TABLE 106 NORTH AMERICA REMOTELY OPERATED VEHICLES (ROV) IN UNMANNED MARINE VEHICLES MARKET, BY DEPTH RATING, 2018-2033 (USD THOUSAND)
TABLE 107 ORTH AMERICA REMOTELY OPERATED VEHICLES (ROV) IN UNMANNED MARINE VEHICLES MARKET, BY TASK TYPE, 2018-2033 (USD THOUSAND)
TABLE 108 NORTH AMERICA AUTONOMOUS UNDERWATER VEHICLES (AUV) IN UNMANNED MARINE VEHICLES MARKET, BY CONFIGURATION, 2018-2033 (USD THOUSAND)
TABLE 109 NORTH AMERICA AUTONOMOUS UNDERWATER VEHICLES (AUV) IN UNMANNED MARINE VEHICLES MARKET, BY PROPULSION, 2018-2033 (USD THOUSAND)
TABLE 110 NORTH AMERICA SURFACE UNMANNED MARINE VEHICLES (USV) IN UNMANNED MARINE VEHICLES MARKET, BY OPERATION, 2018-2033 (USD THOUSAND)
TABLE 111 NORTH AMERICA SURFACE UNMANNED MARINE VEHICLES (USV) IN UNMANNED MARINE VEHICLES MARKET, BY HULL TYPE, 2018-2033 (USD THOUSAND)
TABLE 112 NORTH AMERICA AUTONOMOUS SURFACE VEHICLES (ASV) IN UNMANNED MARINE VEHICLES MARKET, BY APPLICATION, 2018-2033 (USD THOUSAND)
TABLE 113 NORTH AMERICA UNMANNED MARINE VEHICLES MARKET, BY SYSTEM COMPONENT, 2018-2033 (USD THOUSAND)
TABLE 114 NORTH AMERICA UNMANNED MARINE VEHICLES MARKET, BY SYSTEM COMPONENT, 2018-2033 (UNITS)
TABLE 115 NORTH AMERICA SENSORS & PAYLOADS IN UNMANNED MARINE VEHICLES MARKET, BY TYPE, 2018-2033 (USD THOUSAND)
TABLE 116 NORTH AMERICA SONAR SYSTEMS IN UNMANNED MARINE VEHICLES MARKET, BY TYPE, 2018-2033 (USD THOUSAND)
TABLE 117 NORTH AMERICA CONTROL SYSTEMS IN UNMANNED MARINE VEHICLES MARKET, BY TYPE, 2018-2033 (USD THOUSAND)
TABLE 118 NORTH AMERICA UNMANNED MARINE VEHICLES MARKET, BY PROPULSION, 2018-2033 (USD THOUSAND)
TABLE 119 NORTH AMERICA UNMANNED MARINE VEHICLES MARKET, BY PROPULSION, 2018-2033 (UNITS)
TABLE 120 NORTH AMERICA UNMANNED MARINE VEHICLES MARKET, BY APPLICATION, 2018-2033 (USD THOUSAND)
TABLE 121 NORTH AMERICA UNMANNED MARINE VEHICLES MARKET, BY APPLICATION, 2018-2033 (UNITS)
TABLE 122 NORTH AMERICA DEFENSE & SECURITY IN UNMANNED MARINE VEHICLES MARKET, BY TYPE, 2018-2033 (USD THOUSAND)
TABLE 123 NORTH AMERICA OIL & GAS EXPLORATION IN UNMANNED MARINE VEHICLES MARKET, BY TYPE, 2018-2033 (USD THOUSAND)
TABLE 124 NORTH AMERICA OCEANOGRAPHIC SURVEY IN UNMANNED MARINE VEHICLES MARKET, BY TYPE, 2018-2033 (USD THOUSAND)
TABLE 125 NORTH AMERICA UNMANNED MARINE VEHICLES MARKET, BY END USER, 2018-2033 (USD THOUSAND)
TABLE 126 NORTH AMERICA UNMANNED MARINE VEHICLES MARKET, BY END USER, 2018-2033 (UNITS)
TABLE 127 NORTH AMERICA UNMANNED MARINE VEHICLES MARKET, BY DISTRIBUTION CHANNEL, 2018-2033 (USD THOUSAND)
TABLE 128 NORTH AMERICA UNMANNED MARINE VEHICLES MARKET, BY DISTRIBUTION CHANNEL, 2018-2033 (UNITS)
TABLE 129 NORTH AMERICA UNMANNED MARINE VEHICLES MARKET, BY OPERATION, 2018-2033 (USD THOUSAND)
TABLE 130 NORTH AMERICA UNMANNED MARINE VEHICLES MARKET, BY OPERATION, 2018-2033 (UNITS)
TABLE 131 USD MILLION
TABLE 132 U.S. UNMANNED MARINE VEHICLES MARKET, BY VEHICLE TYPE, 2018-2033 (USD THOUSAND)
TABLE 133 U.S. UNMANNED MARINE VEHICLES MARKET, BY VEHICLE TYPE, 2018-2033 (UNITS)
TABLE 134 U.S. REMOTELY OPERATED VEHICLES (ROV) IN UNMANNED MARINE VEHICLES MARKET, BY DEPTH RATING, 2018-2033 (USD THOUSAND)
TABLE 135 U.S. REMOTELY OPERATED VEHICLES (ROV) IN UNMANNED MARINE VEHICLES MARKET, BY TASK TYPE, 2018-2033 (USD THOUSAND)
TABLE 136 U.S. AUTONOMOUS UNDERWATER VEHICLES (AUV) IN UNMANNED MARINE VEHICLES MARKET, BY CONFIGURATION, 2018-2033 (USD THOUSAND)
TABLE 137 U.S. AUTONOMOUS UNDERWATER VEHICLES (AUV) IN UNMANNED MARINE VEHICLES MARKET, BY PROPULSION, 2018-2033 (USD THOUSAND)
TABLE 138 U.S. SURFACE UNMANNED MARINE VEHICLES (USV) IN UNMANNED MARINE VEHICLES MARKET, BY OPERATION, 2018-2033 (USD THOUSAND)
TABLE 139 U.S. SURFACE UNMANNED MARINE VEHICLES (USV) IN UNMANNED MARINE VEHICLES MARKET, BY HULL TYPE, 2018-2033 (USD THOUSAND)
TABLE 140 U.S. AUTONOMOUS SURFACE VEHICLES (ASV) IN UNMANNED MARINE VEHICLES MARKET, BY APPLICATION, 2018-2033 (USD THOUSAND)
TABLE 141 U.S. UNMANNED MARINE VEHICLES MARKET, BY SYSTEM COMPONENT, 2018-2033 (USD THOUSAND)
TABLE 142 U.S. UNMANNED MARINE VEHICLES MARKET, BY SYSTEM COMPONENT, 2018-2033 (UNITS)
TABLE 143 U.S. SENSORS & PAYLOADS IN UNMANNED MARINE VEHICLES MARKET, BY TYPE, 2018-2033 (USD THOUSAND)
TABLE 144 U.S. SONAR SYSTEMS IN UNMANNED MARINE VEHICLES MARKET, BY TYPE, 2018-2033 (USD THOUSAND)
TABLE 145 U.S. CONTROL SYSTEMS IN UNMANNED MARINE VEHICLES MARKET, BY TYPE, 2018-2033 (USD THOUSAND)
TABLE 146 U.S. UNMANNED MARINE VEHICLES MARKET, BY PROPULSION, 2018-2033 (USD THOUSAND)
TABLE 147 U.S. UNMANNED MARINE VEHICLES MARKET, BY PROPULSION, 2018-2033 (UNITS)
TABLE 148 U.S. UNMANNED MARINE VEHICLES MARKET, BY APPLICATION, 2018-2033 (USD THOUSAND)
TABLE 149 U.S. UNMANNED MARINE VEHICLES MARKET, BY APPLICATION, 2018-2033 (UNITS)
TABLE 150 U.S. DEFENSE & SECURITY IN UNMANNED MARINE VEHICLES MARKET, BY TYPE, 2018-2033 (USD THOUSAND)
TABLE 151 U.S. OIL & GAS EXPLORATION IN UNMANNED MARINE VEHICLES MARKET, BY TYPE, 2018-2033 (USD THOUSAND)
TABLE 152 U.S. OCEANOGRAPHIC SURVEY IN UNMANNED MARINE VEHICLES MARKET, BY TYPE, 2018-2033 (USD THOUSAND)
TABLE 153 U.S. UNMANNED MARINE VEHICLES MARKET, BY END USER, 2018-2033 (USD THOUSAND)
TABLE 154 U.S. UNMANNED MARINE VEHICLES MARKET, BY END USER, 2018-2033 (UNITS)
TABLE 155 U.S. UNMANNED MARINE VEHICLES MARKET, BY DISTRIBUTION CHANNEL, 2018-2033 (USD THOUSAND)
TABLE 156 U.S. UNMANNED MARINE VEHICLES MARKET, BY DISTRIBUTION CHANNEL, 2018-2033 (UNITS)
TABLE 157 U.S. UNMANNED MARINE VEHICLES MARKET, BY OPERATION, 2018-2033 (USD THOUSAND)
TABLE 158 U.S. UNMANNED MARINE VEHICLES MARKET, BY OPERATION, 2018-2033 (UNITS)
TABLE 159 USD MILLION
TABLE 160 CANADA UNMANNED MARINE VEHICLES MARKET, BY VEHICLE TYPE, 2018-2033 (USD THOUSAND)
TABLE 161 CANADA UNMANNED MARINE VEHICLES MARKET, BY VEHICLE TYPE, 2018-2033 (UNITS)
TABLE 162 CANADA REMOTELY OPERATED VEHICLES (ROV) IN UNMANNED MARINE VEHICLES MARKET, BY DEPTH RATING, 2018-2033 (USD THOUSAND)
TABLE 163 ANADA REMOTELY OPERATED VEHICLES (ROV) IN UNMANNED MARINE VEHICLES MARKET, BY TASK TYPE, 2018-2033 (USD THOUSAND)
TABLE 164 CANADA AUTONOMOUS UNDERWATER VEHICLES (AUV) IN UNMANNED MARINE VEHICLES MARKET, BY CONFIGURATION, 2018-2033 (USD THOUSAND)
TABLE 165 CANADA AUTONOMOUS UNDERWATER VEHICLES (AUV) IN UNMANNED MARINE VEHICLES MARKET, BY PROPULSION, 2018-2033 (USD THOUSAND)
TABLE 166 CANADA SURFACE UNMANNED MARINE VEHICLES (USV) IN UNMANNED MARINE VEHICLES MARKET, BY OPERATION, 2018-2033 (USD THOUSAND)
TABLE 167 CANADA SURFACE UNMANNED MARINE VEHICLES (USV) IN UNMANNED MARINE VEHICLES MARKET, BY HULL TYPE, 2018-2033 (USD THOUSAND)
TABLE 168 CANADA AUTONOMOUS SURFACE VEHICLES (ASV) IN UNMANNED MARINE VEHICLES MARKET, BY APPLICATION, 2018-2033 (USD THOUSAND)
TABLE 169 CANADA UNMANNED MARINE VEHICLES MARKET, BY SYSTEM COMPONENT, 2018-2033 (USD THOUSAND)
TABLE 170 CANADA UNMANNED MARINE VEHICLES MARKET, BY SYSTEM COMPONENT, 2018-2033 (UNITS)
TABLE 171 CANADA SENSORS & PAYLOADS IN UNMANNED MARINE VEHICLES MARKET, BY TYPE, 2018-2033 (USD THOUSAND)
TABLE 172 CANADA SONAR SYSTEMS IN UNMANNED MARINE VEHICLES MARKET, BY TYPE, 2018-2033 (USD THOUSAND)
TABLE 173 CANADA CONTROL SYSTEMS IN UNMANNED MARINE VEHICLES MARKET, BY TYPE, 2018-2033 (USD THOUSAND)
TABLE 174 CANADA UNMANNED MARINE VEHICLES MARKET, BY PROPULSION, 2018-2033 (USD THOUSAND)
TABLE 175 CANADA UNMANNED MARINE VEHICLES MARKET, BY PROPULSION, 2018-2033 (UNITS)
TABLE 176 CANADA UNMANNED MARINE VEHICLES MARKET, BY APPLICATION, 2018-2033 (USD THOUSAND)
TABLE 177 CANADA UNMANNED MARINE VEHICLES MARKET, BY APPLICATION, 2018-2033 (UNITS)
TABLE 178 CANADA DEFENSE & SECURITY IN UNMANNED MARINE VEHICLES MARKET, BY TYPE, 2018-2033 (USD THOUSAND)
TABLE 179 CANADA OIL & GAS EXPLORATION IN UNMANNED MARINE VEHICLES MARKET, BY TYPE, 2018-2033 (USD THOUSAND)
TABLE 180 CANADA OCEANOGRAPHIC SURVEY IN UNMANNED MARINE VEHICLES MARKET, BY TYPE, 2018-2033 (USD THOUSAND)
TABLE 181 CANADA UNMANNED MARINE VEHICLES MARKET, BY END USER, 2018-2033 (USD THOUSAND)
TABLE 182 CANADA UNMANNED MARINE VEHICLES MARKET, BY END USER, 2018-2033 (UNITS)
TABLE 183 CANADA UNMANNED MARINE VEHICLES MARKET, BY DISTRIBUTION CHANNEL, 2018-2033 (USD THOUSAND)
TABLE 184 CANADA UNMANNED MARINE VEHICLES MARKET, BY DISTRIBUTION CHANNEL, 2018-2033 (UNITS)
TABLE 185 CANADA UNMANNED MARINE VEHICLES MARKET, BY OPERATION, 2018-2033 (USD THOUSAND)
TABLE 186 CANADA UNMANNED MARINE VEHICLES MARKET, BY OPERATION, 2018-2033 (UNITS)
TABLE 187 USD MILLION
TABLE 188 MEXICO UNMANNED MARINE VEHICLES MARKET, BY VEHICLE TYPE, 2018-2033 (USD THOUSAND)
TABLE 189 MEXICO UNMANNED MARINE VEHICLES MARKET, BY VEHICLE TYPE, 2018-2033 (UNITS)
TABLE 190 MEXICO REMOTELY OPERATED VEHICLES (ROV) IN UNMANNED MARINE VEHICLES MARKET, BY DEPTH RATING, 2018-2033 (USD THOUSAND)
TABLE 191 MEXICO REMOTELY OPERATED VEHICLES (ROV) IN UNMANNED MARINE VEHICLES MARKET, BY TASK TYPE, 2018-2033 (USD THOUSAND)
TABLE 192 MEXICO AUTONOMOUS UNDERWATER VEHICLES (AUV) IN UNMANNED MARINE VEHICLES MARKET, BY CONFIGURATION, 2018-2033 (USD THOUSAND)
TABLE 193 MEXICO AUTONOMOUS UNDERWATER VEHICLES (AUV) IN UNMANNED MARINE VEHICLES MARKET, BY PROPULSION, 2018-2033 (USD THOUSAND)
TABLE 194 MEXICO SURFACE UNMANNED MARINE VEHICLES (USV) IN UNMANNED MARINE VEHICLES MARKET, BY OPERATION, 2018-2033 (USD THOUSAND)
TABLE 195 MEXICO SURFACE UNMANNED MARINE VEHICLES (USV) IN UNMANNED MARINE VEHICLES MARKET, BY HULL TYPE, 2018-2033 (USD THOUSAND)
TABLE 196 MEXICO AUTONOMOUS SURFACE VEHICLES (ASV) IN UNMANNED MARINE VEHICLES MARKET, BY APPLICATION, 2018-2033 (USD THOUSAND)
TABLE 197 MEXICO UNMANNED MARINE VEHICLES MARKET, BY SYSTEM COMPONENT, 2018-2033 (USD THOUSAND)
TABLE 198 MEXICO UNMANNED MARINE VEHICLES MARKET, BY SYSTEM COMPONENT, 2018-2033 (UNITS)
TABLE 199 MEXICO SENSORS & PAYLOADS IN UNMANNED MARINE VEHICLES MARKET, BY TYPE, 2018-2033 (USD THOUSAND)
TABLE 200 MEXICO SONAR SYSTEMS IN UNMANNED MARINE VEHICLES MARKET, BY TYPE, 2018-2033 (USD THOUSAND)
TABLE 201 MEXICO CONTROL SYSTEMS IN UNMANNED MARINE VEHICLES MARKET, BY TYPE, 2018-2033 (USD THOUSAND)
TABLE 202 MEXICO UNMANNED MARINE VEHICLES MARKET, BY PROPULSION, 2018-2033 (USD THOUSAND)
TABLE 203 MEXICO UNMANNED MARINE VEHICLES MARKET, BY PROPULSION, 2018-2033 (UNITS)
TABLE 204 MEXICO UNMANNED MARINE VEHICLES MARKET, BY APPLICATION, 2018-2033 (USD THOUSAND)
TABLE 205 MEXICO UNMANNED MARINE VEHICLES MARKET, BY APPLICATION, 2018-2033 (UNITS)
TABLE 206 MEXICO DEFENSE & SECURITY IN UNMANNED MARINE VEHICLES MARKET, BY TYPE, 2018-2033 (USD THOUSAND)
TABLE 207 MEXICO OIL & GAS EXPLORATION IN UNMANNED MARINE VEHICLES MARKET, BY TYPE, 2018-2033 (USD THOUSAND)
TABLE 208 MEXICO OCEANOGRAPHIC SURVEY IN UNMANNED MARINE VEHICLES MARKET, BY TYPE, 2018-2033 (USD THOUSAND)
TABLE 209 MEXICO UNMANNED MARINE VEHICLES MARKET, BY END USER, 2018-2033 (USD THOUSAND)
TABLE 210 MEXICO UNMANNED MARINE VEHICLES MARKET, BY END USER, 2018-2033 (UNITS)
TABLE 211 MEXICO UNMANNED MARINE VEHICLES MARKET, BY DISTRIBUTION CHANNEL, 2018-2033 (USD THOUSAND)
TABLE 212 MEXICO UNMANNED MARINE VEHICLES MARKET, BY DISTRIBUTION CHANNEL, 2018-2033 (UNITS)
TABLE 213 MEXICO UNMANNED MARINE VEHICLES MARKET, BY OPERATION, 2018-2033 (USD THOUSAND)
TABLE 214 MEXICO UNMANNED MARINE VEHICLES MARKET, BY OPERATION, 2018-2033 (UNITS)
List of Figure
FIGURE 1 NORTH AMERICA UNMANNED MARINE VEHICLES MARKET: SEGMENTATION
FIGURE 2 NORTH AMERICA UNMANNED MARINE VEHICLES MARKET: DATA TRIANGULATION
FIGURE 3 NORTH AMERICA UNMANNED MARINE VEHICLES MARKET: DROC ANALYSIS
FIGURE 4 NORTH AMERICA UNMANNED MARINE VEHICLES MARKET: NORTH AMERICA VS REGIONAL MARKET ANALYSIS
FIGURE 5 NORTH AMERICA UNMANNED MARINE VEHICLES MARKET: COMPANY RESEARCH ANALYSIS
FIGURE 6 NORTH AMERICA UNMANNED MARINE VEHICLES MARKET: INTERVIEW DEMOGRAPHICS
FIGURE 7 NORTH AMERICA UNMANNED MARINE VEHICLES MARKET: DBMR MARKET POSITION GRID
FIGURE 8 NORTH AMERICA UNMANNED MARINE VEHICLES MARKET: VENDOR SHARE ANALYSIS
FIGURE 9 NORTH AMERICA UNMANNED MARINE VEHICLES MARKET: MULTIVARIATE MODELING
FIGURE 10 NORTH AMERICA UNMANNED MARINE VEHICLES MARKET: VEHICLE TYPE TIMELINE CURVE
FIGURE 11 NORTH AMERICA UNMANNED MARINE VEHICLES MARKET: END-USER COVERAGE GRID
FIGURE 12 NORTH AMERICA UNMANNED MARINE VEHICLES MARKET: SEGMENTATION
FIGURE 13 TWO SEGMENTS COMPRISE THE NORTH AMERICA UNMANNED MARINE VEHICLES MARKET, BY VEHICLE TYPE (2025)
FIGURE 14 NORTH AMERICA IS EXPECTED TO BE THE DOMINANT AND FASTEST GROWING REGION IN THE NORTH AMERICA UNMANNED MARINE VEHICLES MARKET IN THE FORECAST PERIOD OF 2026 TO 2033
FIGURE 15 STRATEGIC DECISIONS
FIGURE 16 NORTH AMERICA UNMANNED MARINE VEHICLES MARKET: EXECUTIVE SUMMARY
FIGURE 17 INCREASING DEFENSE MODERNIZATION AND NAVAL SURVEILLANCE NEEDS IS EXPECTED TO DRIVE THE NORTH AMERICA UNMANNED MARINE VEHICLES MARKET DURING THE FORECAST PERIOD OF 2026 TO 2033
FIGURE 18 VEHICLE TYPE SEGMENT IS EXPECTED TO ACCOUNT FOR THE LARGEST SHARE OF THE NORTH AMERICA UNMANNED MARINE VEHICLES MARKET IN 2026 & 2033
FIGURE 19 NORTH AMERICA THE FASTEST-GROWING REGION FOR THE NORTH AMERICA UNMANNED MARINE VEHICLES MARKET IN THE FORECAST PERIOD OF 2026 TO 2033
FIGURE 20 PESTEL ANALYSIS
FIGURE 21 PORTER’S FIVE FORCES ANALYSIS
FIGURE 22 IMPORT EXPORT SCENARIO (USD THOUSAND)
FIGURE 23 SUMMARY OF KEY STRATEGIC INITIATIVES UNDERTAKEN BY LEADING OEMS IN THE NORTH AMERICA UNMANNED MARINE VEHICLES MARKET (2025)
FIGURE 24 YEAR-WISE PATENT PUBLICATIONS IN THE UMV DOMAIN
FIGURE 25 DROC ANALYSIS
FIGURE 26 NORTH AMERICA UNMANNED MARINE VEHICLES MARKET: BY VEHICLE TYPE, 2025
FIGURE 27 NORTH AMERICA UNMANNED MARINE VEHICLES MARKET: BY SYSTEM COMPONENT, 2025
FIGURE 28 NORTH AMERICA UNMANNED MARINE VEHICLES MARKET: BY PROPULSION, 2025
FIGURE 29 NORTH AMERICA UNMANNED MARINE VEHICLES MARKET: BY APPLICATION, 2025
FIGURE 30 NORTH AMERICA UNMANNED MARINE VEHICLES MARKET: BY END USER, 2025
FIGURE 31 NORTH AMERICA UNMANNED MARINE VEHICLES MARKET: BY DISTRIBUTION CHANNEL, 2025
FIGURE 32 NORTH AMERICA UNMANNED MARINE VEHICLES MARKET: BY OPERATION, 2025
FIGURE 33 NORTH AMERICA MARKET OVERVIEW
FIGURE 34 NORTH AMERICA UNMANNED MARINE VEHICLES MARKET: COMPANY SHARE 2025 (%)
Data collection and base year analysis are done using data collection modules with large sample sizes. The stage includes obtaining market information or related data through various sources and strategies. It includes examining and planning all the data acquired from the past in advance. It likewise envelops the examination of information inconsistencies seen across different information sources. The market data is analysed and estimated using market statistical and coherent models. Also, market share analysis and key trend analysis are the major success factors in the market report. To know more, please request an analyst call or drop down your inquiry.
The key research methodology used by DBMR research team is data triangulation which involves data mining, analysis of the impact of data variables on the market and primary (industry expert) validation. Data models include Vendor Positioning Grid, Market Time Line Analysis, Market Overview and Guide, Company Positioning Grid, Patent Analysis, Pricing Analysis, Company Market Share Analysis, Standards of Measurement, Global versus Regional and Vendor Share Analysis. To know more about the research methodology, drop in an inquiry to speak to our industry experts.
Data Bridge Market Research is a leader in advanced formative research. We take pride in servicing our existing and new customers with data and analysis that match and suits their goal. The report can be customized to include price trend analysis of target brands understanding the market for additional countries (ask for the list of countries), clinical trial results data, literature review, refurbished market and product base analysis. Market analysis of target competitors can be analyzed from technology-based analysis to market portfolio strategies. We can add as many competitors that you require data about in the format and data style you are looking for. Our team of analysts can also provide you data in crude raw excel files pivot tables (Fact book) or can assist you in creating presentations from the data sets available in the report.


