
North America Vaccines Market
Market Size in USD Billion
 USD
21.53 Billion
USD
35.90 Billion
2024
2032
USD
21.53 Billion
USD
35.90 Billion
2024
2032
| 2025 - 2032 | |
| USD 21.53 Billion | |
| USD 35.90 Billion | |
| % | |
|
North America Vaccines Market Size
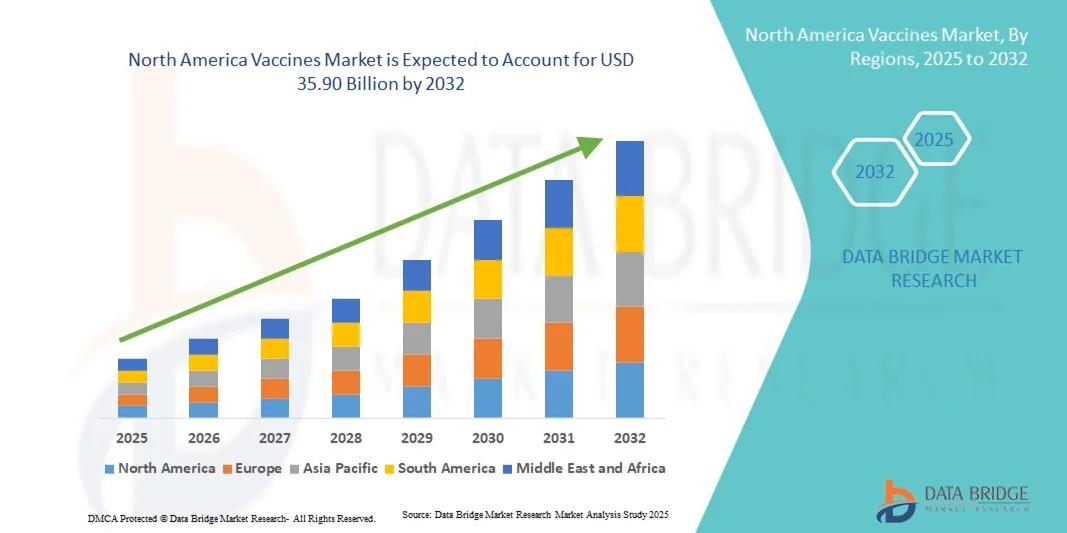
- The North America vaccines market size was valued at USD 21.53 billion in 2024 and is expected to reach USD 35.90 billion by 2032, at a CAGR of 6.6% during the forecast period
- The market growth is largely fueled by advancements in vaccine development, increasing immunization awareness, and robust healthcare infrastructure across the region
- Furthermore, strong government initiatives, rising disease awareness, and the presence of key pharmaceutical manufacturers such as Pfizer, Moderna, and Merck & Co. are driving the adoption of vaccines, establishing the region as a leading hub for immunization solutions and accelerating overall market growth
North America Vaccines Market Analysis
- Vaccines, providing immunization against infectious diseases through preventive or therapeutic formulations, are increasingly critical components of public health strategies in both pediatric and adult populations due to their proven efficacy, safety, and role in reducing disease burden
- The escalating demand for vaccines is primarily fueled by growing awareness of preventable diseases, government-led immunization programs, and rising healthcare spending across the region
- U.S. dominated the North America vaccines market with the largest revenue share of 83.5% in 2024, characterized by advanced healthcare infrastructure, high adoption of new vaccine technologies, and a strong presence of leading pharmaceutical manufacturers, driving substantial growth through extensive immunization campaigns and rapid response to emerging infectious diseases
- Canada is expected to be the fastest growing country in the North America vaccines market during the forecast period due to increasing vaccine coverage and government vaccination initiatives
- The Subunit Vaccines segment dominated the North America vaccines market with a market share of 32.6% in 2024, driven by their safety, high immunogenicity, and widespread use in routine immunization programs
Report Scope and North America Vaccines Market Segmentation
|
Attributes |
North America Vaccines Key Market Insights |
|
Segments Covered |
|
|
Countries Covered |
North America
|
|
Key Market Players |
|
|
Market Opportunities |
|
|
Value Added Data Infosets |
In addition to the insights on market scenarios such as market value, growth rate, segmentation, geographical coverage, and major players, the market reports curated by the Data Bridge Market Research also include in-depth expert analysis, pricing analysis, brand share analysis, consumer survey, demography analysis, supply chain analysis, value chain analysis, raw material/consumables overview, vendor selection criteria, PESTLE Analysis, Porter Analysis, and regulatory framework. |
North America Vaccines Market Trends
Expansion of Digital Immunization Platforms
- A significant and accelerating trend in the North America vaccines market is the adoption of digital immunization platforms and mobile health apps that enable individuals and healthcare providers to track vaccination schedules, monitor coverage, and receive timely reminders
- For instance, the VaxCare platform integrates with healthcare provider systems, allowing seamless vaccine inventory management and patient immunization tracking. Similarly, the MyIR mobile app enables patients to access their vaccine records digitally
- Digital platforms also facilitate better public health monitoring, helping authorities identify coverage gaps and respond to outbreaks more efficiently. For instance, some state-level immunization registries in the U.S. leverage AI-driven analytics to predict vaccine demand and optimize distribution
- The integration of vaccines with digital health tools enhances patient engagement, improves compliance with recommended schedules, and supports centralized management of vaccination campaigns, particularly in pediatric and adult populations
- This trend towards digitization and connected healthcare systems is transforming expectations for vaccine accessibility, efficiency, and record-keeping. Consequently, companies such as Moderna and Pfizer are collaborating with tech providers to improve digital vaccination tracking and reminders
- The demand for vaccines supported by digital monitoring and data-driven insights is growing rapidly across both public and private healthcare sectors, as patients and providers increasingly prioritize convenience, accuracy, and timely immunization
North America Vaccines Market Dynamics
Driver
Rising Awareness and Government Initiatives for Immunization
- The increasing awareness of vaccine-preventable diseases among the population, coupled with strong government-led immunization programs, is a significant driver for the heightened demand for vaccines in North America
- For instance, in March 2024, the U.S. CDC expanded its adult immunization initiative, aiming to improve influenza and pneumococcal vaccine coverage among high-risk groups. Such initiatives by authorities are expected to drive vaccines market growth in the forecast period
- As citizens become more informed about the benefits of vaccination and the risks of preventable diseases, vaccines offer reliable protection, making them an essential component of public health strategies
- Furthermore, the increasing adoption of school and workplace vaccination mandates is making vaccines an integral part of preventive healthcare, improving coverage across age groups
- The convenience of routine vaccination programs, wide availability at hospitals, clinics, and pharmacies, and the ability to track immunization digitally are key factors propelling the adoption of vaccines in both pediatric and adult populations
Restraint/Challenge
Vaccine Hesitancy and Regulatory Hurdles
- Concerns surrounding vaccine safety, efficacy, and misinformation among certain population segments pose a significant challenge to broader market penetration. As vaccines require public trust and adherence, hesitancy can limit uptake and coverage
- For instance, reports of adverse effects from certain vaccines have made some individuals reluctant to participate in routine immunization programs
- Addressing these concerns through awareness campaigns, transparent communication, and adherence to regulatory guidelines is crucial for maintaining public confidence. Companies such as Pfizer and Moderna emphasize clinical trial data and FDA-approved safety protocols to reassure patients and healthcare providers
- In addition, stringent regulatory requirements, complex approval processes, and high R&D costs can delay the introduction of new vaccines, limiting market expansion
- Overcoming these challenges through continuous education, streamlined regulatory pathways, and public-private collaborations will be vital for sustained growth of the North America vaccines market
North America Vaccines Market Scope
The market is segmented on the basis of composition, type, kind, age of administration, disease, route of administration, end user, and distribution channel
- By Composition
On the basis of composition, the North America vaccines market is segmented into combination vaccines and monovaccines. The combination vaccines segment dominated the market with the largest revenue share of 46% in 2024, driven by their ability to protect against multiple diseases in a single dose, which improves patient compliance and reduces the number of healthcare visits. These vaccines are particularly preferred in pediatric immunization schedules, as they simplify administration and minimize discomfort. Combination vaccines also reduce logistical challenges for healthcare providers by optimizing storage and transport requirements. Public health programs across the U.S. and Canada have strongly promoted combination vaccines, increasing adoption in both public and private sectors. Healthcare professionals and parents favor combination vaccines for the convenience and cost-effectiveness they provide.
The monovaccines segment is anticipated to witness the fastest growth rate of 7.2% from 2025 to 2032, driven by the rising demand for disease-specific immunization programs. Monovaccines allow targeted protection against single pathogens, such as influenza, hepatitis, or COVID-19, making them essential for booster doses and outbreak responses. They are increasingly adopted in adult vaccination campaigns due to specific age-related risks. Government and private health initiatives promoting adult immunization further accelerate monovaccine adoption. The flexibility to tailor vaccination based on individual or community needs enhances their market growth. Monovaccines are also gaining traction in travel medicine and high-risk population programs.
- By Type
On the basis of type, the North America vaccines market is segmented into subunit, recombinant, polysaccharide & conjugate vaccines, live-attenuated vaccines, inactivated vaccines, toxoid vaccines, and DNA vaccines. The subunit vaccines segment dominated the market with a revenue share of 32.6% in 2024, owing to their high safety profile and strong immunogenicity. These vaccines are widely used in both pediatric and adult populations, forming part of routine immunization programs for diseases such as hepatitis B and pertussis. The controlled composition of subunit vaccines reduces the risk of adverse reactions, which encourages public trust. Government vaccination campaigns rely heavily on subunit vaccines for school and community programs. Healthcare providers prefer subunit vaccines for their predictable immune response and ease of storage. They also facilitate large-scale immunization with minimal monitoring requirements.
The DNA vaccines segment is expected to witness the fastest CAGR of 8.1% from 2025 to 2032, driven by technological advancements in mRNA and DNA-based platforms. DNA vaccines allow rapid development and adaptability against emerging infectious diseases. Their efficacy in both adults and children is being tested in ongoing clinical trials, showing promising results. Increased collaboration between biotech firms and government agencies is boosting adoption. Rising investment in next-generation vaccine research supports their faster market uptake. DNA vaccines are also favored for their potential in personalized immunization strategies.
- By Kind
On the basis of kind, the North America vaccines market is segmented into routine vaccines, recommended vaccines, and required vaccines. The routine vaccines segment dominated the market with the largest share of 50% in 2024, as these vaccines are part of standard immunization schedules for children and adults. Routine vaccines such as DPT, MMR, and hepatitis B are critical for public health programs and benefit from strong government and insurance support. High parental awareness and school entry requirements further drive demand. Hospitals and clinics prioritize routine vaccines for consistent coverage. They offer predictable procurement and distribution for healthcare providers. The segment also benefits from standardized global guidelines, ensuring widespread adoption.
The recommended vaccines segment is anticipated to witness the fastest growth rate of 6.5% from 2025 to 2032, fueled by awareness of vaccines such as influenza, HPV, and shingles among adults. Physician recommendations strongly influence adoption in this segment. Insurance coverage and public health campaigns targeting high-risk adults are increasing uptake. The convenience of vaccine accessibility at pharmacies and clinics supports growth. New research highlighting vaccine efficacy against emerging diseases encourages adoption. This segment is expected to expand rapidly in urban and suburban populations.
- By Age of Administration
On the basis of age, the North America vaccines market is segmented into pediatric vaccines and adult vaccines. The pediatric vaccines segment dominated the market with a revenue share of 58% in 2024, driven by extensive childhood immunization programs and strong government funding. Vaccines for measles, mumps, rubella, DPT, and hepatitis are routinely administered during infancy and early childhood, ensuring consistent demand. High parental awareness about preventable diseases supports adoption. Pediatric vaccines are integrated into school health programs and well-child visits. Strong public-private partnerships facilitate large-scale pediatric vaccination campaigns. The segment benefits from standardized schedules and high coverage rates.
The adult vaccines segment is expected to witness the fastest CAGR of 7% from 2025 to 2032, fueled by awareness of age-related vulnerability to diseases such as influenza, pneumococcal infections, and shingles. Adult vaccination programs are expanding in workplaces, travel clinics, and hospitals. Chronic disease prevalence and aging populations further drive demand. Physician recommendation and insurance incentives enhance uptake. Digital immunization tracking apps encourage compliance among adults. This segment is rapidly gaining importance in preventive healthcare strategies.
- By Disease
On the basis of disease, the North America vaccines market is segmented into pneumococcal disease, measles, mumps & varicella, DPT, hepatitis, influenza, typhoid, meningococcal, rabies, Japanese encephalitis, yellow fever, and others. The influenza segment dominated the market with a share of 25% in 2024, due to its seasonal prevalence and established vaccination programs in both pediatric and adult populations. Annual immunization campaigns, workplace programs, and school initiatives drive adoption. Government funding ensures vaccine availability during flu season. Influenza vaccines are promoted for high-risk groups such as elderly and immunocompromised individuals. Strong public awareness campaigns enhance coverage. Healthcare providers prioritize influenza vaccines for preventive healthcare programs.
The meningococcal segment is expected to witness the fastest growth rate of 6.8% from 2025 to 2032, driven by rising awareness of outbreaks in schools, universities, and military settings. Vaccination programs targeting adolescents and young adults are accelerating uptake. Government-supported initiatives encourage early vaccination. New conjugate vaccines improve immunogenicity and coverage. Travel vaccination requirements contribute to increasing demand. Private clinics and specialty centers are actively promoting meningococcal vaccines.
- By Route of Administration
On the basis of route, the North America vaccines market is segmented into injectable, oral, and nasal. The injectable vaccines segment dominated the market with a revenue share of 89% in 2024, due to their widespread use for routine and recommended immunizations. Injectable vaccines are highly effective and provide predictable immune responses. Most pediatric and adult vaccines are administered via injection. Hospitals and clinics favor injectable vaccines for ease of monitoring and storage. Standardized administration protocols support large-scale immunization. Injectable delivery ensures regulatory compliance and safety.
The nasal vaccines segment is expected to witness the fastest CAGR of 7.5% from 2025 to 2032, driven by needle-free delivery options for flu vaccines and new mucosal vaccines. Nasal vaccines improve patient compliance, especially in children and needle-averse populations. They reduce the need for trained healthcare personnel for administration. Adoption is increasing in school-based and mass vaccination campaigns. Nasal vaccines are also being explored for emerging respiratory infections. Innovative formulations and marketing strategies are accelerating adoption in North America.
- By End User
On the basis of end user, the North America vaccines market is segmented into community hospitals, hospitals, specialty centres, clinics, and others. The hospitals segment dominated the market with the largest revenue share of 45% in 2024, due to centralized vaccination services and robust cold chain infrastructure. Hospitals provide comprehensive immunization programs for pediatric and adult populations. High patient footfall ensures consistent vaccine demand. Hospitals benefit from government vaccination initiatives and insurance reimbursements. They are preferred for outbreak response and mass immunization drives. Standard operating procedures in hospitals enhance vaccine safety and compliance.
The specialty centres segment is expected to witness the fastest growth rate of 7% from 2025 to 2032, fueled by the rise of dedicated immunization and travel clinics. These centers target adults, travelers, and high-risk populations. Specialty centers offer personalized vaccination services and flexible schedules. Increasing consumer preference for convenience drives adoption. Collaboration with pharmaceutical companies supports specialty vaccine programs. Growth is supported by rising awareness and private healthcare expansion.
- By Distribution Channel
On the basis of distribution channel, the North America vaccines market is segmented into hospital pharmacy, retail pharmacy, and online pharmacy. The hospital pharmacy segment dominated the market with a revenue share of 52% in 2024, driven by direct access to patients and integration with vaccination programs. Hospital pharmacies ensure cold chain management, regulatory compliance, and timely vaccine availability. They serve as primary distribution points for both pediatric and adult vaccines. Government programs often supply vaccines through hospital pharmacies. Hospital pharmacies provide on-site administration, enhancing convenience and adherence.
The online pharmacy segment is expected to witness the fastest CAGR of 8% from 2025 to 2032, fueled by e-commerce adoption, home delivery services, and digital prescriptions. Online pharmacies offer convenience for adult vaccinations and boosters. Patient preference for contactless delivery is accelerating adoption. Integration with digital health platforms enhances order tracking. Online pharmacies are increasingly collaborating with vaccine manufacturers. Marketing and awareness campaigns are driving consumer trust and growth.
North America Vaccines Market Regional Analysis
- The U.S. dominated the North America vaccines market with the largest revenue share of 83.5% in 2024, characterized by advanced healthcare infrastructure, high adoption of new vaccine technologies, and a strong presence of leading pharmaceutical manufacturers, driving substantial growth through extensive immunization campaigns and rapid response to emerging infectious diseases
- Healthcare providers and consumers in the region highly value the efficacy, safety, and convenience of vaccines, along with the ability to prevent widespread outbreaks and protect vulnerable populations such as children and the elderly
- This widespread adoption is further supported by advanced healthcare infrastructure, high disposable incomes, a technologically inclined population, and strong presence of leading pharmaceutical manufacturers, establishing vaccines as a critical component of preventive healthcare strategies across both public and private sectors
U.S. North America Vaccines Market Insight
The U.S. vaccines market captured the largest revenue share of 83.5% in 2024 within North America, fueled by extensive immunization programs, high public awareness of vaccine-preventable diseases, and advanced healthcare infrastructure. Consumers and healthcare providers are increasingly prioritizing routine and recommended vaccinations for children, adults, and high-risk populations. The growing adoption of digital immunization tracking systems, mobile health apps, and AI-driven vaccine distribution tools further propels the vaccines industry. Moreover, strong government initiatives, collaborations with pharmaceutical companies, and widespread availability of vaccines in hospitals, clinics, and pharmacies are significantly contributing to market expansion.
Canada Vaccines Market Insight
The Canada vaccines market is projected to expand at a substantial CAGR throughout the forecast period, primarily driven by government-funded vaccination programs and rising awareness of preventable diseases. Increasing urbanization, coupled with the demand for accessible immunization services, is fostering vaccine adoption across pediatric and adult populations. Canadian consumers value vaccine efficacy, safety, and convenience, supported by digital health platforms and public health campaigns. The region is experiencing significant growth across hospitals, clinics, and specialty centers, with vaccines being incorporated into routine healthcare visits and targeted immunization initiatives.
Mexico Vaccines Market Insight
The Mexico vaccines market is anticipated to grow at a noteworthy CAGR during the forecast period, driven by rising public health initiatives, expanding immunization coverage, and increasing awareness of preventable diseases. Government programs aimed at children and high-risk adults are enhancing vaccine penetration. In addition, improved healthcare infrastructure and collaborations with global vaccine manufacturers are supporting market growth. Mexican consumers and healthcare providers are increasingly adopting vaccines due to their proven safety and preventive benefits. Mobile immunization clinics and outreach programs are further accelerating vaccine uptake across rural and urban areas.
North America Vaccines Market Share
The North America Vaccines industry is primarily led by well-established companies, including:
- Pfizer Inc. (U.S.)
- Moderna, Inc. (U.S.)
- Novavax, (U.S.)
- Merck & Co., Inc. (U.S.)
- Sanofi (U.S.)
- GSK plc (U.K.)
- AstraZeneca (U.K.)
- CSL (Australia)
- Bavarian Nordic (Denmark)
- VBI Vaccines Inc. (Canada)
- INOVIO Pharmaceuticals (U.S.)
- Dynavax Technologies (U.S.)
- GeoVax Labs, Inc. (U.S.)
- HilleVax, Inc. (U.S.)
- VaxCyte (U.S.)
- Vaxart, Inc. (U.S.)
- Meissa Vaccines, Inc. (U.S.)
- Vivaldi Biosciences, Inc. (U.S.)
- Valneva SE (France)
What are the Recent Developments in North America Vaccines Market?
- In August 2025, the FDA approved updated COVID-19 vaccines for individuals aged 65 and older, as well as those under 65 with underlying health conditions. The approved vaccines include formulations from Pfizer-BioNTech, Moderna, and Novavax. Notably, Moderna's vaccine was approved for individuals aged 6 months and older, while Pfizer-BioNTech's updated version of Comirnaty was authorized for individuals aged 65 and older, and those aged 5 to 64 with at least one underlying health condition
- In August 2025, the FDA revoked the Emergency Use Authorization (EUA) for Novavax's COVID-19 Vaccine, Adjuvanted. However, the vaccine, branded as Nuvaxovid, was subsequently approved for use in individuals aged 65 and older, and for those aged 12 to 64 with underlying health conditions. This approval followed a delay due to concerns about the vaccine's composition and regulatory challenges
- In May 2025, the U.S. Food and Drug Administration (FDA) approved Novavax's protein-based COVID-19 vaccine, Nuvaxovid, for individuals aged 65 and older. This approval marked a significant milestone for Novavax, which had faced nearly five years of regulatory delays and financial challenges. The vaccine had generated USD 682 million in total revenue for 2024, including licensing and royalties
- In May 2025, Moderna's next-generation COVID-19 vaccine, mNEXSPIKE, was approved by the FDA for individuals aged 65 and above. This approval came as the urgency of vaccination decreased, with COVID-19 transitioning to an endemic phase. Despite the reduced urgency, health officials continued to recommend updated vaccines for certain populations to mitigate long COVID symptoms
- In March 2025, the U.S. Food and Drug Administration (FDA) approved a freeze-dried formulation of Bavarian Nordic's Jynneos vaccine, designed to protect against mpox and smallpox. This new formulation offers improved stability, easier storage, and extended shelf life compared to the previously available liquid-frozen version
SKU-

- Interactive Data Analysis Dashboard
- Company Analysis Dashboard for high growth potential opportunities
- Research Analyst Access for customization & queries
- Competitor Analysis with Interactive dashboard
- Latest News, Updates & Trend analysis
- Harness the Power of Benchmark Analysis for Comprehensive Competitor Tracking
Data collection and base year analysis are done using data collection modules with large sample sizes. The stage includes obtaining market information or related data through various sources and strategies. It includes examining and planning all the data acquired from the past in advance. It likewise envelops the examination of information inconsistencies seen across different information sources. The market data is analysed and estimated using market statistical and coherent models. Also, market share analysis and key trend analysis are the major success factors in the market report. To know more, please request an analyst call or drop down your inquiry.
The key research methodology used by DBMR research team is data triangulation which involves data mining, analysis of the impact of data variables on the market and primary (industry expert) validation. Data models include Vendor Positioning Grid, Market Time Line Analysis, Market Overview and Guide, Company Positioning Grid, Patent Analysis, Pricing Analysis, Company Market Share Analysis, Standards of Measurement, Global versus Regional and Vendor Share Analysis. To know more about the research methodology, drop in an inquiry to speak to our industry experts.
Data Bridge Market Research is a leader in advanced formative research. We take pride in servicing our existing and new customers with data and analysis that match and suits their goal. The report can be customized to include price trend analysis of target brands understanding the market for additional countries (ask for the list of countries), clinical trial results data, literature review, refurbished market and product base analysis. Market analysis of target competitors can be analyzed from technology-based analysis to market portfolio strategies. We can add as many competitors that you require data about in the format and data style you are looking for. Our team of analysts can also provide you data in crude raw excel files pivot tables (Fact book) or can assist you in creating presentations from the data sets available in the report.


