
North America Vanilla Beans And Extracts Market
Market Size in USD Million
 USD
234.29 Million
USD
313.32 Million
2025
2033
USD
234.29 Million
USD
313.32 Million
2025
2033
| 2026 - 2033 | |
| USD 234.29 Million | |
| USD 313.32 Million | |
| % | |
|
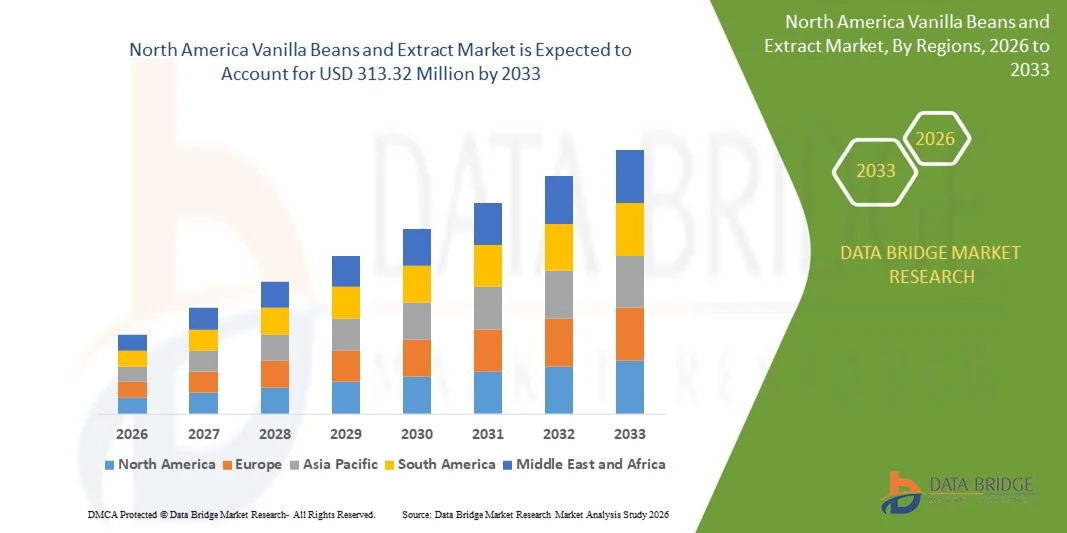
North America Vanilla Beans and Extract Market Size
- The North America vanilla beans and extract market size was valued at USD 234.29 million in 2025 and is expected to reach USD 313.32 million by 2033, at a CAGR of 3.70% during the forecast period
- The market growth is largely fuelled by the increasing demand for natural flavors in food and beverages, rising consumer preference for clean-label and plant-based products, and the growing popularity of premium desserts and confectionery items
- Expansion in the bakery, dairy, and beverage industries, along with rising usage in cosmetics and personal care products, is further driving market adoption
North America Vanilla Beans and Extract Market Analysis
- Growing consumer awareness regarding natural and authentic flavors is boosting the demand for high-quality vanilla beans and extracts across various end-use industries
- Rising adoption of vanilla in flavored beverages, chocolates, ice creams, and baked goods is fueling market growth, supported by expanding retail and online distribution channels
- U.S. dominated the vanilla beans and extract market with the largest revenue share in 2025, driven by high demand from the food and beverage industry, as well as increasing use in personal care and pharmaceutical products
- Canada is expected to witness the highest compound annual growth rate (CAGR) in the North America vanilla beans and extract market due to rising awareness of plant-based and natural ingredients, expanding bakery and confectionery sectors, growth of e-commerce and retail channels, and increasing consumer preference for premium and ethically sourced vanilla products
- The Madagascar segment held the largest market revenue share in 2025, driven by its superior flavor profile, consistent quality, and widespread preference among premium food and beverage manufacturers. Madagascar vanilla is widely used in bakery, confectionery, and dairy products, making it a preferred choice for authentic flavor applications
Report Scope and North America Vanilla Beans and Extract Market Segmentation
|
Attributes |
North America Vanilla Beans and Extract Key Market Insights |
|
Segments Covered |
|
|
Countries Covered |
North America
|
|
Key Market Players |
• Nielsen-Massey Vanillas, Inc. (U.S.) |
|
Market Opportunities |
|
|
Value Added Data Infosets |
In addition to the insights on market scenarios such as market value, growth rate, segmentation, geographical coverage, and major players, the market reports curated by the Data Bridge Market Research also include in-depth expert analysis, pricing analysis, brand share analysis, consumer survey, demography analysis, supply chain analysis, value chain analysis, raw material/consumables overview, vendor selection criteria, PESTLE Analysis, Porter Analysis, and regulatory framework. |
North America Vanilla Beans and Extract Market Trends
Rising Demand for Natural and Clean-Label Flavors
- The growing consumer preference for natural and minimally processed flavors is significantly shaping the vanilla beans and extract market. Consumers increasingly favor ingredients that are authentic, non-synthetic, and plant-derived. Vanilla extracts are gaining traction due to their ability to enhance taste and aroma without artificial additives, encouraging manufacturers to innovate with new formulations that meet evolving flavor expectations across food, beverage, and confectionery applications
- Increasing awareness around health, wellness, and sustainable consumption has accelerated the demand for vanilla beans and extracts in bakery, dairy, beverages, and confectionery products. Health-conscious consumers are actively seeking products formulated with naturally sourced ingredients, prompting brands to emphasize traceability, eco-friendly sourcing, and sustainable production practices
- Clean-label and sustainability trends are influencing purchasing decisions, with manufacturers highlighting transparent sourcing, organic certifications, and environmentally responsible production. These factors help brands differentiate their products in a competitive market, build consumer trust, and drive adoption of premium vanilla products
- For instance, in 2024, leading brands such as Starbucks and Nestlé expanded their product portfolios by incorporating natural vanilla extracts in beverages, ice creams, and confectionery items. These launches responded to rising consumer preference for authentic flavors and clean-label products, distributed across retail, specialty, and online channels, while reinforcing brand loyalty and repeat purchases
- While demand for vanilla beans and extracts is growing, sustained market expansion depends on continuous R&D, cost-effective production, and maintaining consistent flavor quality. Manufacturers are also focusing on improving scalability, supply chain reliability, and developing innovative formulations that balance cost, quality, and sustainability for broader adoption
North America Vanilla Beans and Extract Market Dynamics
Driver
Growing Preference for Natural and Clean-Label Flavors
- Rising consumer demand for authentic, plant-derived flavors is a major driver for the vanilla beans and extract market. Manufacturers are increasingly replacing synthetic flavorings with natural vanilla to meet clean-label expectations, enhance product appeal, and comply with regulatory standards. This trend is also pushing innovation in natural extraction methods and flavor concentration techniques
- Expanding applications in bakery, confectionery, beverages, dairy, and frozen desserts are influencing market growth. Vanilla extracts enhance taste, aroma, and product perception while maintaining natural labeling, enabling manufacturers to meet consumer expectations for high-quality, natural offerings
- Food and beverage manufacturers are actively promoting products formulated with natural vanilla through innovation, marketing campaigns, and certifications. These efforts are supported by growing consumer preference for health-oriented and sustainably sourced products, encouraging collaborations between ingredient suppliers and brands to improve functional quality and sustainability
- For instance, in 2023, companies such as Ben & Jerry’s and Häagen-Dazs increased incorporation of premium vanilla extracts in ice creams and desserts. This expansion followed rising demand for clean-label, non-GMO, and sustainably sourced flavors, driving repeat purchases and product differentiation. Both companies highlighted ethical sourcing and traceability in marketing campaigns to strengthen consumer trust and brand loyalty
- Although rising clean-label and natural flavor trends support growth, wider adoption depends on cost optimization, raw material availability, and scalable production processes. Investment in supply chain efficiency, sustainable sourcing, and advanced extraction technology will be critical for meeting global demand and maintaining competitive advantage
Restraint/Challenge
Higher Cost And Supply Volatility Compared To Synthetic Flavors
- The relatively higher cost of natural vanilla beans and extracts compared to synthetic flavorings remains a key challenge, limiting adoption among price-sensitive manufacturers. Factors such as complex cultivation, extraction methods, and seasonal variations contribute to elevated pricing and impact market penetration
- Supply chain challenges also affect growth, as vanilla beans require sourcing from specific regions and adherence to stringent quality standards. Fluctuating yields due to climate, disease, or geopolitical factors may disrupt supply, leading to price volatility and limited availability of high-quality beans
- Market awareness and technical know-how influence adoption, particularly among small-scale manufacturers. Limited understanding of the functional and flavor benefits of natural vanilla may restrict uptake across certain product categories and delay innovation
- For instance, in 2024, confectionery producers reported challenges in securing consistent vanilla bean supplies due to crop shortages and high costs, affecting production planning, pricing, and product visibility
- Overcoming these challenges will require cost-efficient production, expanded sourcing networks, and investment in sustainable cultivation practices. Collaboration with farmers, certification bodies, and distributors can help stabilize supply and unlock long-term growth potential in the global vanilla beans and extract market, while reinforcing ethical sourcing and brand reputation
North America Vanilla Beans and Extract Market Scope
The North America vanilla beans and extract market is segmented into six notable segments based on product type, grades, origin, form, end user, and distribution channel.
- By Product Type
On the basis of product type, the North America vanilla beans and extract market is segmented into Madagascar, Mexican, Indian, Indonesian, Tahitian, Tonga, Papua, Ugandan, and others. The Madagascar segment held the largest market revenue share in 2025, driven by its superior flavor profile, consistent quality, and widespread preference among premium food and beverage manufacturers. Madagascar vanilla is widely used in bakery, confectionery, and dairy products, making it a preferred choice for authentic flavor applications.
The Mexican segment is expected to witness the fastest growth rate from 2026 to 2033, fueled by increasing demand for its rich aroma and adaptability in various culinary and beverage applications. Mexican vanilla is gaining popularity due to its balanced flavor, cost-effectiveness, and growing recognition in international markets, encouraging manufacturers to incorporate it into premium and mainstream product lines.
- By Grades
On the basis of grades, the North America vanilla beans and extract market is segmented into Grade A, Grade B, and others. The Grade A segment held the largest market revenue share in 2025, driven by its high vanillin content, strong aroma, and suitability for premium food and beverage products. Grade A is widely used in bakery, confectionery, and dairy products, ensuring authentic flavor and high-quality standards.
The Grade B segment is expected to witness the fastest growth rate from 2026 to 2033, fueled by its cost-effectiveness and versatility in processed products and extracts. Grade B is increasingly preferred by manufacturers seeking to optimize production costs while maintaining acceptable flavor quality, making it suitable for bulk applications.
- By Origin
On the basis of origin, the North America vanilla beans and extract market is segmented into natural and synthetic. The natural segment held the largest market revenue share in 2025, driven by rising consumer preference for clean-label, plant-based ingredients. Natural vanilla is widely used across bakery, beverages, and personal care products due to its authentic aroma and flavor characteristics.
The synthetic segment is expected to witness the fastest growth rate from 2026 to 2033, fueled by its consistent quality, lower cost, and suitability for large-scale industrial applications. Synthetic vanilla is gaining traction in processed foods and beverages where supply of natural vanilla is limited.
- By Form
On the basis of form, the North America vanilla beans and extract market is segmented into liquid, powder, and paste. The liquid segment held the largest market revenue share in 2025, driven by its ease of use, better solubility, and compatibility with bakery, beverages, and dairy products. Liquid vanilla is widely preferred by manufacturers for seamless integration into recipes and formulations.
The powder segment is expected to witness the fastest growth rate from 2026 to 2033, fueled by its long shelf life, convenience in storage, and use in specialty applications. Vanilla paste is also gaining popularity for premium culinary and confectionery products due to its concentrated flavor profile.
- By End User
On the basis of end user, the North America vanilla beans and extract market is segmented into food products, beverages, personal care products, pharmaceutical industry, home cooking, and others. The food products segment held the largest market revenue share in 2025, driven by high demand from bakery, confectionery, and dairy sectors. Vanilla is widely used to enhance taste, aroma, and overall product appeal.
The beverages segment is expected to witness the fastest growth rate from 2026 to 2033, fueled by rising consumption of flavored drinks, coffee, and dairy beverages. Personal care products and home cooking applications are also witnessing growing adoption due to the demand for natural and premium ingredients.
- By Distribution Channel
On the basis of distribution channel, the North America vanilla beans and extract market is segmented into B2B and B2C. The B2B segment held the largest market revenue share in 2025, driven by bulk procurement by food and beverage manufacturers. Vanilla beans and extracts are widely supplied to industrial manufacturers for consistent flavoring in processed products.
The B2C segment is expected to witness the fastest growth rate from 2026 to 2033, fueled by increasing popularity of home cooking, online retail channels, and ready-to-use vanilla products. Consumers are increasingly purchasing vanilla products directly for culinary use and specialty applications.
North America Vanilla Beans and Extract Market Regional Analysis
- U.S. dominated the vanilla beans and extract market with the largest revenue share in 2025, driven by high demand from the food and beverage industry, as well as increasing use in personal care and pharmaceutical products
- Consumers in the country prefer premium-quality vanilla for bakery, confectionery, and beverage applications, valuing its natural flavor and aroma
- This widespread adoption is further supported by strong purchasing power, growing awareness of natural ingredients, and the rising popularity of clean-label products, establishing vanilla as a favored ingredient across multiple industries
Canada Vanilla Beans and Extract Market Insight
The Canada vanilla beans and extract market is expected to witness the fastest growth from 2026 to 2033, driven by rising consumer preference for natural and high-quality flavorings in food, beverages, and personal care products. Increased demand in bakery, confectionery, and dairy applications is encouraging manufacturers to expand production and distribution networks. Consumers’ growing inclination towards clean-label and plant-based ingredients, along with investments in innovative vanilla-based formulations, is significantly supporting market expansion.
North America Vanilla Beans and Extract Market Share
The North America vanilla beans and extract industry is primarily led by well-established companies, including:
• Nielsen-Massey Vanillas, Inc. (U.S.)
• Beanilla, Inc. (U.S.)
• Heilala Vanilla (U.S.)
• Frontier Co-op (U.S.)
• McCormick & Company, Inc. (U.S.)
• Sonoma Syrup Co., Inc. (U.S.)
• Republica del Cacao (U.S.)
• Madison & Vine Natural Flavors (U.S.)
• Vanilla Food Company, Inc. (U.S.)
• Givaudan (U.S.)
• Edlong Corporation (U.S.)
• Rodelle, Inc. (U.S.)
• Vanilla Ventures, LLC (U.S.)
• David Michael & Co. (U.S.)
• The Vanilla Company (Canada)
SKU-

- Interactive Data Analysis Dashboard
- Company Analysis Dashboard for high growth potential opportunities
- Research Analyst Access for customization & queries
- Competitor Analysis with Interactive dashboard
- Latest News, Updates & Trend analysis
- Harness the Power of Benchmark Analysis for Comprehensive Competitor Tracking
North America Vanilla Beans And Extracts Market, Supply Chain Analysis and Ecosystem Framework
To support market growth and help clients navigate the impact of geopolitical shifts, DBMR has integrated in-depth supply chain analysis into its North America Vanilla Beans And Extracts Market research reports. This addition empowers clients to respond effectively to global changes affecting their industries. The supply chain analysis section includes detailed insights such as North America Vanilla Beans And Extracts Market consumption and production by country, price trend analysis, the impact of tariffs and geopolitical developments, and import and export trends by country and HSN code. It also highlights major suppliers with data on production capacity and company profiles, as well as key importers and exporters. In addition to research, DBMR offers specialized supply chain consulting services backed by over a decade of experience, providing solutions like supplier discovery, supplier risk assessment, price trend analysis, impact evaluation of inflation and trade route changes, and comprehensive market trend analysis.
Data collection and base year analysis are done using data collection modules with large sample sizes. The stage includes obtaining market information or related data through various sources and strategies. It includes examining and planning all the data acquired from the past in advance. It likewise envelops the examination of information inconsistencies seen across different information sources. The market data is analysed and estimated using market statistical and coherent models. Also, market share analysis and key trend analysis are the major success factors in the market report. To know more, please request an analyst call or drop down your inquiry.
The key research methodology used by DBMR research team is data triangulation which involves data mining, analysis of the impact of data variables on the market and primary (industry expert) validation. Data models include Vendor Positioning Grid, Market Time Line Analysis, Market Overview and Guide, Company Positioning Grid, Patent Analysis, Pricing Analysis, Company Market Share Analysis, Standards of Measurement, Global versus Regional and Vendor Share Analysis. To know more about the research methodology, drop in an inquiry to speak to our industry experts.
Data Bridge Market Research is a leader in advanced formative research. We take pride in servicing our existing and new customers with data and analysis that match and suits their goal. The report can be customized to include price trend analysis of target brands understanding the market for additional countries (ask for the list of countries), clinical trial results data, literature review, refurbished market and product base analysis. Market analysis of target competitors can be analyzed from technology-based analysis to market portfolio strategies. We can add as many competitors that you require data about in the format and data style you are looking for. Our team of analysts can also provide you data in crude raw excel files pivot tables (Fact book) or can assist you in creating presentations from the data sets available in the report.


