
North America Virtual Pipeline Systems Market
Market Size in USD Billion
 USD
576.56 Billion
USD
947.06 Billion
2024
2032
USD
576.56 Billion
USD
947.06 Billion
2024
2032
| 2025 - 2032 | |
| USD 576.56 Billion | |
| USD 947.06 Billion | |
| % | |
|
Virtual Pipeline Systems Market Size
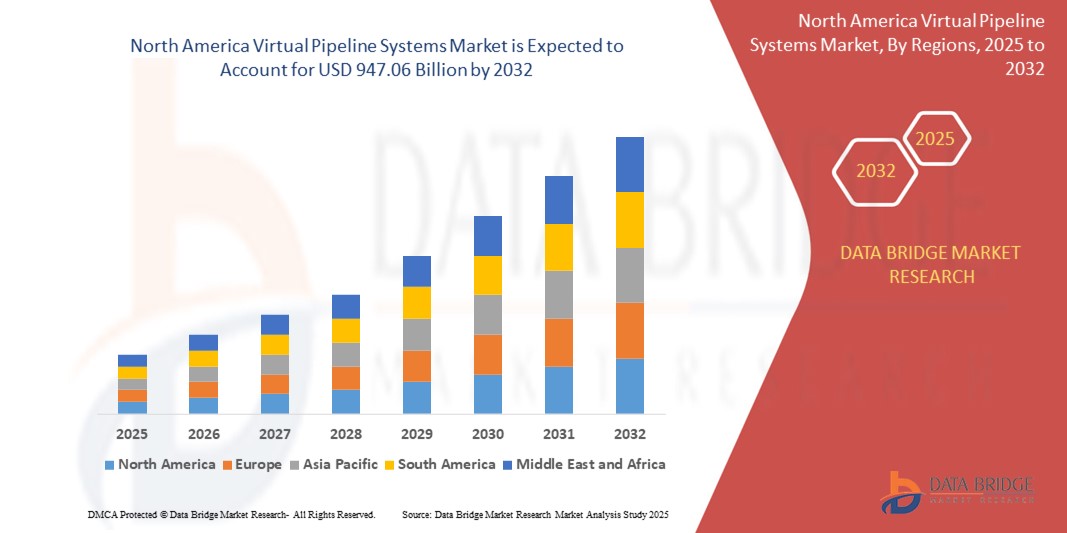
- The North America virtual pipeline systems market size was valued at USD 576.56 billion in 2024 and is expected to reach USD 947.06 billion by 2032, at a CAGR of 6.40% during the forecast period
- The market growth is primarily driven by the increasing demand for flexible and cost-effective energy transportation solutions, particularly in remote and underserved areas, coupled with advancements in gas storage and transportation technologies
- Rising energy needs, growing adoption of cleaner fuels such as LNG and CNG, and the need for efficient energy distribution systems in industrial and residential sectors are key factors accelerating the uptake of virtual pipeline systems, significantly boosting market growth
Virtual Pipeline Systems Market Analysis
- Virtual pipeline systems, which provide flexible and scalable solutions for transporting natural gas and other fuels to areas without traditional pipeline infrastructure, are becoming critical in meeting energy demands across industrial, commercial, and residential applications
- The market is propelled by the growing emphasis on sustainable energy solutions, increasing adoption of natural gas as a cleaner alternative to traditional fuels, and the need for reliable energy supply in remote regions
- Canada dominated the North America virtual pipeline systems market with the largest revenue share of 39.8% in 2024, driven by its vast natural gas reserves, robust energy infrastructure, and widespread adoption of virtual pipeline systems in remote communities and industrial sectors
- The U.S. is expected to be the fastest-growing region in the North America virtual pipeline systems market during the forecast period, fueled by increasing investments in LNG and CNG infrastructure, supportive government policies, and rising demand for clean energy solutions
- The ordinary type segment dominated the largest market revenue share of 62.3% in 2024, driven by its widespread use in standard applications for transporting natural gas and other fuels to remote areas. These systems are cost-effective and easier to deploy, making them suitable for a broad range of industries.
Report Scope and Virtual Pipeline Systems Market Segmentation
|
Attributes |
Virtual Pipeline Systems Key Market Insights |
|
Segments Covered |
|
|
Countries Covered |
North America
|
|
Key Market Players |
|
|
Market Opportunities |
|
|
Value Added Data Infosets |
In addition to the insights on market scenarios such as market value, growth rate, segmentation, geographical coverage, and major players, the market reports curated by the Data Bridge Market Research also include import export analysis, production capacity overview, production consumption analysis, price trend analysis, climate change scenario, supply chain analysis, value chain analysis, raw material/consumables overview, vendor selection criteria, PESTLE Analysis, Porter Analysis, and regulatory framework. |
Virtual Pipeline Systems Market Trends
“Increasing Adoption of Advanced Compression and Cryogenic Technologies”
- The North America Virtual Pipeline Systems Market is experiencing a notable trend toward the integration of advanced compression and cryogenic technologies
- These technologies enhance the efficiency and safety of transporting gases such as Compressed Natural Gas (CNG) and Liquefied Natural Gas (LNG), enabling reliable delivery to remote and underserved areas
- Advanced compression systems allow for higher gas volumes to be transported in Type I, Type II, Type III, and Type IV containers, optimizing logistics for various applications
- For instances, companies are deploying improved cryogenic storage tanks for LNG, which maintain extremely low temperatures, ensuring safer and longer storage durations during transportation via Intermodal ISO Tank Containers, Road Tankers, and Local Bobtail Tankers
- This trend is increasing the appeal of virtual pipeline systems for industrial, transportation, commercial, and residential applications, particularly in regions such as Canada, which dominates the market, and the U.S., the fastest-growing region
- These technological advancements also support real-time monitoring and control systems, improving operational safety and reducing risks such as leaks during transportation
Virtual Pipeline Systems Market Dynamics
Driver
“Growing Demand for Clean Energy and Flexible Gas Distribution”
- The rising demand for cleaner energy sources, such as Liquefied Natural Gas (LNG) and Compressed Natural Gas (CNG), is a key driver for the North America Virtual Pipeline Systems Market
- Virtual pipelines provide a flexible and cost-effective solution for delivering natural gas, propane, and other fuels to areas without traditional pipeline infrastructure, particularly in remote industrial hubs in Canada and the U.S
- Government policies in Canada and the U.S. promote the use of natural gas to reduce carbon emissions, supporting applications in industrial power generation, transportation fuel, and commercial and residential heating
- The proliferation of shale gas production and advancements in transportation modes, such as Tanker Rail Cars and Intermodal ISO Tank Containers, are enabling faster and more efficient gas delivery
- Energy companies are increasingly adopting virtual pipeline systems to meet the growing need for reliable energy supply in off-grid areas, enhancing market growth
Restraint/Challenge
“High Initial Costs and Regulatory Complexities”
- The high upfront costs associated with the deployment of virtual pipeline systems, including specialized containers (Type I, Type II, Type III, and Type IV) and transportation infrastructure such as Road Tankers and Tanker Rail Cars, pose a significant barrier, particularly in cost-sensitive markets
- Integrating virtual pipeline systems with existing energy infrastructure can be logistically complex and expensive, especially for retrofitting in older industrial or commercial facilities
- Regulatory uncertainties and safety concerns related to the transportation of flammable gases such as LPG, LNG, and CNG present major challenges. Compliance with diverse safety and environmental regulations across the U.S. and Canada complicates operations for service providers
- The risk of leaks or accidents during transportation via Pipeline Transport, Reticulated Gas Systems, or Local Bobtail Tankers raises safety concerns, potentially deterring adoption in regions with stringent regulations
- These factors may limit market expansion, particularly in areas where traditional pipeline infrastructure remains a viable alternative or where regulatory compliance costs are high
Virtual Pipeline Systems market Scope
The market is segmented on the basis of type, product, container size, mode of transportation, and application.
- By Type
On the basis of type, the North America virtual pipeline systems market is segmented into ordinary type and special type. The ordinary type segment dominated the largest market revenue share of 62.3% in 2024, driven by its widespread use in standard applications for transporting natural gas and other fuels to remote areas. These systems are cost-effective and easier to deploy, making them suitable for a broad range of industries.
The Special Type segment is expected to witness the fastest growth rate of 7.8% from 2025 to 2032, driven by the increasing need for customized solutions for niche applications, such as high-pressure or extreme-temperature environments. Advancements in technology and the demand for specialized transportation for LNG and CNG in challenging terrains further accelerate adoption.
- By Product
On the basis of product, the North America virtual pipeline systems market is segmented into Liquefied Petroleum Gas (LPG), Liquid Natural Gas (LNG), Compressed Natural Gas (CNG), Propane, Diesel, and Oils. The CNG segment dominated with a market revenue share of 38.7% in 2024, driven by its cost-effectiveness and suitability for short to medium-distance transportation, particularly for industrial and transportation applications. CNG’s lower production and storage costs compared to LNG make it a preferred choice for virtual pipeline systems.
The LNG segment is anticipated to experience the fastest growth rate of 8.2% from 2025 to 2032, fueled by its high energy density and suitability for long-haul transportation. The increasing adoption of LNG in heavy-duty vehicles and remote industrial operations, supported by advancements in cryogenic storage, drives this growth.
- By Container Size
On the basis of container size, the North America virtual pipeline systems market is segmented into Type I, Type II, Type III, and Type IV containers. The Type IV segment held the largest market revenue share of 40.2% in 2024, attributed to its lightweight composite materials and high-pressure capabilities, which enhance safety and efficiency in gas transportation. These containers are widely used for CNG and LNG transport due to their durability and compliance with stringent safety regulations.
The Type III segment is expected to witness the fastest growth rate of 7.5% from 2025 to 2032, driven by its increasing use in specialized applications requiring robust, corrosion-resistant containers. The demand for Type III containers is rising in remote and harsh environments, particularly in the mining and construction sectors.
- By Mode of Transportation
On the basis of mode of transportation, the North America virtual pipeline systems market is segmented into Intermodal ISO Tank Containers, Tanker Rail Cars, Pipeline Transport, Reticulated Gas System, Piped Gas System, Road Tankers, and Local Bobtail Tankers. The Road Tankers segment dominated with a market revenue share of 45.6% in 2024, driven by their flexibility and ability to deliver gas to remote and underserved areas lacking pipeline infrastructure. Their widespread use in industrial and commercial applications supports this dominance.
The Intermodal ISO Tank Containers segment is expected to witness the fastest growth rate of 8.9% from 2025 to 2032, driven by their versatility in multimodal transportation (road, rail, and sea). The increasing global trade of LNG and supportive government policies promoting cross-border gas transport fuel this segment’s growth.
- By Application
On the basis of application, the North America virtual pipeline systems market is segmented into Industrial, Transportation, Commercial, and Residential applications. The Industrial segment held the largest market revenue share of 48.4% in 2024, driven by the critical need for reliable energy supply in remote industrial hubs, such as mining, construction, and manufacturing, where traditional pipelines are not feasible. Virtual pipelines ensure consistent delivery of CNG and LNG to these facilities.
The Transportation segment is anticipated to experience the fastest growth rate of 9.1% from 2025 to 2032, fueled by the increasing adoption of CNG and LNG as alternative fuels in long-haul trucking and public transportation. The push for cleaner fuels to reduce carbon emissions and advancements in fuel delivery systems drive this segment’s growth.
Virtual Pipeline Systems Market Regional Analysis
- Canada dominated the North America virtual pipeline systems market with the largest revenue share of 39.8% in 2024, driven by its vast natural gas reserves, robust energy infrastructure, and widespread adoption of virtual pipeline systems in remote communities and industrial sectors
- The U.S. is expected to be the fastest-growing region in the North America virtual pipeline systems market during the forecast period, fueled by increasing investments in LNG and CNG infrastructure, supportive government policies, and rising demand for clean energy solutions
Canada Virtual Pipeline Systems Market Insight
Canada dominated the North America virtual pipeline systems market with the highest revenue share of 88.9% in 2024, fueled by robust natural gas production and strong demand for CNG and LNG in remote industrial hubs, such as mining operations. The country’s focus on reducing carbon emissions and supportive government policies for cleaner energy sources drive market expansion. The integration of advanced technologies, such as modular storage units and cryogenic tanks, complements both industrial and transportation applications, enhancing market penetration.
U.S. Virtual Pipeline Systems Market Insight
The U.S. is expected to witness the fastest growth rate in the North America virtual pipeline systems market, propelled by increasing adoption of CNG and LNG for transportation and industrial applications. Growing consumer and industry awareness of the environmental benefits of natural gas, coupled with advancements in storage and transportation technologies, boosts market expansion. Regulatory support for cleaner energy alternatives and the rise of aftermarket solutions for virtual pipeline systems further accelerate growth in diverse applications.
Virtual Pipeline Systems Market Share
The virtual pipeline systems industry is primarily led by well-established companies, including:
- CERTARUS LTD. (Canada)
- THROTTLE ENERGY INC. (U.S.)
- Clean Fuel Connection Inc. (U.S.)
- Compass Natural Gas (U.S.)
- NG Advantage (U.S.)
- CNG Delivery (U.S.)
- TX Energy Drilling Corporation (U.S.)
- Verdek Green Technologies Corp. (Canada)
- Corban Energy Group. (U.S.)
- Cimarron Composites (U.S.)
- Hexagon Composites ASA (Norway)
- SENER Group (Spain)
- Eni S.p.A. (Italy)
- Rev LNG (U.S.)
What are the Recent Developments in North America Virtual Pipeline Systems Market?
- In May 2023, Superior Plus Corp. completed its C$1.05 billion acquisition of Certarus Ltd., a Canadian leader in virtual pipeline solutions for compressed natural gas (CNG), renewable natural gas (RNG), and hydrogen. This strategic move enhances Superior’s footprint in the low-carbon energy distribution space, aligning with its sustainability goals and expanding its offerings beyond traditional propane and distillates. Certarus shareholders received C$353 million in cash and C$500 million in Superior common shares, representing about 17% pro forma ownership. The acquisition supports Superior’s growth strategy and accelerates its transition toward cleaner energy alternatives
- In May 2022, Quantum Fuel Systems LLC was awarded a $22 million contract by Certarus Ltd. to supply virtual pipeline trailers for compressed natural gas (CNG) distribution. The order included Quantum’s VPLite45/40' trailers, known for their high gas capacity and lightweight design, certified for use in both the U.S. and Canada. These trailers enhance Certarus’s mobile energy delivery network, supporting industrial and utility customers with low-carbon fuel solutions. The partnership reflects ongoing investment in virtual pipeline infrastructure, enabling flexible, sustainable energy access in regions without traditional pipeline connectivity
- In October 2021, CNG Services Ltd launched CNG Connect, a virtual pipeline system utilizing purpose-built trailers to transport compressed natural gas (CNG) to off-grid and remote locations. This turnkey solution offers a cost-effective and environmentally friendly alternative to traditional pipeline infrastructure, enabling flexible gas delivery for industrial, commercial, and utility applications. By bypassing the need for permanent pipelines, CNG Connect supports low-carbon energy transitions and enhances energy access in areas with limited connectivity
- In August 2021, General Electric Company introduced "Gas on Demand", a virtual pipeline system leveraging composite pressure vessels to enable flexible, scalable, and cost-effective natural gas transportation to regions lacking pipeline infrastructure. This innovation supports remote and off-grid areas, offering a cleaner alternative to diesel and other fuels. By using modular, high-pressure containers, the system ensures safe delivery of compressed natural gas (CNG) for industrial, commercial, and utility applications—enhancing energy access while reducing emissions
- In March 2021, NG Advantage LLC introduced the Virtual NG Advantage Pipeline, a mobile energy delivery system designed to transport compressed natural gas (CNG) to customers in remote or underserved areas. Using a fleet of high-capacity, carbon fiber trailers, the system bypasses the need for traditional pipeline infrastructure, enabling safe and reliable access to natural gas for industries such as manufacturing, healthcare, and utilities. This innovation supports low-carbon energy transitions, reduces emissions, and enhances energy resilience—especially in regions facing supply constraints or lacking pipeline connectivity
SKU-

- Interactive Data Analysis Dashboard
- Company Analysis Dashboard for high growth potential opportunities
- Research Analyst Access for customization & queries
- Competitor Analysis with Interactive dashboard
- Latest News, Updates & Trend analysis
- Harness the Power of Benchmark Analysis for Comprehensive Competitor Tracking
North America Virtual Pipeline Systems Market, Supply Chain Analysis and Ecosystem Framework
To support market growth and help clients navigate the impact of geopolitical shifts, DBMR has integrated in-depth supply chain analysis into its North America Virtual Pipeline Systems Market research reports. This addition empowers clients to respond effectively to global changes affecting their industries. The supply chain analysis section includes detailed insights such as North America Virtual Pipeline Systems Market consumption and production by country, price trend analysis, the impact of tariffs and geopolitical developments, and import and export trends by country and HSN code. It also highlights major suppliers with data on production capacity and company profiles, as well as key importers and exporters. In addition to research, DBMR offers specialized supply chain consulting services backed by over a decade of experience, providing solutions like supplier discovery, supplier risk assessment, price trend analysis, impact evaluation of inflation and trade route changes, and comprehensive market trend analysis.
Data collection and base year analysis are done using data collection modules with large sample sizes. The stage includes obtaining market information or related data through various sources and strategies. It includes examining and planning all the data acquired from the past in advance. It likewise envelops the examination of information inconsistencies seen across different information sources. The market data is analysed and estimated using market statistical and coherent models. Also, market share analysis and key trend analysis are the major success factors in the market report. To know more, please request an analyst call or drop down your inquiry.
The key research methodology used by DBMR research team is data triangulation which involves data mining, analysis of the impact of data variables on the market and primary (industry expert) validation. Data models include Vendor Positioning Grid, Market Time Line Analysis, Market Overview and Guide, Company Positioning Grid, Patent Analysis, Pricing Analysis, Company Market Share Analysis, Standards of Measurement, Global versus Regional and Vendor Share Analysis. To know more about the research methodology, drop in an inquiry to speak to our industry experts.
Data Bridge Market Research is a leader in advanced formative research. We take pride in servicing our existing and new customers with data and analysis that match and suits their goal. The report can be customized to include price trend analysis of target brands understanding the market for additional countries (ask for the list of countries), clinical trial results data, literature review, refurbished market and product base analysis. Market analysis of target competitors can be analyzed from technology-based analysis to market portfolio strategies. We can add as many competitors that you require data about in the format and data style you are looking for. Our team of analysts can also provide you data in crude raw excel files pivot tables (Fact book) or can assist you in creating presentations from the data sets available in the report.


