
North America Virtual Reality Vr Health Market
Market Size in USD Billion
 USD
9.67 Billion
USD
94.15 Billion
2024
2032
USD
9.67 Billion
USD
94.15 Billion
2024
2032
| 2025 - 2032 | |
| USD 9.67 Billion | |
| USD 94.15 Billion | |
| % | |
|
Virtual Reality (VR) Health Market Size
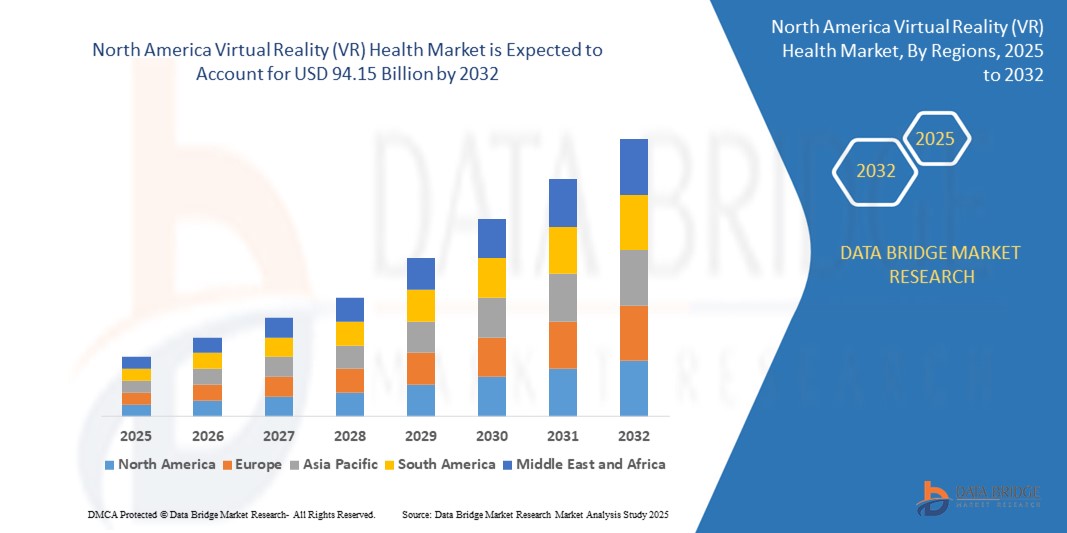
- The North America Virtual Reality (VR) health market size was valued at USD 9.67 billion in 2024 and is expected to reach USD 94.15 billion by 2032, at a CAGR of 32.9% during the forecast period
- The market growth is largely fueled by the increasing integration of virtual reality into healthcare services, driven by advancements in immersive technology, rising digital transformation across medical institutions, and the need for innovative solutions in medical training, therapy, and patient engagement
- Furthermore, the growing prevalence of mental health disorders, chronic pain, and the demand for personalized, non-invasive treatment options are accelerating the adoption of VR-based therapy and rehabilitation. These converging factors are significantly enhancing the value proposition of VR in healthcare, thereby boosting the industry's growth
Virtual Reality (VR) Health Market Analysis
- Virtual reality in healthcare involves the use of immersive, computer-generated environments to support clinical functions such as surgery simulation, exposure therapy, patient care management, and medical education. It enables practitioners and patients to interact with 3D models for diagnostic, training, or therapeutic purposes
- The rising demand for VR in healthcare is driven by its ability to deliver realistic simulations, reduce training risk, and improve patient outcomes. Applications in mental health, pain distraction, and rehabilitation are expanding rapidly, supported by growing investment, regulatory approvals, and integration into mainstream care delivery models
- U.S. dominated the Virtual Reality (VR) health market with a share of 36.5% in 2024, due to the presence of leading VR technology providers, high healthcare expenditure, and early adoption of immersive technologies in medical education, therapy, and rehabilitation
- Canada is expected to be the fastest growing region in the Virtual Reality (VR) health market during the forecast period due to growing investments in digital health transformation and strong government support for mental health and tele-rehabilitation initiatives
- Software segment dominated the market with a market share of 42.5% in 2024, due to the increasing demand for immersive and customizable VR applications across healthcare functions such as surgical simulation, cognitive therapy, and patient education. The rise of AI-integrated platforms, improved software compatibility with medical devices, and the shift toward cloud-based VR solutions have further accelerated adoption. In addition, continuous software updates and scalability make it more cost-effective and accessible for hospitals, clinics, and training institutions
Report Scope and Virtual Reality (VR) Health Market Segmentation
|
Attributes |
Virtual Reality (VR) Health Key Market Insights |
|
Segments Covered |
|
|
Countries Covered |
North America
|
|
Key Market Players |
|
|
Market Opportunities |
|
|
Value Added Data Infosets |
In addition to the market insights such as market value, growth rate, market segments, geographical coverage, market players, and market scenario, the market report curated by the Data Bridge Market Research team includes in-depth expert analysis, import/export analysis, pricing analysis, production consumption analysis, and pestle analysis. |
Virtual Reality (VR) Health Market Trends
“Rising Adoption of VR in Patient Care”
- The VR health market is rapidly expanding as healthcare providers adopt VR technologies for diverse patient care applications including pain management, physical and cognitive rehabilitation, surgical planning, and anxiety reduction
- For instance, companies such as Osso VR, XRHealth, MindMaze, and technology giants such as Microsoft Corporation and Meta Platforms, Inc. are leading innovations in immersive VR platforms that improve patient outcomes and engagement through realistic simulations and therapeutic interventions
- Increasing integration of VR with telemedicine and remote patient monitoring enhances access to care for underserved and rural populations, supporting continuity of treatment and reducing hospital visits
- Growing use of VR for mental healthcare, including treatment of PTSD, anxiety, and phobias via immersive exposure therapy, expands its role beyond traditional physical rehabilitation
- Advances in hardware, such as lightweight high-resolution headsets and AI-powered VR software, improve the realism and clinical efficacy of VR solutions, accelerating clinical adoption
- Rising awareness among healthcare professionals and patients, combined with supportive policies and reimbursement frameworks, drives VR incorporation into mainstream healthcare settings
Virtual Reality (VR) Health Market Dynamics
Driver
“Rising Need for Mental Healthcare”
- Increasing prevalence of mental health disorders and the growing recognition of mental wellness as a priority are driving demand for VR-based therapies that are engaging, effective, and accessible
- For instance, mental health technology companies such as MindMaze, AppliedVR, and Psious develop VR platforms tailored for anxiety, depression, PTSD, and stress management, helping patients overcome conditions through immersive cognitive behavioral therapy and distraction techniques
- VR therapies enable personalized, exposure-based treatments that overcome traditional barriers such as social stigma and limited access to therapists
- Healthcare providers adopt VR to supplement conventional psychiatric and psychological methods, improving patient adherence and treatment outcomes
- Public and private healthcare systems are increasingly investing in VR mental health solutions to reduce hospitalization costs and improve remote care capabilities
Restraint/Challenge
“High Initial Investment”
- The deployment of VR health solutions involves substantial upfront costs for hardware procurement, software development, clinical integration, and training, limiting widespread adoption especially in smaller clinics or low-resource settings
- For instance, institutions working with premium VR technology providers such as Microsoft HoloLens, Oculus (Meta), and specialized platforms such as Osso VR often face steep initial expenses for acquiring headsets, developing customized medical content, and integrating VR within existing health IT infrastructure
- Ongoing maintenance, software updates, and staff training require continuous financial and operational commitments, adding to the total cost of ownership
- Limited insurance reimbursement policies for VR treatments reduce incentives for healthcare providers to invest heavily in these technologies
- The evolving regulatory environment for medical device approval and health data privacy generates additional compliance costs and uncertainty in VR health solution adoption
Virtual Reality (VR) Health Market Scope
The market is segmented on the basis of product, technology, application, therapeutic area, end user, and distribution channel.
- By Product
On the basis of product, the North America VR health market is segmented into hardware, software, and services. The software segment dominated the largest market revenue share of 42.5% in 2024, primarily driven by the increasing demand for immersive and customizable VR applications across healthcare functions such as surgical simulation, cognitive therapy, and patient education. The rise of AI-integrated platforms, improved software compatibility with medical devices, and the shift toward cloud-based VR solutions have further accelerated adoption. In addition, continuous software updates and scalability make it more cost-effective and accessible for hospitals, clinics, and training institutions.
The services segment is anticipated to witness the fastest growth rate from 2025 to 2032, propelled by increasing demand for VR content development, software integration, training, and maintenance. With more healthcare institutions adopting VR-based solutions, service providers are playing a critical role in customizing and supporting end-to-end implementations, which is significantly boosting this segment.
- By Technology
On the basis of technology, the market is segmented into head-mounted technology, gesture-tracking technology, projector and display walls technology, mobile device-based, and others. The head-mounted technology segment held the largest revenue share in 2024, owing to its immersive capabilities and effectiveness in simulating real-world clinical environments. These devices are widely used for surgical simulations, exposure therapy, and rehabilitation, enabling deep sensory involvement and improved procedural accuracy.
The gesture-tracking technology segment is expected to grow at the fastest rate from 2025 to 2032, driven by increasing demand for non-invasive, interactive VR systems. These systems enable natural user interaction, particularly beneficial for physical therapy and neurological rehabilitation, where real-time motion tracking enhances therapeutic outcomes.
- By Application
On the basis of application, the market is segmented into medical training and education, virtual reality exposure therapy, surgery, patient care management, rehabilitation, pain management, and others. The medical training and education segment dominated in 2024, reflecting the region’s strong focus on enhancing medical competency through simulation-based learning. Academic institutions and hospitals are increasingly deploying VR tools to train healthcare professionals in complex procedures without risking patient safety.
Rehabilitation is projected to be the fastest-growing segment through 2032, supported by VR’s effectiveness in motor function recovery, cognitive therapy, and post-injury rehabilitation. The ability to customize programs and track patient progress in real-time is making VR a preferred choice among rehabilitation centers.
- By Therapeutic Area
On the basis of therapeutic area, the market is categorized into craniofacial, cardiovascular, ophthalmology, pulmonary, neurological, sleep disorders, phobias, addictions, post-traumatic stress disorders (PTSD), and others. The neurological segment captured the largest revenue share in 2024, driven by the high prevalence of conditions such as stroke, Parkinson’s disease, and multiple sclerosis across the region. VR-based neurological therapies aid in neuroplasticity and motor rehabilitation, significantly improving patient recovery.
The PTSD segment is expected to register the fastest growth rate from 2025 to 2032, supported by growing clinical validation of VR exposure therapy in treating war veterans and trauma patients. The immersive and controlled environment offered by VR enables safe re-exposure, helping patients gradually confront and process traumatic memories.
- By End User
On the basis of end user, the market is segmented into hospitals, clinics, surgical centers, ambulatory surgical centers, diagnostic centers, rehabilitation centers, long-term care facilities, mental health institutions, and others. Hospitals accounted for the largest revenue share in 2024 due to early adoption of advanced VR technologies for surgical planning, training, and patient engagement. Budget allocations for tech-enabled care models in large hospital systems further drive this dominance.
Rehabilitation centers are projected to witness the fastest growth from 2025 to 2032, propelled by the effectiveness of VR tools in enhancing physical therapy outcomes and patient motivation. These centers increasingly rely on gamified VR platforms for pain distraction, mobility training, and progress monitoring.
- By Distribution Channel
On the basis of distribution channel, the market is divided into direct tenders, retail sales, and third-party distributors. The direct tenders segment dominated the market in 2024, as large-scale procurement by hospitals and public healthcare institutions remains a key driver. Government-funded initiatives and research programs often procure VR solutions via direct contracts, ensuring high-volume deployments.
Retail sales are projected to be the fastest-growing channel through 2032, fueled by the growing availability of VR health products via e-commerce platforms and authorized retail outlets. Increasing awareness and self-health management among consumers are also driving individual purchases of VR devices for pain relief, cognitive therapy, and guided meditation.
Virtual Reality (VR) Health Market Regional Analysis
- U.S. dominated the Virtual Reality (VR) health market with the largest revenue share of 36.5% in 2024, driven by the presence of leading VR technology providers, high healthcare expenditure, and early adoption of immersive technologies in medical education, therapy, and rehabilitation
- The country benefits from strong collaborations between tech companies and healthcare institutions, enabling rapid integration of VR into clinical workflows, surgical training, and pain management. Major universities and hospitals are increasingly using VR platforms for interactive learning, patient engagement, and mental health treatment
- Federal support for digital health innovation, along with rising demand for non-invasive treatment modalities and personalized care, continues to accelerate market growth. The expanding use of VR for PTSD, phobia treatment, and physical therapy is further enhancing adoption across healthcare segments
Canada Virtual Reality (VR) Health Market Insight
Canada is projected to register the fastest CAGR in the North America VR health market from 2025 to 2032, fueled by growing investments in digital health transformation and strong government support for mental health and tele-rehabilitation initiatives. Programs such as Canada’s Digital Health Interoperability Action Plan and regional funding for VR in physical therapy and surgical planning are driving adoption. The presence of research hubs in Ontario and British Columbia is strengthening development of localized VR solutions tailored for public healthcare systems.
Mexico Virtual Reality (VR) Health Market Insight
Mexico is expected to witness steady growth in the VR health market between 2025 and 2032, supported by expanding private healthcare infrastructure and increasing interest in affordable VR-based therapeutic tools. The country’s urban hospitals and specialty clinics are beginning to implement VR for pain distraction, physical therapy, and mental health support. Public-private partnerships and collaborations with U.S. tech firms are also aiding pilot programs for VR use in patient education and post-operative care, gradually strengthening the ecosystem for immersive healthcare technologies.
Virtual Reality (VR) Health Market Share
The Virtual Reality (VR) health industry is primarily led by well-established companies, including:
- SyncThink Inc (U.S.)
- AppliedVR (U.S.)
- Koninklijke Philips N.V. (Netherlands)
- EchoPixel (U.S.)
- Psious (Spain)
- Firsthand Technology Inc (U.S.)
- MindMaze Inc (Switzerland)
- Augmedix, Inc (U.S.)
- VirtaMed AG (Switzerland)
- Vivid Vision, Inc (U.S.)
- Osso VR, Inc (U.S.)
- ImmersiveTouch, Inc (U.S.)
- CAE Inc (Canada)
- Microsoft (U.S.)
- General Electric (U.S.)
- Medical Realities Ltd (U.K.)
- Siemens Healthineers (Germany)
- Facebook (U.S.)
Latest Developments in North America Virtual Reality (VR) Health Market
- In July 2025, DataArt, a global software engineering company specializing in data, analytics, and AI, partnered with German-based Lab E GmbH (operating under the brand “virtuallythere”) to introduce a next-generation virtual reality platform tailored for psychotherapists. This collaboration represents a major leap forward in the field of digital mental health, as the VR system offers immersive, clinically validated exposure therapy for conditions such as anxiety, depression, and stress-related disorders. By integrating advanced software engineering with mental health treatment protocols, this platform is expected to significantly enhance the scalability, accessibility, and personalization of therapy, fueling adoption of VR tools in behavioral health treatment across Europe and beyond
- In September 2022, Novant Health pioneered the integration of AI-powered virtual reality in leadership development by launching its first-ever VR-based training program for healthcare executives. This initiative showcased the expanding utility of VR beyond clinical and educational applications into organizational development. By harnessing immersive scenarios and real-time decision-making simulations, the program set a precedent for how healthcare institutions can strengthen executive skills and team performance. The launch advanced Novant Health’s internal leadership capabilities and also underscored the growing demand for VR-driven soft skills training in the healthcare sector
- In June 2022, MediSim transformed medical education in India by establishing the country’s first fully automated Virtual Reality lab at the Puducherry Institute of Medical Sciences (PIMS), specifically designed for MBBS students. This landmark development marked a shift toward immersive, hands-on medical learning in India’s healthcare education landscape. By simulating complex clinical scenarios in a risk-free environment, the VR lab aims to enhance diagnostic accuracy, procedural confidence, and clinical preparedness among future doctors. The initiative has paved the way for wider integration of immersive technologies in medical colleges across the country, boosting the growth of VR in academic healthcare training
- In August 2021, AppliedVR strengthened its clinical credibility and market reach by partnering with Curebase to conduct five VR-based clinical trials focused on chronic pain management. Utilizing Curebase’s decentralized trial platform, the collaboration aimed to generate real-world evidence on the efficacy of VR as a therapeutic modality. This strategic move was instrumental in substantiating VR’s role as a viable digital therapeutic, helping AppliedVR secure broader clinical acceptance and potential regulatory support. It also highlighted the critical role of empirical validation in expanding VR’s adoption in mainstream healthcare
- In April 2021, SyncThink Inc joined forces with Pico Interactive and Tobii to develop an advanced virtual reality solution that integrated brain health monitoring and performance tracking. The solution combined SyncThink’s neurotechnology with Tobii’s eye-tracking and Pico’s VR hardware, targeting applications in cognitive assessment and neurological rehabilitation. This collaboration addressed growing consumer and clinical demands for non-invasive diagnostic tools, especially in sports medicine and neuro-rehabilitation. The partnership emphasized the convergence of hardware and cognitive analytics, propelling innovation in VR-based brain health assessment and enhancing its commercial and clinical viability
SKU-

- Interactive Data Analysis Dashboard
- Company Analysis Dashboard for high growth potential opportunities
- Research Analyst Access for customization & queries
- Competitor Analysis with Interactive dashboard
- Latest News, Updates & Trend analysis
- Harness the Power of Benchmark Analysis for Comprehensive Competitor Tracking
Data collection and base year analysis are done using data collection modules with large sample sizes. The stage includes obtaining market information or related data through various sources and strategies. It includes examining and planning all the data acquired from the past in advance. It likewise envelops the examination of information inconsistencies seen across different information sources. The market data is analysed and estimated using market statistical and coherent models. Also, market share analysis and key trend analysis are the major success factors in the market report. To know more, please request an analyst call or drop down your inquiry.
The key research methodology used by DBMR research team is data triangulation which involves data mining, analysis of the impact of data variables on the market and primary (industry expert) validation. Data models include Vendor Positioning Grid, Market Time Line Analysis, Market Overview and Guide, Company Positioning Grid, Patent Analysis, Pricing Analysis, Company Market Share Analysis, Standards of Measurement, Global versus Regional and Vendor Share Analysis. To know more about the research methodology, drop in an inquiry to speak to our industry experts.
Data Bridge Market Research is a leader in advanced formative research. We take pride in servicing our existing and new customers with data and analysis that match and suits their goal. The report can be customized to include price trend analysis of target brands understanding the market for additional countries (ask for the list of countries), clinical trial results data, literature review, refurbished market and product base analysis. Market analysis of target competitors can be analyzed from technology-based analysis to market portfolio strategies. We can add as many competitors that you require data about in the format and data style you are looking for. Our team of analysts can also provide you data in crude raw excel files pivot tables (Fact book) or can assist you in creating presentations from the data sets available in the report.


