
North America Viscosupplementation Market
Market Size in USD Billion
 USD
1.97 Billion
USD
3.83 Billion
2025
2033
USD
1.97 Billion
USD
3.83 Billion
2025
2033
| 2026 - 2033 | |
| USD 1.97 Billion | |
| USD 3.83 Billion | |
| % | |
|
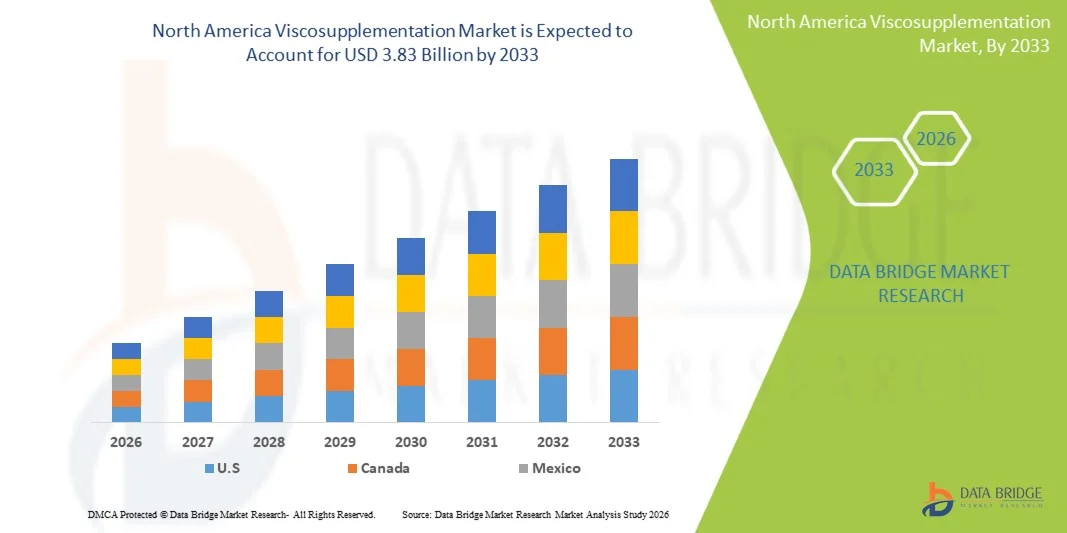
North America Viscosupplementation Market Overview
The North America viscosupplementation market was valued at USD 1.97 billion in 2025 and is projected to reach USD 3.83 billion by 2033, growing at a CAGR of 8.7% from 2026 to 2033. The market is experiencing steady growth driven by the rising prevalence of osteoarthritis, increasing aging population, and growing preference for minimally invasive, non-surgical treatment options for knee and joint pain management.
The expanding adoption of hyaluronic acid-based injections across orthopedic clinics and hospitals, along with increasing awareness of early-stage osteoarthritis treatment, is further supporting market expansion. In addition, continuous advancements in formulation efficacy, longer-lasting viscosupplement products, and improving reimbursement frameworks in North America are encouraging both patients and healthcare providers to opt for viscosupplementation therapies as an alternative to surgical interventions such as knee replacement.
Key Market Trends & Insights
- The United States dominated the North America viscosupplementation market with the largest revenue share of 85.8% in 2025, supported by high osteoarthritis prevalence, strong adoption of hyaluronic acid injections, and advanced orthopedic care infrastructure.
- The Non-Animal Origin segment led the market with a 70.75% share in 2025, driven by strong preference for bioengineered hyaluronic acid formulations that offer improved safety, purity, and consistent molecular structure.
- Canada is expected to be the fastest-growing country in the North America viscosupplementation market, registering a CAGR of 5.4% from 2026 to 2033, fueled by rising osteoarthritis awareness, increasing geriatric population, and expanding access to minimally invasive orthopedic treatments
- Animal Origin are the fastest-growing source type, projected to register a CAGR of 5.4%, reflecting the surge in relatively lower cost and continued use in price-sensitive healthcare settings.
- The Geriatric segment dominated the age group category with a 65.70% revenue share in 2025, led by the high prevalence of osteoarthritis in elderly populations across North America.
- Three-Injection accounted for 40.45% of the market, preferred by orthopedic specialists and physicians for its balanced efficacy, cost-effectiveness, and well-established clinical outcomes in treating moderate to severe osteoarthritis patients requiring sustained symptom relief over multiple weeks.
- The Low Molecular Weight segment is the fastest-growing molecular weight category, with a CAGR of 6.0%, driven by its lower cost and wider accessibility across outpatient and mid-tier healthcare settings.
Market Size & Forecast
- Global Market Value (2025): USD 1.97 Billion
- Expected Market Value (2033): USD 3.83 Billion
- Forecast CAGR (2026–2033): 8.7%
- Leading Country in 2025: United States
- Fastest Growing Country: Canada
Report Scope and North America Viscosupplementation Market Segmentation
|
Attributes |
North America Viscosupplementation Key Market Insights |
|
Segments Covered |
|
|
Countries Covered |
North America · U.S. · Canada · Mexico |
|
Key Market Players |
· Sanofi (France) · Fidia Farmaceutici S.p.A. (Italy) · Anika Therapeutics, Inc. (U.S.) · Seikagaku Corporation (Japan) · LG Chem, Ltd. (South Korea) · Shandong Haohai Biological Technology Co., Ltd. (China) · Meiji Seika Pharma Co., Ltd. (Japan) · Daiichi Sankyo Company, Limited (Japan) · Chugai Pharmaceutical Co., Ltd. (Japan) · Kyowa Kirin Co., Ltd. (Japan) · Teva Pharmaceutical Industries Ltd. (Israel) · Zimmer Biomet (U.S.) · Johnson & Johnson Services, Inc. (U.S.) · Bioventus Inc. (U.S.) · Hyaltech Ltd. (U.K.) · Contura International A/S (Denmark) · Smith & Nephew (U.K.) · Rottapharm Madaus S.p.A. (Italy) · Arthrex, Inc. (U.S.) · Bausch Health (Canada) |
|
Market Opportunities |
· Rising adoption of hyaluronic acid injections in early-stage osteoarthritis patients · Expansion of private orthopedic chains and specialty clinics · Increasing clinical preference for single-injection and high–molecular weight formulations |
|
Value Added Data Infosets |
In addition to the insights on market scenarios such as market value, growth rate, segmentation, geographical coverage, and major players, the market reports curated by the Data Bridge Market Research also include in-depth expert analysis, patient epidemiology, pipeline analysis, pricing analysis, and regulatory framework. |
North America Viscosupplementation Market Trends
Trend: Rising Preference for Non-Surgical Osteoarthritis Management Solutions
The increasing burden of knee osteoarthritis across aging populations is driving strong demand for viscosupplementation as a minimally invasive alternative to surgical interventions. Patients and physicians are increasingly preferring hyaluronic acid injections because they offer a balance between symptom relief and functional improvement without the risks, long recovery periods, and high costs associated with knee replacement surgery. This shift is also being reinforced by growing awareness of early-stage osteoarthritis management, where intervention at the right time can significantly delay disease progression. At the same time, improvements in formulation stability and viscosity retention are extending the duration of relief, making these therapies more attractive in routine orthopedic care.
For instance, repeated-cycle HA injection therapy is increasingly integrated into long-term treatment plans for chronic knee osteoarthritis patients in orthopedic clinics.
North America Viscosupplementation Market Dynamics
Key Market Driver: Rising Geriatric Population and Osteoarthritis Prevalence
The steady increase in the elderly population across North America is one of the strongest structural drivers of the viscosupplementation market. Aging is directly linked to cartilage degeneration, reduced synovial fluid quality, and increased joint pain, all of which significantly raise the incidence of osteoarthritis. This demographic shift is creating sustained demand for injectable therapies that can improve mobility and quality of life without surgical intervention. In addition, obesity rates and physically demanding lifestyles in certain population groups are contributing to earlier onset of joint disorders, further widening the patient base. Healthcare providers are also increasingly recommending viscosupplementation earlier in the treatment pathway, particularly when conventional painkillers and physiotherapy are insufficient.
For instance, orthopedic practices in the United States are reporting higher volumes of hyaluronic acid injection procedures among patients aged 55–75 years as first-line injectable therapy.
Key Restraint/Challenge: High Treatment Cost and Limited Insurance Coverage
Despite strong clinical demand, the market faces a notable barrier in the form of high treatment costs and inconsistent reimbursement frameworks. Viscosupplementation often requires multiple injection cycles depending on disease severity and patient response, which increases cumulative treatment expenses. Insurance coverage policies vary significantly across providers and are often restricted to specific osteoarthritis stages, limiting early intervention opportunities. This creates affordability challenges, particularly for elderly patients who may require long-term or repeat therapies. In addition, out-of-pocket expenses can discourage adherence to full treatment cycles, reducing overall clinical effectiveness.
For instance, in several U.S. healthcare plans, coverage is only approved after failure of conservative treatments such as NSAIDs or physiotherapy, delaying access to injections.
Key Market Opportunity: Advancements in Formulations and Extended-Release Therapies
Continuous innovation in viscosupplementation formulations is opening new growth opportunities by improving treatment efficiency, patient compliance, and clinical outcomes. Manufacturers are focusing on high-molecular-weight hyaluronic acid, cross-linked gels, and single-injection formulations that provide longer-lasting pain relief with fewer clinical visits. These advancements are particularly important in outpatient orthopedic settings where convenience and reduced procedural burden are key decision factors. In parallel, research into combination therapies involving platelet-rich plasma (PRP) and regenerative medicine is expanding the potential scope of treatment beyond traditional symptom management.
For instance, next-generation extended-release HA formulations are increasingly being adopted in U.S. orthopedic clinics to reduce injection frequency while maintaining sustained joint lubrication effects.
North America Viscosupplementation Market Scope
The North America viscosupplementation market is segmented on the basis of source, age group, injection type, molecular weight, end user, and distribution channel.
- By Source
On the basis of source, the North America viscosupplementation market is segmented into animal origin and non-animal origin. The Non-Animal Origin segment dominated the market with a 70.75% share in 2025, driven by strong preference for bioengineered hyaluronic acid formulations that offer improved safety, purity, and consistent molecular structure. These products are widely accepted in clinical practice due to reduced risk of immunogenic reactions and better regulatory alignment in the United States and Canada. Increasing adoption across orthopedic clinics and hospitals is reinforcing demand for fermentation-based HA production. Physicians prefer non-animal origin products due to predictable clinical outcomes and higher patient tolerance. Continuous innovation in bacterial fermentation technology is enhancing scalability and cost efficiency. Growing ethical concerns and demand for vegan-compatible medical products are further strengthening dominance.
The Animal Origin segment is the fastest-growing, expanding at a CAGR of 5.4% from 2026 to 2033, driven by its relatively lower cost and continued use in price-sensitive healthcare settings. Despite concerns around immunogenicity, improved purification and processing techniques are enhancing safety and clinical acceptance. Some clinicians still prefer animal-derived HA due to its long-established clinical history and effectiveness in certain patient groups. Expanding demand in cost-sensitive outpatient clinics is further supporting adoption. In addition, availability in multiple dosing formats increases treatment flexibility. Growing penetration in smaller healthcare facilities is accelerating gradual market expansion.
- By Age Group
On the basis of age group, the market is segmented into geriatric and adults. The Geriatric segment dominated the market with a 65.70% share in 2025, due to the high prevalence of osteoarthritis in elderly populations across North America. Age-related cartilage degeneration significantly increases the need for viscosupplementation therapies in patients above 60 years. This group represents the largest share of knee osteoarthritis cases requiring injectable treatment. Improved access to healthcare services and insurance coverage supports higher treatment uptake. Physicians frequently recommend viscosupplementation as a non-surgical alternative to knee replacement. Increasing life expectancy continues to expand the patient pool and strengthen dominance.
The Adults segment is the fastest-growing, expanding at a CAGR of 6.8% from 2026 to 2033, driven by rising incidence of early-onset osteoarthritis linked to obesity, sports injuries, and sedentary lifestyles. Increasing participation in high-impact recreational activities is contributing to joint degeneration in younger populations. Earlier diagnosis and improved awareness of joint health are encouraging proactive treatment adoption. Physicians are increasingly recommending viscosupplementation at earlier disease stages to delay progression. Expanding access to outpatient orthopedic care is further supporting uptake among working-age adults. Growing demand for minimally invasive, quick-recovery treatments is accelerating segment growth.
- By Injection
On the basis of injection type, the market is segmented into single injection, three injections, and five injections. The Three-Injection segment dominated the market with a 40.45% share in 2025, as it remains the most widely prescribed regimen in clinical practice across North America. It provides an optimal balance between efficacy, cost, and treatment duration for moderate to severe osteoarthritis cases. Physicians prefer this protocol due to strong clinical validation and predictable outcomes. Insurance reimbursement frameworks in several cases continue to favor multi-dose cycles. It is widely used in hospitals and orthopedic clinics due to established treatment guidelines. Strong clinical familiarity and long-term usage history reinforce its dominance.
The Single-Injection segment is the fastest-growing, registering a CAGR of 6.0% from 2026 to 2033, driven by rising demand for convenience and reduced clinic visits. These formulations significantly improve patient compliance, particularly among elderly and mobility-limited populations. Advances in high-molecular-weight HA have improved clinical efficacy comparable to multi-injection regimens. Hospitals and outpatient centers are increasingly adopting single-dose therapies for operational efficiency. Reduced treatment time and faster recovery pathways are key adoption drivers. Strong physician acceptance is accelerating market penetration.
- By Molecular Weight
On the basis of molecular weight, the market is segmented into intermediate molecular weight, low molecular weight, and high molecular weight. The High Molecular Weight segment dominated the market with a 45.50% share in 2025, due to superior viscoelastic properties and longer duration of pain relief. These formulations provide enhanced joint lubrication and improved shock absorption in osteoarthritic knees. Physicians prefer them for moderate to severe cases requiring sustained symptom control. Clinical evidence supports better functional outcomes compared to lower molecular weight alternatives. Increasing use in specialty orthopedic settings reinforces dominance. Demand for long-acting treatment options continues to support leadership.
The Low Molecular Weight segment is the fastest-growing, expanding at a CAGR of 6.0% from 2026 to 2033, driven by its lower cost and wider accessibility across outpatient and mid-tier healthcare settings. These formulations are increasingly preferred in early-stage osteoarthritis cases where long-duration efficacy is less critical. Improved formulation technologies are enhancing their safety profile and reducing injection-related discomfort. Expanding use in cost-sensitive clinics and developing care settings is further accelerating adoption. Physicians often recommend low molecular weight HA for younger and mildly symptomatic patients. Growing demand for affordable viscosupplementation options is a key factor driving rapid segment growth.
- By End User
On the basis of end user, the market is segmented into hospitals, orthopedic clinics, ambulatory care centers, and others. The Orthopedic Clinics segment dominated the market with a 45.50% share in 2025, as these facilities serve as the primary treatment centers for osteoarthritis management. They specialize in joint disorders and minimally invasive injection procedures. High patient volumes and repeat treatment cycles support steady demand. Physicians in these clinics frequently recommend viscosupplementation as first-line injectable therapy. Dedicated musculoskeletal care infrastructure strengthens procedural efficiency. Expansion of specialty orthopedic networks further reinforces dominance.
The Ambulatory Care Centers segment is the fastest-growing, registering a CAGR of 6.6% from 2026 to 2033, driven by the shift toward outpatient-based healthcare delivery. These centers offer cost-effective, convenient, and faster treatment options compared to hospitals. Increasing preference for same-day procedures is boosting adoption. Improved procedural safety and efficiency are supporting expansion. Healthcare decentralization across North America is further accelerating growth. Patient preference for reduced waiting times and lower costs is a key driver.
- By Distribution Channel
On the basis of distribution channel, the market is segmented into direct tender and retail sales. The Direct Tender segment dominated the market with a 60.65% share in 2025, due to bulk procurement by hospitals, orthopedic clinics, and healthcare systems. This channel ensures cost efficiency, stable supply, and long-term procurement contracts. Government-backed healthcare systems and large hospital networks rely heavily on tender-based sourcing. Manufacturers prefer this channel for predictable demand and pricing stability. Institutional purchasing dominates due to high procedure volumes. Strong supplier–buyer relationships further reinforce dominance.
The Retail Sales segment is the fastest-growing, registering a CAGR of 6.8% from 2026 to 2033, driven by rising outpatient prescriptions and expansion of specialty pharmacy distribution networks. Increasing patient access through retail healthcare channels is supporting growth. Digital healthcare integration and e-prescription systems are improving accessibility. Patients prefer convenient access outside hospital environments. Expansion of pharmacy-led chronic care management is further accelerating adoption. Growing awareness of injectable osteoarthritis therapies is strengthening demand.
North America Viscosupplementation Market Regional Analysis
The United States dominated the North America viscosupplementation market with the largest revenue share of 85.8% in 2025, supported by high osteoarthritis prevalence, strong adoption of hyaluronic acid injections, and advanced orthopedic care infrastructure. The country benefits from a mature clinical ecosystem where viscosupplementation is widely integrated into standard osteoarthritis treatment pathways, particularly for patients seeking non-surgical pain management options. Strong availability of specialized orthopedic clinics, ambulatory surgical centers, and hospital-based sports medicine departments ensures broad patient access across urban and suburban regions. The market is further strengthened by increasing demand from an aging population, as age-related cartilage degeneration continues to drive a large share of treatment volumes. In addition, rising cases of obesity and sports-related joint injuries are expanding the younger patient base requiring injectable joint therapies
The U.S. Viscosupplementation Market Insight
The U.S. viscosupplementation market is witnessing strong growth due to the rising prevalence of knee osteoarthritis, increasing geriatric population, and high adoption of hyaluronic acid injection therapies. The country’s advanced orthopedic healthcare system, along with widespread availability of outpatient clinics and ambulatory surgical centers, is driving demand across minimally invasive treatment options. In addition, strong physician preference for non-surgical pain management and increasing awareness of early osteoarthritis intervention are accelerating market adoption. Continuous innovation in single-injection and high-molecular-weight formulations is further strengthening treatment efficiency and patient outcomes.
Canada Viscosupplementation Market Insight
The Canada viscosupplementation market is experiencing steady growth, supported by increasing osteoarthritis awareness, rising elderly population, and expanding access to orthopedic care services. Growing emphasis on reducing surgical interventions and improving mobility in aging patients is driving adoption of hyaluronic acid injections across clinical settings. The country also benefits from improving healthcare infrastructure and increasing availability of outpatient treatment options. In addition, rising preference for minimally invasive therapies and gradual expansion of reimbursement coverage are supporting market penetration.
Mexico Viscosupplementation Market Insight
The Mexico viscosupplementation market is growing steadily due to increasing cases of osteoarthritis, improving healthcare access, and rising awareness of injectable joint therapies. Expanding urban healthcare infrastructure and growing presence of orthopedic clinics are supporting wider adoption of viscosupplementation treatments. The market is also benefiting from increasing demand for cost-effective pain management solutions in outpatient settings. In addition, gradual improvements in healthcare spending and rising patient inclination toward non-surgical treatments are contributing to market growth across the country.
North America Viscosupplementation Market Share
The North America viscosupplementation industry is primarily led by well-established companies, including:
- Sanofi (France)
- Fidia Farmaceutici S.p.A. (Italy)
- Anika Therapeutics, Inc. (U.S.)
- Seikagaku Corporation (Japan)
- LG Chem, Ltd. (South Korea)
- Shandong Haohai Biological Technology Co., Ltd. (China)
- Meiji Seika Pharma Co., Ltd. (Japan)
- Daiichi Sankyo Company, Limited (Japan)
- Chugai Pharmaceutical Co., Ltd. (Japan)
- Kyowa Kirin Co., Ltd. (Japan)
- Teva Pharmaceutical Industries Ltd. (Israel)
- Zimmer Biomet (U.S.)
- Johnson & Johnson Services, Inc. (U.S.)
- Bioventus Inc. (U.S.)
- Hyaltech Ltd. (U.K.)
- Contura International A/S (Denmark)
- Smith & Nephew (U.K.)
- Rottapharm Madaus S.p.A. (Italy)
- Arthrex, Inc. (U.S.)
- Bausch Health (Canada)
Latest Developments in North America Viscosupplementation Market
- In February 2025, Evolus Inc. announced U.S. FDA approval of Evolysse™ Form and Evolysse™ Smooth injectable hyaluronic acid gels, marking its entry into the U.S. hyaluronic acid injectable market through a new portfolio of advanced HA-based products. This approval expanded the company’s presence in the broader hyaluronic acid injection segment, which includes applications across aesthetic and joint-related injectable technologies. The launch is expected to strengthen innovation in HA-based formulations by introducing next-generation technology designed to improve durability and performance
- In December 2023, Bioventus Inc., a leading orthobiologics company, announced a nationwide agreement with Aetna Medicare Advantage plans to expand coverage for DUROLANE®, a single-injection hyaluronic acid viscosupplementation therapy for knee osteoarthritis in the United States. This development significantly improved patient access by strengthening reimbursement pathways and expanding insurance coverage under Medicare Advantage programs. It enhanced DUROLANE’s adoption across orthopedic clinics and ambulatory care centers by reducing financial barriers for patients and simplifying prescribing processes for physicians
- In April 2023, Anika Therapeutics maintained regulatory compliance and manufacturing continuity updates for its Orthovisc® and Monovisc® viscosupplementation products in the United States, ensuring uninterrupted availability of hyaluronic acid injection therapies. These products are widely used high-molecular-weight viscosupplementation options for knee osteoarthritis management in orthopedic clinics and hospitals. The updates reinforced product quality assurance, supply chain stability, and adherence to FDA regulatory standards
- In May 2022, Bioventus Inc. announced a nationwide commercial agreement with Cigna, expanding insurance coverage for DUROLANE® and GELSYN-3 viscosupplementation products across the United States. This agreement broadened patient access to both single-injection and multi-injection hyaluronic acid therapies under commercial insurance plans. It improved affordability and supported wider adoption across orthopedic clinics and outpatient care facilities
- In February 2021, the American Academy of Orthopaedic Surgeons (AAOS) updated its clinical practice guideline for knee osteoarthritis, recommending against the routine use of hyaluronic acid injections for most patients. This update influenced clinical decision-making across North America by making viscosupplementation use more selective and patient-specific in orthopedic practice. While it did not eliminate usage entirely, it impacted prescribing behavior in hospitals and clinics, particularly for mild to moderate cases
SKU-

- Interactive Data Analysis Dashboard
- Company Analysis Dashboard for high growth potential opportunities
- Research Analyst Access for customization & queries
- Competitor Analysis with Interactive dashboard
- Latest News, Updates & Trend analysis
- Harness the Power of Benchmark Analysis for Comprehensive Competitor Tracking
Data collection and base year analysis are done using data collection modules with large sample sizes. The stage includes obtaining market information or related data through various sources and strategies. It includes examining and planning all the data acquired from the past in advance. It likewise envelops the examination of information inconsistencies seen across different information sources. The market data is analysed and estimated using market statistical and coherent models. Also, market share analysis and key trend analysis are the major success factors in the market report. To know more, please request an analyst call or drop down your inquiry.
The key research methodology used by DBMR research team is data triangulation which involves data mining, analysis of the impact of data variables on the market and primary (industry expert) validation. Data models include Vendor Positioning Grid, Market Time Line Analysis, Market Overview and Guide, Company Positioning Grid, Patent Analysis, Pricing Analysis, Company Market Share Analysis, Standards of Measurement, Global versus Regional and Vendor Share Analysis. To know more about the research methodology, drop in an inquiry to speak to our industry experts.
Data Bridge Market Research is a leader in advanced formative research. We take pride in servicing our existing and new customers with data and analysis that match and suits their goal. The report can be customized to include price trend analysis of target brands understanding the market for additional countries (ask for the list of countries), clinical trial results data, literature review, refurbished market and product base analysis. Market analysis of target competitors can be analyzed from technology-based analysis to market portfolio strategies. We can add as many competitors that you require data about in the format and data style you are looking for. Our team of analysts can also provide you data in crude raw excel files pivot tables (Fact book) or can assist you in creating presentations from the data sets available in the report.


