
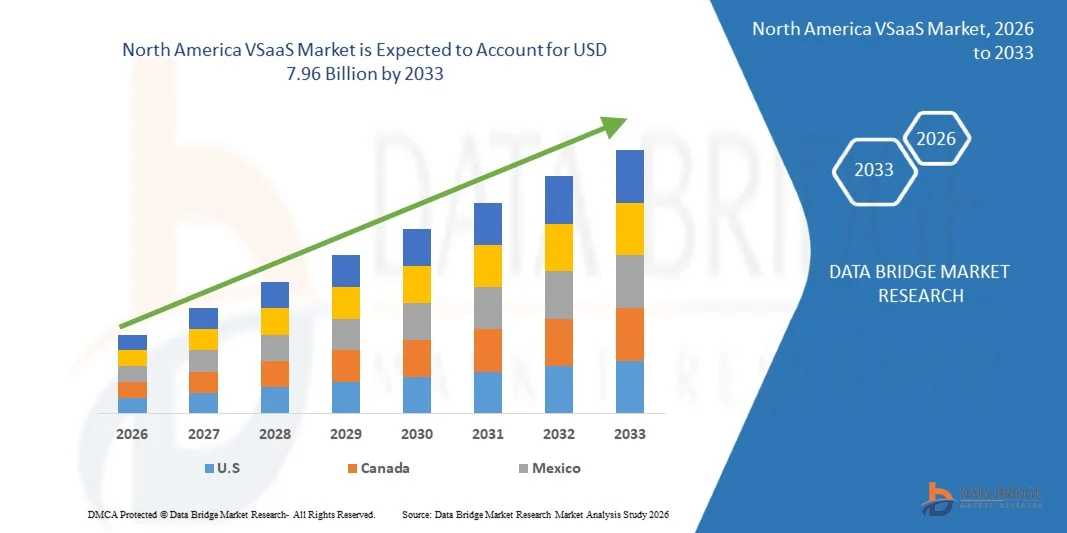
North America Vsaas Market
Market Size in USD Billion
 USD
2.40 Billion
USD
7.96 Billion
2025
2033
USD
2.40 Billion
USD
7.96 Billion
2025
2033
| 2026 - 2033 | |
| USD 2.40 Billion | |
| USD 7.96 Billion | |
| % | |
|
VSaaS Market Size
- The North America VSaaS market size was valued at USD 2.40 billion in 2025and is expected to reach USD 7.96 billion by 2033, at a CAGR of 16.8% during the forecast period
- The market growth is primarily driven by the increasing demand for cloud-based video surveillance solutions, rising adoption of IoT-enabled and AI-powered cameras, and growing emphasis on security and remote monitoring across commercial, industrial, and residential sectors.
- Additionally, continuous technological advancements in cloud computing, analytics, and storage infrastructure, increasing investments in security systems, and the need for cost-effective, scalable, and remotely accessible surveillance solutions are further accelerating the adoption of VSaaS, thereby boosting overall market growth.
VSaaS Market Analysis
- The market growth is driven by the rising demand for interactive, secure, and cloud-based video surveillance solutions, increasing adoption of IoT-enabled and AI-powered cameras, and the emphasis on enhanced security and remote monitoring across commercial, industrial, and residential sectors.
- Continuous technological innovations, such as advanced analytics, cloud storage, and smart integrations, coupled with growing investments in surveillance infrastructure, are further accelerating the adoption of VSaaS in North America.
- S. emerged as the largest revenue-generating country in the VSaaS market, accounting for 77.41% share in 2025, supported by advanced infrastructure and government-backed initiatives.
- Canada is expected to be the fastest-growing region with the CAGR of 18.2% during the forecast period, driven by rising urbanization, increasing adoption of smart surveillance technologies, and growing investments in cloud-based and connected monitoring systems.
- Hosted VSaaS is the dominating segment with a 35.95% share in 2025, owing to its scalability, remote accessibility, and lower upfront costs compared to on-premise solutions.
Report Scope and VSaaS Market Segmentation
|
Attributes |
VSaaS Key Market Insights |
|
Segments Covered |
|
|
Countries Covered |
North America · U.S. · Canada · Mexico |
|
Key Market Players |
· AllGoVision Technologies Pvt. Ltd. (India) · Arlo (U.S.) · Camcloud (U.S.) · Cisco Systems, Inc. (U.S.) · Dahua Technology Co., Ltd. (China) · Genetec Inc. (Canada) · Gorilla Technology Group (Taiwan) · Graymatics Inc. (U.S.) · Hangzhou Hikvision Digital Technology Co., Ltd. (China) · Hexagon AB (Sweden) · Honeywell International Inc. (U.S.) · intuVision, Inc. (U.S.) · Irisity AB (Sweden) · ISS Corp. (Denmark) · Ivideon (Russia) · Johnson Controls (U.S.) · Milestone Systems A/S (Denmark) · Morphean SA (Luxembourg) · Motorola Solutions, Inc. (U.S.) · PureTech Systems (U.S.) · Rhombus Systems, Inc. (U.S.) · Robert Bosch GmbH (Germany) · Securitas AB (Sweden) · Vaidio (U.S.) · Verint (U.S.) · Verkada Inc. (U.S.) · Videoloft (U.S.) |
|
Market Opportunities |
· Growing smart city initiatives globally present opportunities to integrate VSaaS for traffic, public safety, and urban infrastructure monitoring. · Advanced AI-powered analytics such as facial recognition, behavior detection, and predictive alerts create new value-added services for VSaaS providers. · SMEs seeking cost-effective security solutions represent a largely untapped market segment for VSaaS adoption. |
|
Value Added Data Infosets |
In addition to the market insights such as market value, growth rate, market segments, geographical coverage, market players, and market scenario, the market report curated by the Data Bridge Market Research team includes in-depth expert analysis, import/export analysis, pricing analysis, production consumption analysis, and pestle analysis. |
VSaaS Market Trends
“Integration of AI and Analytics”
- AI-enabled VSaaS platforms can detect unusual activities, unauthorized access, and potential security breaches in real time.
- Machine learning algorithms identify people, vehicles, and objects, reducing false alarms and improving monitoring efficiency.
- AI analyzes behavioral patterns to detect suspicious or abnormal behavior in public spaces, retail stores, or industrial facilities. Analytics-driven systems automatically trigger alerts to security personnel or management when predefined conditions are met.
- AI integration supports identification and verification of individuals, enhancing secure entry and facility management. Historical data analysis enables forecasting of security risks and proactive mitigation strategies.
- AI-powered VSaaS integrates with IoT devices, access control, and building management systems for centralized operations. By automating monitoring and analysis, AI reduces manual surveillance effort, allowing security teams to focus on critical tasks
VSaaS Market Dynamics
Driver
“Growing Adoption of Cloud Infrastructure Across Enterprises Enables Scalable and Flexible Video Surveillance Solutions Without Heavy Upfront Capital Expenditure”
- The adoption of cloud infrastructure across enterprises has increasingly been recognized as a transformative factor in the video surveillance sector. Traditional on-premises surveillance systems often required significant capital investment in servers, storage devices, and IT personnel to maintain and upgrade infrastructure. With the migration to cloud-based solutions, organizations are now able to access scalable surveillance platforms without the need for large upfront expenditures. Surveillance operations are streamlined as system updates, maintenance, and data storage responsibilities are shifted to cloud service providers. Flexibility in resource allocation has been enabled, allowing enterprises to expand or reduce capacity based on evolving security requirements.
- For instance, As reported by Milestone Systems’ official press release in March 2026, i‑PRO enabled camera‑to‑cloud connectivity within Milestone’s Arcules video surveillance‑as‑a‑service (VSaaS) platform, allowing selected cameras to transmit video and metadata directly into the cloud without requiring any on‑site servers or hardware gateways. The integration delivers centralized cloud video management, live monitoring, playback, mobile access, and alert tools across distributed environments while simplifying infrastructure deployment for enterprises. This development supports the pointer by showing how cloud‑managed video surveillance infrastructure removes the need for heavy capital outlay on on‑premises servers, enabling scalable and flexible surveillance across multiple sites.
- The adoption of cloud infrastructure has enabled enterprises to deploy scalable and flexible video surveillance systems without heavy upfront investment. Operational efficiency and centralized management are enhanced as maintenance, storage, and updates are handled by cloud providers. Remote monitoring, advanced analytics, and AI-based features are seamlessly integrated, while cost predictability and scalability are ensured. Overall, cloud-based VSaaS has become a strategic solution for modern enterprises seeking agile, resilient, and cost-effective surveillance.
Restraint/Challenge
“Inadequate Internet Infrastructure in Some Regions Restricts Smooth VSaaS Deployment and Video Streaming Quality”
- The deployment of VSaaS solutions has been significantly influenced by the quality and reliability of internet infrastructure across different regions. In areas where broadband networks are slow, unstable, or inconsistently available, cloud-based video streaming and remote access have been hindered. Video footage has been delayed or degraded due to insufficient bandwidth, affecting real-time monitoring and operational efficiency. Organizations have experienced intermittent connectivity interruptions, leading to gaps in surveillance coverage and potential security vulnerabilities. The effectiveness of cloud storage, AI analytics, and automated alerting systems has been compromised when network conditions are suboptimal. Technical teams have been challenged in delivering a seamless VSaaS experience, as buffering and latency issues have disrupted continuous monitoring and emergency response workflows.
- In April 2025, Qualcomm announced its Intelligent Video SaaS offerings via its official press site, which included on‑prem appliances that provide air‑gapped video processing where cloud/Internet connectivity may be constrained. This approach was positioned as a solution when public internet connectivity is insufficient for reliable cloud video streaming.
- In conclusion, Inadequate internet infrastructure in certain regions has been identified as a significant barrier to smooth VSaaS deployment and high-quality video streaming. Limited bandwidth and unstable connectivity affect real-time monitoring, cloud analytics, and remote access, reducing operational efficiency. Organizations are often required to implement hybrid solutions or local processing to maintain service quality. Addressing these infrastructure gaps remains critical for maximizing the benefits of cloud-based video surveillance solutions.
VSaaS Market Scope
The North America VSaaS market is segmented into fourteen segments based on type, system type, component, technology, deployment environment, storage architecture, organization size, camera type, application, end-user, connectivity technology, resolution, monitoring type, integration capability.
- By type
On the basis of type, the market is segmented into Hosted VSaaS, Managed VSaaS, Hybrid VSaaS, Self-Managed VSaaS, and Others. In 2026, the Hosted VSaaS segment is expected to dominate the market with share 35.92% due to its low upfront cost, ease of deployment, and minimal requirement for on-premise infrastructure. Organizations, especially small and medium enterprises (SMEs), are increasingly adopting hosted solutions as they eliminate the need for dedicated IT resources and enable quick scalability through subscription-based models.
The Managed VSaaS segment is projected to register the fastest CAGR of 17.1% between 2026 and 2033, primarily driven by the increasing demand for outsourced video surveillance solutions. Organizations are favoring managed services for their cost efficiency, simplified system management, and real-time monitoring capabilities, enabling enhanced security without heavy upfront investments in infrastructure.
- By System type
On the basis of System Type, the market is segmented into IP-Based VSaaS, Hybrid Surveillance Systems, Analog-To-Cloud Surveillance, and Others. In 2026, the Ip-Based VSaaS segment is expected to dominate the market share 60.87% due to its superior video quality, scalability, and seamless integration with cloud platforms and advanced analytics. IP-based systems enable high-definition and ultra-high-definition video capture, real-time remote access, and efficient data transmission over network infrastructure.
The Hybrid Surveillance Systems segment is projected to experience the fastest growth in the VSaaS market, with a CAGR of 17.1% from 2026 to 2033. This rapid expansion is driven by the increasing demand for flexible surveillance solutions that combine both cloud-based and on-premise capabilities, offering enhanced scalability, real-time monitoring, and improved security management for businesses across sectors.
- By Component
On the basis of Component, the market is segmented into Services, Software, and Hardware. In 2026, the Services segment is expected to dominate the market with share 45.45% due to the increasing shift toward subscription-based VSaaS models and the growing demand for managed and cloud-hosted surveillance solutions. Organizations are increasingly outsourcing surveillance management to service providers to reduce operational complexity and upfront infrastructure costs.
The Software segment is anticipated to witness the fastest CAGR of 17.0% from 2026 to 2033, driven by this growth is fueled by rising demand for advanced analytics, cloud-based management, and AI-powered features in surveillance solutions, enabling businesses to enhance security, streamline operations, and gain actionable insights from video data.
- By Technology
On the basis of Technology, the market is segmented into AI-Enabled VSaaS, Non-AI VSaaS, Edge AI Surveillance, IoT-Integrated Surveillance, and Others. In 2026, the AI-Enabled VSaaS segment is expected to dominate the market share 43.72% due to the increasing demand for intelligent, automated, and real-time video analytics capabilities. AI-powered surveillance solutions enable advanced functionalities such as facial recognition, behavior analysis, anomaly detection, and predictive threat identification, significantly enhancing security efficiency and reducing manual monitoring efforts.
The Edge AI Surveillance segment is expected to witness the fastest CAGR of 17.2% from 2026 to 2033, This growth is fueled by the rising demand for real-time, intelligent analytics at the network edge, reducing latency, enhancing security response, and enabling efficient data processing, particularly in applications such as smart cities, critical infrastructure, and enterprise security systems.
- By Deployment Environment
On the basis of Deployment Environment, the market is segmented into Cloud, On-Premise, Hybrid, Multi-Site Surveillance, and Single-Site Surveillance. In 2026, the Cloud segment is expected to dominate the market with share 48.09% due to its high scalability, flexibility, and cost efficiency compared to traditional on-premise systems. Cloud-based VSaaS solutions enable organizations to store and access video data remotely, reduce infrastructure and maintenance costs, and support seamless upgrades and integration with advanced analytics.
The Hybrid segment is expected to witness the fastest CAGR of 17.2% from 2026 to 2033, This robust growth is primarily driven by the rising demand for surveillance solutions that integrate both cloud-based and on-premise systems, offering flexibility, scalability, and cost-efficiency. Organizations increasingly prefer hybrid setups to enhance real-time monitoring, data storage, and security management. Additionally, the need for advanced analytics, remote accessibility, and seamless integration with existing infrastructure further fuels the adoption of hybrid surveillance systems across various industries.
- By Storage Architecture
On the basis of Storage Architecture, the market is segmented into Cloud Storage, Edge Storage, Network Video Recorders, Camera Edge Storage, Distributed Cloud Storage, Local Data Servers, Edge Gateway Storage, and Others. In 2026, the Cloud Storage segment is expected to dominate the market with share 34.81% due to its high scalability, remote accessibility, and cost-effective data management capabilities. Cloud storage enables organizations to store large volumes of video data without investing in extensive on-premise infrastructure, while also ensuring easy retrieval and centralized management across multiple locations.
The Camera Edge Storage segment is expected to witness the fastest CAGR of 17.2% from 2026 to 2033, driven by This surge is primarily driven by the increasing need for localized data storage at the camera level, which reduces latency and ensures real-time video processing. Additionally, concerns over network bandwidth, data security, and the rising adoption of intelligent video analytics in sectors like retail, transportation, and industrial facilities are accelerating the demand for edge storage solutions.
- By Organization Size
On the basis of Organization Size, the market is segmented into Large Enterprises and Small & Medium Enterprises (SMEs). In 2026, the Large Enterprises segment is expected to dominate the market with share 58.87% due to the need for large-scale, centralized, and integrated surveillance systems across multiple locations. These organizations typically require advanced security infrastructure to monitor extensive operations, ensure regulatory compliance, and manage risk effectively.
The Large Enterprises segment is expected to witness the fastest CAGR of 17.0% from 2026 to 2033, driven by this growth is primarily driven by the increasing need for advanced, scalable surveillance solutions to secure expansive facilities, manage multiple sites, and comply with stringent security regulations. Large enterprises are investing in hybrid and cloud-based systems that offer real-time monitoring, centralized management, and data analytics, enabling enhanced operational efficiency, risk mitigation, and protection of critical assets across industries
- By Camera Type
On the basis of Camera Type, the market is segmented into Dome Cameras, Bullet Cameras, PTZ Cameras, Fisheye Cameras, Panoramic Cameras, Thermal Cameras, Body-Worn Cameras, Mobile Cameras, and Others. In 2026, the Dome Cameras segment is expected to dominate the market with share 31.20% due to their versatility, compact design, and wide field of view, making them suitable for a variety of indoor and outdoor applications. Dome cameras are widely used across commercial spaces such as retail stores, offices, and hospitality environments due to their discreet appearance and resistance to tampering.
The Fisheye Cameras segment is expected to witness the fastest CAGR of 17.5% from 2026 to 2033, driven by this surge is primarily fueled by the increasing demand for wide-angle surveillance solutions that provide 360-degree coverage with minimal blind spots. Businesses and public sectors are adopting fisheye cameras for enhanced security monitoring, space optimization, and cost-effective installation, as a single camera can cover large areas, reducing the need for multiple devices.
- By Application
On the basis of Application, the market is segmented into Security & Surveillance, Remote Monitoring, Incident Detection, Access Control Integration, Traffic Monitoring, Smart City Monitoring, Retail Analytics, Operational Monitoring, and Others. In 2026, the Security & Surveillance segment is expected to dominate the market with share 32.01% due to the high volume of surveillance requirements, greater financial capacity, and early adoption of advanced security technologies. Large organizations typically operate across multiple locations and require centralized, scalable, and integrated surveillance systems, driving the adoption of VSaaS solution.
The Incident Detection segment is expected to witness the fastest CAGR of 17.5% from 2026 to 2033, driven by this surge is fueled by increasing demand for real-time monitoring solutions that can quickly identify and respond to security threats, accidents, or unusual activities. Organizations across industries are adopting advanced incident detection technologies to enhance operational safety, reduce response times, and minimize potential losses, making this segment a key driver in the expansion of the VSaaS ecosystem.
- By End-User
On the basis of End-User, the market is segmented into Commercial, Industrial, Infrastructure, Government & Public Facilities, Residential, Defense & Military, Healthcare, Education, and Others. The Commercial segment is further sub-segmented by type into Retail, BFSI, Corporate Offices, Hospitality, shopping malls, Others. In 2026, the Commercial segment is expected to dominate the market with share 30.38% due to the high adoption of VSaaS solutions across retail stores, corporate offices, hospitality, and shopping malls for enhanced security and operational efficiency. Commercial establishments require continuous monitoring, theft prevention, customer behavior analysis, and compliance with safety regulations, driving the demand for scalable and cloud-based surveillance solutions.
The infrastructure segment is expected to witness the fastest CAGR of 17.1% from 2026 to 2033, driven by this growth is primarily driven by increasing investments in smart city projects, public safety upgrades, and modernization of critical infrastructure such as transportation, utilities, and government facilities. The rising need for real-time monitoring, remote management, and integration of advanced analytics into infrastructure systems is fueling demand for cloud-based surveillance solutions, making this segment a key contributor to overall market expansion during the forecast period.
- By Connectivity Technology
On the basis of Connectivity Technology, the market is segmented into Wired Surveillance Systems, Wireless Surveillance Systems, and Hybrid Connectivity Systems. In 2026, the Wired Surveillance Systems segment is expected to dominate the market share with 46.82% due to their high reliability, consistent bandwidth, and superior data security compared to wireless alternatives. Wired systems provide stable and uninterrupted video transmission, making them ideal for high-resolution surveillance and mission-critical applications such as government facilities, industrial sites, and large commercial infrastructures
The Wired Surveillance Systems segment is expected to witness the fastest CAGR of 16.9% from 2026 to 2033, driven by this growth is fueled by the rising demand for reliable and stable security solutions across commercial, industrial, and government sectors. Wired systems offer consistent connectivity, high-resolution video quality, and reduced vulnerability to network disruptions, making them preferred for critical infrastructure and large-scale installations. Additionally, increasing investments in security infrastructure and regulatory requirements for surveillance in public and private spaces further propel market expansion.
- By Resolution
On the basis of Resolution, the market is segmented into Full HD (1080p), 4K / Ultra HD, HD (720p), 8K Surveillance Cameras. In 2026, the Full HD (1080p) segment is expected to dominate the market share with 44.69% due to its high reliability, stable connectivity, and superior data transmission quality compared to wireless alternatives. Wired systems offer consistent performance with minimal latency and are less susceptible to signal interference, making them ideal for critical applications such as government facilities, industrial sites, and large commercial infrastructures.
The 8K Surveillance Cameras segment is expected to witness the fastest CAGR of 17.2% from 2026 to 2033, driven by the growing demand for ultra-high-resolution video monitoring across critical infrastructure, smart cities, transportation hubs, and commercial facilities. Organizations are increasingly adopting 8K cameras to achieve superior image clarity, enhanced zoom capabilities, and improved facial and object recognition accuracy. Additionally, advancements in AI-powered analytics and declining hardware costs are supporting wider deployment, enabling more precise surveillance, better incident investigation, and stronger overall security performance.
- By Monitoring Type
On the basis of Monitoring Type, the market is segmented into Real-Time Monitoring, Continuous Monitoring, Event-Based Monitoring, Remote Monitoring. In 2026, the Real-Time Monitoring segment is expected to dominate the market with share 35.58% due to the increasing need for instant threat detection, rapid response capabilities, and proactive security management. Organizations across sectors such as retail, transportation, and public safety are prioritizing real-time video access to quickly identify and respond to suspicious activities, reducing potential risks and losses.
The Event-Based Monitoring segment is expected to witness the fastest CAGR of 17.1% from 2026 to 2033, driven by the growing demand for intelligent surveillance solutions capable of detecting specific activities and triggering real-time alerts. Increasing adoption of AI-powered analytics, rising security concerns across commercial and public infrastructure, and the need to reduce continuous monitoring costs are accelerating adoption. Additionally, advancements in video analytics and cloud integration enable faster incident response, improved operational efficiency, and more proactive security management across industries.
- By Integration Capability
On the basis of Integration Capability, the market is segmented into Standalone VSaaS Platforms and Integrated Security Platforms. In 2026, the Standalone VSaaS Platforms segment is expected to dominate the market with share 56.47% due to their ease of deployment, lower complexity, and cost-effectiveness, particularly for small and medium-sized enterprises (SMEs). These platforms offer quick installation, minimal integration requirements, and user-friendly interfaces, making them ideal for organizations seeking basic to mid-level surveillance capabilities without investing in comprehensive security ecosystem.
The Integrated Security Platforms segment is expected to witness the fastest CAGR of 17.0% from 2026 to 2033, driven by the growing need for centralized security management and seamless integration of multiple surveillance and safety systems. Organizations are increasingly adopting unified platforms that combine video surveillance, access control, analytics, and monitoring into a single interface. This integration improves operational efficiency, enhances real-time threat detection, and simplifies system management, making integrated platforms an attractive solution for enterprises seeking scalable and intelligent security infrastructure.
VSaaS Market Regional Analysis
- The U.S. dominates the VSaaS market in the region, accounting for a 77.41% market share, supported by strong adoption of cloud-based surveillance solutions across commercial and public sectors.
- Increasing investments in smart city initiatives and urban security infrastructure are accelerating VSaaS deployment across major U.S. cities.
- High demand for advanced video analytics and remote monitoring solutions among enterprises is strengthening regional market growth.
- Strong presence of technology providers and rapid digital transformation across industries continue to support widespread adoption of VSaaS solutions.
- Growing regulatory focus on public safety and data-driven surveillance systems further reinforces the U.S.’s leadership position in the regional market.
Canada VSaaS Market Insight
The Canada VSaaS market is witnessing strong growth driven by increasing adoption of cloud-based surveillance solutions across commercial, government, and infrastructure sectors. Rising investments in smart city projects, enhanced public safety initiatives, and demand for remote monitoring capabilities are supporting market expansion. Additionally, advancements in video analytics and integrated security platforms are further accelerating the adoption of VSaaS solutions across the country.
Mexico VSaaS Market Insight
Mexico’s VSaaS market is experiencing steady growth driven by increasing adoption of cloud-based surveillance solutions across industrial, commercial, and public infrastructure sectors. Rising focus on data security, smart manufacturing, and intelligent monitoring systems is supporting demand. Additionally, advancements in AI-powered video analytics and strong investments in digital infrastructure are encouraging organizations to shift toward scalable and remotely managed surveillance services.
France VSaaS Market Insight
France’s VSaaS market is witnessing steady growth driven by increasing adoption of cloud-based surveillance solutions across commercial, transportation, and public infrastructure sectors. Rising investments in smart city projects and enhanced security measures are encouraging organizations to shift toward scalable video monitoring systems. Additionally, growing demand for remote access, real-time analytics, and data security solutions is supporting market expansion across the country.
VSaaS Market Share
The VSaaS industry is primarily led by well-established companies, including:
- AllGoVision Technologies Pvt. Ltd. (India)
- Arlo (U.S.)
- Camcloud (U.S.)
- Cisco Systems, Inc. (U.S.)
- Dahua Technology Co., Ltd. (China)
- Genetec Inc. (Canada)
- Gorilla Technology Group (Taiwan)
- Graymatics Inc. (U.S.)
- Hangzhou Hikvision Digital Technology Co., Ltd. (China)
- Hexagon AB (Sweden)
- Honeywell International Inc. (U.S.)
- intuVision, Inc. (U.S.)
- Irisity AB (Sweden)
- ISS Corp. (Denmark)
- Ivideon (Russia)
- Johnson Controls (U.S.)
- Milestone Systems A/S (Denmark)
- Morphean SA (Luxembourg)
- Motorola Solutions, Inc. (U.S.)
- PureTech Systems (U.S.)
- Rhombus Systems, Inc. (U.S.)
- Robert Bosch GmbH (Germany)
- Securitas AB (Sweden)
- Vaidio (U.S.)
- Verint (U.S.)
- Verkada Inc. (U.S.)
- Videoloft (U.S.)
Latest Developments in North America VSaaS Market
- In November 2025, Hikvision launched its new AOV 4G Solar Camera Series, expanding its cable-free and energy-efficient surveillance portfolio. The cameras use Always-On-Video technology to enable continuous monitoring while significantly reducing storage consumption. Equipped with built-in 4G connectivity, AI-based human and vehicle detection, and solar-powered battery systems, the solution supports reliable deployment in remote and off-grid locations. This development strengthens the company’s positioning in smart, flexible surveillance solutions for agriculture, construction, and infrastructure security
- In January 2026, Motorola Solutions announced the expansion of its AI-powered security platform with new on-premise visual detection capabilities, strengthening its intelligent video analytics and physical security portfolio. The enhanced solution enables organizations to configure site-specific alerts and automatically identify safety risks, restricted-area breaches, and operational anomalies through real-time video analysis. Designed to support complex environments such as healthcare facilities, manufacturing sites, and critical infrastructure, the platform improves incident response and situational awareness while enabling localized data processing for privacy and compliance. This development positions Motorola Solutions to address growing demand for proactive, AI-driven security and operational intelligence solutions across enterprise and public safety market
- In June 2025, Honeywell launched its first locally manufactured CCTV camera portfolio in India, introducing the new 50 Series surveillance range. The cameras were designed and developed at the company’s Bengaluru technology center and produced in partnership with VVDN Technologies under the government’s “Make in India” initiative. The portfolio features advanced video analytics, strong cybersecurity capabilities, and seamless integration with enterprise security systems. This development strengthens Honeywell’s localization strategy and enhances its competitiveness in India’s growing video surveillance and electronic security market.
- In March 2026, Dahua Technology showcased its latest AI-powered Intelligent Transportation System (ITS) solutions at the Intertraffic Amsterdam, highlighting innovations aimed at improving road safety and urban mobility. The company introduced advanced technologies such as radar-video fusion–based smart traffic signal control, AI-enabled violation detection systems, and intelligent parking and highway management solutions. These solutions integrate real-time video, traffic, and regulatory data to enable automated incident detection, congestion optimization, and improved enforcement accuracy. This development strengthens Dahua’s positioning in smart mobility infrastructure by supporting safer, more efficient, and sustainable traffic management ecosystems for cities worldwide.
- In December 2025, Alarm.com’s partnership with Everon LLC focuses on creating a comprehensive commercial security platform that combines remote video monitoring, intrusion detection, access control, and business management tools into a single solution. This collaboration allows both companies to offer an integrated and seamless security experience for commercial clients, enhancing operational efficiency and real-time monitoring capabilities. For the VSaaS market, this development is significant because it strengthens Alarm.com’s cloud-based video services, expands its professional monitoring portfolio, and demonstrates the growing trend of converged security solutions, which can drive adoption of managed video surveillance services across businesses globally.
SKU-

- Interactive Data Analysis Dashboard
- Company Analysis Dashboard for high growth potential opportunities
- Research Analyst Access for customization & queries
- Competitor Analysis with Interactive dashboard
- Latest News, Updates & Trend analysis
- Harness the Power of Benchmark Analysis for Comprehensive Competitor Tracking
Table of Content
1 INTRODUCTION
1.1 OBJECTIVES OF THE STUDY
1.2 MARKET DEFINITION
1.3 OVERVIEW
1.4 LIMITATIONS
1.5 MARKETS COVERED
2 MARKET SEGMENTATION
2.1 MARKETS COVERED
2.2 GEOGRAPHICAL SCOPE
2.3 YEARS CONSIDERED FOR THE STUDY
2.4 CURRENCY AND PRICING
2.5 DBMR TRIPOD DATA VALIDATION MODEL
2.6 MULTIVARIATE MODELING
2.7 PRIMARY INTERVIEWS WITH KEY OPINION LEADERS
2.8 DBMR MARKET POSITION GRID
2.9 DBMR VENDOR SHARE ANALYSIS
2.1 MARKET END USER COVERAGE GRID
2.11 SECONDARY SOURCES
2.12 ASSUMPTIONS
3 EXECUTIVE SUMMARY
4 PREMIUM INSIGHTS
4.1 PORTER’S FIVE FORCES ANALYSIS
4.1.1 INTRODUCTION
4.1.2 INTENSITY OF COMPETITIVE RIVALRY (HIGH)
4.1.3 THREAT OF NEW ENTRANTS (MODERATE)
4.1.4 BARGAINING POWER OF SUPPLIERS (MODERATE)
4.1.5 BARGAINING POWER OF BUYERS (HIGH)
4.1.6 THREAT OF SUBSTITUTES (MODERATE)
4.1.7 CONCLUSION
4.2 VALUE CHAIN ANALYSIS:
4.2.1 HARDWARE & DEVICE PROVIDERS
4.2.2 SOFTWARE & PLATFORM DESIGN
4.2.3 CLOUD HOSTING & DATA MANAGEMENT
4.2.4 DEPLOYMENT & INTEGRATION
4.2.5 CONCLUSION
4.3 REGULATION COVERAGE
4.3.1 INTRODUCTION
4.3.2 NORTH AMERICA TECHNICAL AND OPERATIONAL STANDARDS
4.3.3 DATA PROTECTION AND PRIVACY REGULATIONS
4.3.4 CROSS-BORDER DATA TRANSFER STANDARDS
4.3.5 CYBERSECURITY AND SYSTEM INTEGRITY
4.3.6 VIDEO ANALYTICS AND BIOMETRIC RULES
4.3.7 CONTRACTUAL AND COMPLIANCE MECHANISMS
4.3.8 EMERGING TRENDS AND FUTURE DIRECTIONS
4.3.9 CONCLUSION
4.4 PRICING ANALYSIS
4.4.1 REGIONAL PRICING DYNAMICS
4.4.2 COST DRIVERS
4.4.3 PRICING TREND ANALYSIS
4.4.4 OVERALL PRICING OUTLOOK
4.5 PENETRATION AND GROWTH PROSPECT MAPPING
4.5.1 INTRODUCTION
4.5.2 NORTH AMERICA SURVEILLANCE INFRASTRUCTURE AS A PENETRATION INDICATOR
4.5.3 CLOUD, CONNECTIVITY AND AI ADOPTION TRENDS
4.5.4 REGIONAL PENETRATION MAPPING
4.5.5 SECTORAL PENETRATION DYNAMICS
4.5.6 GROWTH PROSPECT MAPPING
4.5.7 CONCLUSION
4.6 PATENT ANALYSIS
4.6.1 PATENT FILING TRENDS AND GROWTH
4.6.2 TECHNOLOGY INNOVATION FOCUS IN VSAAS PATENTS
4.6.3 MARKET MATURITY AND COMMERCIALIZATION IMPACT
4.6.4 COMPETITIVE AND STRATEGIC IMPLICATIONS
4.7 NEW BUSINESS AND EMERGING BUSINESS’S REVENUE OPPORTUNITIES & FUTURE OUTLOOK
4.7.1 INTRODUCTION
4.7.2 GOVERNMENT-LED SURVEILLANCE EXPANSION CREATING NEW BUSINESS OPPORTUNITIES
4.7.3 INSTALLED SURVEILLANCE DENSITY SUPPORTING PLATFORM MONETIZATION
4.7.4 ENTERPRISE SURVEILLANCE SCALE DRIVING SUBSCRIPTION REVENUE MODELS
4.7.5 AI-ENABLED SURVEILLANCE AND SMART VIDEO SYSTEMS CREATING NEW SERVICE SEGMENTS
4.7.6 CONNECTIVITY INFRASTRUCTURE EXPANSION ENABLING VSAAS GROWTH
4.7.7 PUBLIC SECTOR MODERNIZATION AND DIGITAL GOVERNANCE TRENDS
4.7.8 FUTURE OUTLOOK
4.7.9 FUTURE OUTLOOK
4.8 TECHNOLOGY MATRIX
4.8.1 INTRODUCTION
4.9 COMPANY COMPARATIVE ANALYSIS –
4.9.1 INTRODUCTION
4.1 COMPANY PRODUCT PLATFORM MATRIX
4.10.1 INTRODUCTION
4.11 TARIFF & ITS ANALYSIS
4.11.1 OVERVIEW OF RELEVANT TARIFFS
4.11.2 TRADE POLICIES INFLUENCING THE MARKET
4.11.3 COST IMPACT ON STAKEHOLDERS
4.11.4 SUPPLY CHAIN DISRUPTIONS
4.11.5 STRATEGIC RESPONSE BY OEM
4.11.6 CONCLUSION
5 MARKET OVERVIEW
5.1 DRIVERS
5.1.1 GROWING ADOPTION OF CLOUD INFRASTRUCTURE ACROSS ENTERPRISES ENABLES SCALABLE AND FLEXIBLE VIDEO SURVEILLANCE SOLUTIONS WITHOUT HEAVY UPFRONT CAPITAL EXPENDITURE.
5.1.2 INCREASING NEED FOR REAL-TIME REMOTE MONITORING IN COMMERCIAL, RESIDENTIAL, AND CRITICAL INFRASTRUCTURE SECTORS DRIVES VSAAS UPTAKE.
5.1.3 VSAAS PLATFORMS INCREASINGLY INTEGRATE WITH IOT SENSORS AND SMART DEVICES, ENHANCING AUTOMATION AND INTELLIGENT ALERTING CAPABILITIES.
5.1.4 STRINGENT REGULATORY REQUIREMENTS FOR DATA PROTECTION AND SURVEILLANCE COMPLIANCE PUSH ORGANIZATIONS TOWARD MANAGED VSAAS SOLUTIONS.
5.2 RESTRAINTS
5.2.1 INADEQUATE INTERNET INFRASTRUCTURE IN SOME REGIONS RESTRICTS SMOOTH VSAAS DEPLOYMENT AND VIDEO STREAMING QUALITY.
5.2.2 HESITANCY TO ADOPT CLOUD-BASED VIDEO SOLUTIONS ARISES FROM CONCERNS OVER UNAUTHORIZED ACCESS AND MISUSE OF SENSITIVE SURVEILLANCE DATA.
5.3 OPPORTUNITIES
5.3.1 GROWING SMART CITY INITIATIVES GLOBALLY PRESENT OPPORTUNITIES TO INTEGRATE VSAAS FOR TRAFFIC, PUBLIC SAFETY, AND URBAN INFRASTRUCTURE MONITORING
5.3.2 ADVANCED AI-POWERED ANALYTICS SUCH AS FACIAL RECOGNITION, BEHAVIOR DETECTION, AND PREDICTIVE ALERTS CREATE NEW VALUE-ADDED SERVICES FOR VSAAS PROVIDERS
5.3.3 SMES SEEKING COST-EFFECTIVE SECURITY SOLUTIONS REPRESENT A LARGELY UNTAPPED MARKET SEGMENT FOR VSAAS ADOPTION.
5.4 CHALLENGES
5.4.1 VARIATIONS IN CAMERA HARDWARE AND SOFTWARE PROTOCOLS COMPLICATE SEAMLESS VSAAS DEPLOYMENT ACROSS HETEROGENEOUS SYSTEMS
5.4.2 SERVICE DISRUPTIONS OR DOWNTIME IN CLOUD INFRASTRUCTURE CAN CRITICALLY IMPACT SURVEILLANCE OPERATIONS, AFFECTING USER TRUST AND ADOPTION
6 NORTH AMERICA VSAAS MARKET, BY VSAAS MODEL
6.1 OVERVIEW
6.2 NORTH AMERICA VSAAS MARKET, BY VSAAS MODEL, 2018-2033 (USD THOUSAND)
6.2.1 HOSTED VSAAS
6.2.2 MANAGED VSAAS
6.2.3 HYBRID VSAAS
6.2.4 SELF-MANAGED VSAAS
6.2.5 OTHERS
6.3 NORTH AMERICA HOSTED VSAAS IN VSAAS MARKET, BY REGION, 2018-2033 (USD THOUSAND)
6.3.1 NORTH AMERICA
6.3.2 ASIA-PACIFIC
6.3.3 EUROPE
6.3.4 MIDDLE EAST & AFRICA
6.3.5 SOUTH AMERICA
6.4 NORTH AMERICA MANAGED VSAAS IN VSAAS MARKET, BY REGION, 2018-2033 (USD THOUSAND)
6.4.1 NORTH AMERICA
6.4.2 ASIA-PACIFIC
6.4.3 EUROPE
6.4.4 MIDDLE EAST & AFRICA
6.4.5 SOUTH AMERICA
6.5 NORTH AMERICA HYBRID VSAAS IN VSAAS MARKET, BY REGION, 2018-2033 (USD THOUSAND)
6.5.1 NORTH AMERICA
6.5.2 ASIA-PACIFIC
6.5.3 EUROPE
6.5.4 MIDDLE EAST & AFRICA
6.5.5 SOUTH AMERICA
6.6 NORTH AMERICA SELF-MANAGED VSAAS IN VSAAS MARKET, BY REGION, 2018-2033 (USD THOUSAND)
6.6.1 NORTH AMERICA
6.6.2 ASIA-PACIFIC
6.6.3 EUROPE
6.6.4 MIDDLE EAST & AFRICA
6.6.5 SOUTH AMERICA
6.7 NORTH AMERICA OTHERS IN VSAAS MARKET, BY REGION, 2018-2033 (USD THOUSAND)
6.7.1 NORTH AMERICA
6.7.2 ASIA-PACIFIC
6.7.3 EUROPE
6.7.4 MIDDLE EAST & AFRICA
6.7.5 SOUTH AMERICA
7 NORTH AMERICA VSAAS MARKET, BY SYSTEM TYPE
7.1 OVERVIEW
7.2 NORTH AMERICA VSAAS MARKET, BY SYSTEM TYPE, 2018-2033 (USD THOUSAND)
7.2.1 IP-BASED VSAAS
7.2.2 HYBRID SURVEILLANCE SYSTEMS
7.2.3 ANALOG-TO-CLOUD SURVEILLANCE
7.2.4 OTHERS
7.3 NORTH AMERICA IP-BASED VSAAS IN VSAAS MARKET, BY TYPE, 2018-2033 (USD THOUSAND)
7.3.1 CLOUD-BASED IP SURVEILLANCE
7.3.2 EDGE-CONNECTED IP CAMERAS
7.3.3 ON-PREMISE IP SURVEILLANCE
7.4 NORTH AMERICA IP-BASED VSAAS IN VSAAS MARKET, BY REGION, 2018-2033 (USD THOUSAND)
7.4.1 NORTH AMERICA
7.4.2 ASIA-PACIFIC
7.4.3 EUROPE
7.4.4 MIDDLE EAST & AFRICA
7.4.5 SOUTH AMERICA
7.5 NORTH AMERICA HYBRID SURVEILLANCE SYSTEMS IN VSAAS MARKET, BY TYPE, 2018-2033 (USD THOUSAND)
7.5.1 MANAGED HYBRID SURVEILLANCE
7.5.2 HOSTED HYBRID SURVEILLANCE
7.5.3 CLOUD-CONNECTED HYBRID SURVEILLANCE
7.6 NORTH AMERICA HYBRID SURVEILLANCE SYSTEMS IN VSAAS MARKET, BY REGION, 2018-2033 (USD THOUSAND)
7.6.1 NORTH AMERICA
7.6.2 ASIA-PACIFIC
7.6.3 EUROPE
7.6.4 MIDDLE EAST & AFRICA
7.6.5 SOUTH AMERICA
7.7 NORTH AMERICA ANALOG-TO-CLOUD SURVEILLANCE IN VSAAS MARKET, BY REGION, 2018-2033 (USD THOUSAND)
7.7.1 NORTH AMERICA
7.7.2 ASIA-PACIFIC
7.7.3 EUROPE
7.7.4 MIDDLE EAST & AFRICA
7.7.5 SOUTH AMERICA
7.8 NORTH AMERICA OTHERS IN VSAAS MARKET, BY REGION, 2018-2033 (USD THOUSAND)
7.8.1 NORTH AMERICA
7.8.2 ASIA-PACIFIC
7.8.3 EUROPE
7.8.4 MIDDLE EAST & AFRICA
7.8.5 SOUTH AMERICA
8 NORTH AMERICA VSAAS MARKET, BY COMPONENT
8.1 OVERVIEW
8.2 NORTH AMERICA VSAAS MARKET, BY COMPONENT, 2018-2033 (USD THOUSAND)
8.2.1 SERVICES
8.2.2 SOFTWARE
8.2.3 HARDWARE
8.3 NORTH AMERICA SERVICES IN VSAAS MARKET, BY TYPE, 2018-2033 (USD THOUSAND)
8.3.1 IP CAMERAS
8.3.2 SENSORS & IOT DEVICES
8.3.3 NETWORK VIDEO RECORDERS
8.3.4 EDGE STORAGE DEVICES
8.3.5 VIDEO ENCODERS
8.3.6 OTHERS
8.4 NORTH AMERICA SERVICES IN VSAAS MARKET, BY REGION, 2018-2033 (USD THOUSAND)
8.4.1 NORTH AMERICA
8.4.2 ASIA-PACIFIC
8.4.3 EUROPE
8.4.4 MIDDLE EAST & AFRICA
8.4.5 SOUTH AMERICA
8.5 NORTH AMERICA SOFTWARE IN VSAAS MARKET, BY TYPE, 2018-2033 (USD THOUSAND)
8.5.1 VIDEO MANAGEMENT SOFTWARE
8.5.2 VIDEO ANALYTICS SOFTWARE
8.5.3 CLOUD STORAGE PLATFORMS
8.5.4 MONITORING APPLICATIONS
8.5.5 MOBILE SURVEILLANCE APPS
8.5.6 OTHERS
8.6 NORTH AMERICA SOFTWARE IN VSAAS MARKET, BY REGION, 2018-2033 (USD THOUSAND)
8.6.1 NORTH AMERICA
8.6.2 ASIA-PACIFIC
8.6.3 EUROPE
8.6.4 MIDDLE EAST & AFRICA
8.6.5 SOUTH AMERICA
8.7 NORTH AMERICA HARDWARE IN VSAAS MARKET, BY TYPE, 2018-2033 (USD THOUSAND)
8.7.1 MONITORING SERVICES
8.7.2 CLOUD STORAGE SERVICES
8.7.3 MAINTENANCE SERVICES
8.7.4 INSTALLATION SERVICES
8.7.5 TECHNICAL SUPPORT
8.7.6 OTHERS
8.8 NORTH AMERICA HARDWARE IN VSAAS MARKET, BY REGION, 2018-2033 (USD THOUSAND)
8.8.1 NORTH AMERICA
8.8.2 ASIA-PACIFIC
8.8.3 EUROPE
8.8.4 MIDDLE EAST & AFRICA
8.8.5 SOUTH AMERICA
9 NORTH AMERICA VSAAS MARKET, BY TECHNOLOGY
9.1 OVERVIEW
9.2 NORTH AMERICA VSAAS MARKET, BY TECHNOLOGY, 2018-2033 (USD THOUSAND)
9.2.1 AI-ENABLED VSAAS
9.2.2 NON-AI VSAAS
9.2.3 EDGE AI SURVEILLANCE
9.2.4 IOT-INTEGRATED SURVEILLANCE
9.2.5 OTHERS
9.3 NORTH AMERICA AI-ENABLED VSAAS IN VSAAS MARKET, BY TYPE, 2018-2033 (USD THOUSAND)
9.3.1 OBJECT DETECTION
9.3.2 FACIAL RECOGNITION
9.3.3 INTRUSION DETECTION
9.3.4 BEHAVIOR ANALYSIS
9.3.5 ANOMALY DETECTION
9.3.6 LICENSE PLATE RECOGNITION
9.3.7 CROWD MONITORING
9.4 NORTH AMERICA AI-ENABLED VSAAS IN VSAAS MARKET, BY REGION, 2018-2033 (USD THOUSAND)
9.4.1 NORTH AMERICA
9.4.2 ASIA-PACIFIC
9.4.3 EUROPE
9.4.4 MIDDLE EAST & AFRICA
9.4.5 SOUTH AMERICA
9.5 NORTH AMERICA NON-AI VSAAS IN VSAAS MARKET, BY REGION, 2018-2033 (USD THOUSAND)
9.5.1 NORTH AMERICA
9.5.2 ASIA-PACIFIC
9.5.3 EUROPE
9.5.4 MIDDLE EAST & AFRICA
9.5.5 SOUTH AMERICA
9.6 NORTH AMERICA EDGE AI SURVEILLANCE IN VSAAS MARKET, BY REGION, 2018-2033 (USD THOUSAND)
9.6.1 NORTH AMERICA
9.6.2 ASIA-PACIFIC
9.6.3 EUROPE
9.6.4 MIDDLE EAST & AFRICA
9.6.5 SOUTH AMERICA
9.7 NORTH AMERICA IOT-INTEGRATED SURVEILLANCE IN VSAAS MARKET, BY REGION, 2018-2033 (USD THOUSAND)
9.7.1 NORTH AMERICA
9.7.2 ASIA-PACIFIC
9.7.3 EUROPE
9.7.4 MIDDLE EAST & AFRICA
9.7.5 SOUTH AMERICA
9.8 NORTH AMERICA OTHERS IN VSAAS MARKET, BY REGION, 2018-2033 (USD THOUSAND)
9.8.1 NORTH AMERICA
9.8.2 ASIA-PACIFIC
9.8.3 EUROPE
9.8.4 MIDDLE EAST & AFRICA
9.8.5 SOUTH AMERICA
10 NORTH AMERICA VSAAS MARKET, BY DEPLOYMENT ENVIRONMENT
10.1 OVERVIEW
10.2 NORTH AMERICA VSAAS MARKET, BY DEPLOYMENT ENVIRONMENT, 2018-2033 (USD THOUSAND)
10.2.1 CLOUD
10.2.2 ON-PREMISE
10.2.3 HYBRID
10.2.4 MULTI-SITE SURVEILLANCE
10.2.5 SINGLE-SITE SURVEILLANCE
10.3 NORTH AMERICA CLOUD IN VSAAS MARKET, BY TYPE, 2018-2033 (USD THOUSAND)
10.3.1 PUBLIC CLOUD
10.3.2 PRIVATE CLOUD
10.4 NORTH AMERICA CLOUD IN VSAAS MARKET, BY REGION, 2018-2033 (USD THOUSAND)
10.4.1 NORTH AMERICA
10.4.2 ASIA-PACIFIC
10.4.3 EUROPE
10.4.4 MIDDLE EAST & AFRICA
10.4.5 SOUTH AMERICA
10.5 NORTH AMERICA ON-PREMISE IN VSAAS MARKET, BY REGION, 2018-2033 (USD THOUSAND)
10.5.1 NORTH AMERICA
10.5.2 ASIA-PACIFIC
10.5.3 EUROPE
10.5.4 MIDDLE EAST & AFRICA
10.5.5 SOUTH AMERICA
10.6 NORTH AMERICA HYBRID IN VSAAS MARKET, BY REGION, 2018-2033 (USD THOUSAND)
10.6.1 NORTH AMERICA
10.6.2 ASIA-PACIFIC
10.6.3 EUROPE
10.6.4 MIDDLE EAST & AFRICA
10.6.5 SOUTH AMERICA
10.7 NORTH AMERICA MULTI-SITE SURVEILLANCE IN VSAAS MARKET, BY REGION, 2018-2033 (USD THOUSAND)
10.7.1 NORTH AMERICA
10.7.2 ASIA-PACIFIC
10.7.3 EUROPE
10.7.4 MIDDLE EAST & AFRICA
10.7.5 SOUTH AMERICA
10.8 NORTH AMERICA SINGLE-SITE SURVEILLANCE IN VSAAS MARKET, BY REGION, 2018-2033 (USD THOUSAND)
10.8.1 NORTH AMERICA
10.8.2 ASIA-PACIFIC
10.8.3 EUROPE
10.8.4 MIDDLE EAST & AFRICA
10.8.5 SOUTH AMERICA
11 NORTH AMERICA VSAAS MARKET, BY STORAGE ARCHITECTURE
11.1 OVERVIEW
11.2 NORTH AMERICA VSAAS MARKET, BY STORAGE ARCHITECTURE, 2018-2033 (USD THOUSAND)
11.2.1 CLOUD STORAGE
11.2.2 EDGE STORAGE
11.2.3 NETWORK VIDEO RECORDERS
11.2.4 CAMERA EDGE STORAGE
11.2.5 DISTRIBUTED CLOUD STORAGE
11.2.6 LOCAL DATA SERVERS
11.2.7 EDGE GATEWAY STORAGE
11.2.8 OTHERS
11.3 NORTH AMERICA CLOUD STORAGE IN VSAAS MARKET, BY REGION, 2018-2033 (USD THOUSAND)
11.3.1 NORTH AMERICA
11.3.2 ASIA-PACIFIC
11.3.3 EUROPE
11.3.4 MIDDLE EAST & AFRICA
11.3.5 SOUTH AMERICA
11.4 NORTH AMERICA EDGE STORAGE IN VSAAS MARKET, BY REGION, 2018-2033 (USD THOUSAND)
11.4.1 NORTH AMERICA
11.4.2 ASIA-PACIFIC
11.4.3 EUROPE
11.4.4 MIDDLE EAST & AFRICA
11.4.5 SOUTH AMERICA
11.5 NORTH AMERICA NETWORK VIDEO RECORDERS IN VSAAS MARKET, BY REGION, 2018-2033 (USD THOUSAND)
11.5.1 NORTH AMERICA
11.5.2 ASIA-PACIFIC
11.5.3 EUROPE
11.5.4 MIDDLE EAST & AFRICA
11.5.5 SOUTH AMERICA
11.6 NORTH AMERICA CAMERA EDGE STORAGE IN VSAAS MARKET, BY REGION, 2018-2033 (USD THOUSAND)
11.6.1 NORTH AMERICA
11.6.2 ASIA-PACIFIC
11.6.3 EUROPE
11.6.4 MIDDLE EAST & AFRICA
11.6.5 SOUTH AMERICA
11.7 NORTH AMERICA DISTRIBUTED CLOUD STORAGE IN VSAAS MARKET, BY REGION, 2018-2033 (USD THOUSAND)
11.7.1 NORTH AMERICA
11.7.2 ASIA-PACIFIC
11.7.3 EUROPE
11.7.4 MIDDLE EAST & AFRICA
11.7.5 SOUTH AMERICA
11.8 NORTH AMERICA LOCAL DATA SERVERS IN VSAAS MARKET, BY REGION, 2018-2033 (USD THOUSAND)
11.8.1 NORTH AMERICA
11.8.2 ASIA-PACIFIC
11.8.3 EUROPE
11.8.4 MIDDLE EAST & AFRICA
11.8.5 SOUTH AMERICA
11.9 NORTH AMERICA EDGE GATEWAY STORAGE IN VSAAS MARKET, BY REGION, 2018-2033 (USD THOUSAND)
11.9.1 NORTH AMERICA
11.9.2 ASIA-PACIFIC
11.9.3 EUROPE
11.9.4 MIDDLE EAST & AFRICA
11.9.5 SOUTH AMERICA
11.1 NORTH AMERICA OTHERS IN VSAAS MARKET, BY REGION, 2018-2033 (USD THOUSAND)
11.10.1 NORTH AMERICA
11.10.2 ASIA-PACIFIC
11.10.3 EUROPE
11.10.4 MIDDLE EAST & AFRICA
11.10.5 SOUTH AMERICA
12 NORTH AMERICA VSAAS MARKET, BY ORGANIZATION SIZE
12.1 OVERVIEW
12.2 NORTH AMERICA VSAAS MARKET, BY ORGANIZATION SIZE, 2018-2033 (USD THOUSAND)
12.2.1 LARGE ENTERPRISES
12.2.2 SMALL & MEDIUM ENTERPRISES (SMES)
12.3 NORTH AMERICA LARGE ENTERPRISES IN VSAAS MARKET, BY REGION, 2018-2033 (USD THOUSAND)
12.3.1 NORTH AMERICA
12.3.2 ASIA-PACIFIC
12.3.3 EUROPE
12.3.4 MIDDLE EAST & AFRICA
12.3.5 SOUTH AMERICA
12.4 NORTH AMERICA SMALL & MEDIUM ENTERPRISES (SMES) IN VSAAS MARKET, BY REGION, 2018-2033 (USD THOUSAND)
12.4.1 NORTH AMERICA
12.4.2 ASIA-PACIFIC
12.4.3 EUROPE
12.4.4 MIDDLE EAST & AFRICA
12.4.5 SOUTH AMERICA
13 NORTH AMERICA VSAAS MARKET, BY CAMERA TYPE
13.1 OVERVIEW
13.2 NORTH AMERICA VSAAS MARKET, BY CAMERA TYPE, 2018-2033 (USD THOUSAND)
13.2.1 DOME CAMERAS
13.2.2 BULLET CAMERAS
13.2.3 PTZ CAMERAS
13.2.4 FISHEYE CAMERAS
13.2.5 PANORAMIC CAMERAS
13.2.6 THERMAL CAMERAS
13.2.7 BODY-WORN CAMERAS
13.2.8 MOBILE CAMERAS
13.2.9 OTHERS
13.3 NORTH AMERICA DOME CAMERAS IN VSAAS MARKET, BY REGION, 2018-2033 (USD THOUSAND)
13.3.1 NORTH AMERICA
13.3.2 ASIA-PACIFIC
13.3.3 EUROPE
13.3.4 MIDDLE EAST & AFRICA
13.3.5 SOUTH AMERICA
13.4 NORTH AMERICA BULLET CAMERAS IN VSAAS MARKET, BY REGION, 2018-2033 (USD THOUSAND)
13.4.1 NORTH AMERICA
13.4.2 ASIA-PACIFIC
13.4.3 EUROPE
13.4.4 MIDDLE EAST & AFRICA
13.4.5 SOUTH AMERICA
13.5 NORTH AMERICA PTZ CAMERAS IN VSAAS MARKET, BY REGION, 2018-2033 (USD THOUSAND)
13.5.1 NORTH AMERICA
13.5.2 ASIA-PACIFIC
13.5.3 EUROPE
13.5.4 MIDDLE EAST & AFRICA
13.5.5 SOUTH AMERICA
13.6 NORTH AMERICA FISHEYE CAMERAS IN VSAAS MARKET, BY REGION, 2018-2033 (USD THOUSAND)
13.6.1 NORTH AMERICA
13.6.2 ASIA-PACIFIC
13.6.3 EUROPE
13.6.4 MIDDLE EAST & AFRICA
13.6.5 SOUTH AMERICA
13.7 NORTH AMERICA PANORAMIC CAMERAS IN VSAAS MARKET, BY REGION, 2018-2033 (USD THOUSAND)
13.7.1 NORTH AMERICA
13.7.2 ASIA-PACIFIC
13.7.3 EUROPE
13.7.4 MIDDLE EAST & AFRICA
13.7.5 SOUTH AMERICA
13.8 NORTH AMERICA THERMAL CAMERAS IN VSAAS MARKET, BY REGION, 2018-2033 (USD THOUSAND)
13.8.1 NORTH AMERICA
13.8.2 ASIA-PACIFIC
13.8.3 EUROPE
13.8.4 MIDDLE EAST & AFRICA
13.8.5 SOUTH AMERICA
13.9 NORTH AMERICA BODY-WORN CAMERAS IN VSAAS MARKET, BY REGION, 2018-2033 (USD THOUSAND)
13.9.1 NORTH AMERICA
13.9.2 ASIA-PACIFIC
13.9.3 EUROPE
13.9.4 MIDDLE EAST & AFRICA
13.9.5 SOUTH AMERICA
13.1 NORTH AMERICA MOBILE CAMERAS IN VSAAS MARKET, BY REGION, 2018-2033 (USD THOUSAND)
13.10.1 NORTH AMERICA
13.10.2 ASIA-PACIFIC
13.10.3 EUROPE
13.10.4 MIDDLE EAST & AFRICA
13.10.5 SOUTH AMERICA
13.11 NORTH AMERICA OTHERS IN VSAAS MARKET, BY REGION, 2018-2033 (USD THOUSAND)
13.11.1 NORTH AMERICA
13.11.2 ASIA-PACIFIC
13.11.3 EUROPE
13.11.4 MIDDLE EAST & AFRICA
13.11.5 SOUTH AMERICA
14 NORTH AMERICA VSAAS MARKET, BY APPLICATION
14.1 OVERVIEW
14.2 NORTH AMERICA VSAAS MARKET, BY APPLICATION, 2018-2033 (USD THOUSAND)
14.2.1 SECURITY & SURVEILLANCE
14.2.2 REMOTE MONITORING
14.2.3 INCIDENT DETECTION
14.2.4 ACCESS CONTROL INTEGRATION
14.2.5 TRAFFIC MONITORING
14.2.6 SMART CITY MONITORING
14.2.7 RETAIL ANALYTICS
14.2.8 OPERATIONAL MONITORING
14.2.9 OTHERS
14.3 NORTH AMERICA SECURITY & SURVEILLANCE IN VSAAS MARKET, BY REGION, 2018-2033 (USD THOUSAND)
14.3.1 NORTH AMERICA
14.3.2 ASIA-PACIFIC
14.3.3 EUROPE
14.3.4 MIDDLE EAST & AFRICA
14.3.5 SOUTH AMERICA
14.4 NORTH AMERICA REMOTE MONITORING IN VSAAS MARKET, BY REGION, 2018-2033 (USD THOUSAND)
14.4.1 NORTH AMERICA
14.4.2 ASIA-PACIFIC
14.4.3 EUROPE
14.4.4 MIDDLE EAST & AFRICA
14.4.5 SOUTH AMERICA
14.5 NORTH AMERICA INCIDENT DETECTION IN VSAAS MARKET, BY REGION, 2018-2033 (USD THOUSAND)
14.5.1 NORTH AMERICA
14.5.2 ASIA-PACIFIC
14.5.3 EUROPE
14.5.4 MIDDLE EAST & AFRICA
14.5.5 SOUTH AMERICA
14.6 NORTH AMERICA ACCESS CONTROL INTEGRATION IN VSAAS MARKET, BY REGION, 2018-2033 (USD THOUSAND)
14.6.1 NORTH AMERICA
14.6.2 ASIA-PACIFIC
14.6.3 EUROPE
14.6.4 MIDDLE EAST & AFRICA
14.6.5 SOUTH AMERICA
14.7 NORTH AMERICA TRAFFIC MONITORING IN VSAAS MARKET, BY REGION, 2018-2033 (USD THOUSAND)
14.7.1 NORTH AMERICA
14.7.2 ASIA-PACIFIC
14.7.3 EUROPE
14.7.4 MIDDLE EAST & AFRICA
14.7.5 SOUTH AMERICA
14.8 NORTH AMERICA SMART CITY MONITORING IN VSAAS MARKET, BY REGION, 2018-2033 (USD THOUSAND)
14.8.1 NORTH AMERICA
14.8.2 ASIA-PACIFIC
14.8.3 EUROPE
14.8.4 MIDDLE EAST & AFRICA
14.8.5 SOUTH AMERICA
14.9 NORTH AMERICA RETAIL ANALYTICS IN VSAAS MARKET, BY REGION, 2018-2033 (USD THOUSAND)
14.9.1 NORTH AMERICA
14.9.2 ASIA-PACIFIC
14.9.3 EUROPE
14.9.4 MIDDLE EAST & AFRICA
14.9.5 SOUTH AMERICA
14.1 NORTH AMERICA OPERATIONAL MONITORING IN VSAAS MARKET, BY REGION, 2018-2033 (USD THOUSAND)
14.10.1 NORTH AMERICA
14.10.2 ASIA-PACIFIC
14.10.3 EUROPE
14.10.4 MIDDLE EAST & AFRICA
14.10.5 SOUTH AMERICA
14.11 NORTH AMERICA OTHERS IN VSAAS MARKET, BY REGION, 2018-2033 (USD THOUSAND)
14.11.1 NORTH AMERICA
14.11.2 ASIA-PACIFIC
14.11.3 EUROPE
14.11.4 MIDDLE EAST & AFRICA
14.11.5 SOUTH AMERICA
15 NORTH AMERICA VSAAS MARKET, BY END USER
15.1 OVERVIEW
15.2 NORTH AMERICA BFSI IN VSAAS MARKET, BY END-USER, 2018-2033 (USD THOUSAND)
15.2.1 COMMERCIAL
15.2.2 INDUSTRIAL
15.2.3 INFRASTRUCTURE
15.2.4 GOVERNMENT & PUBLIC FACILITIES
15.2.5 RESIDENTIAL
15.2.6 DEFENSE & MILITARY
15.2.7 HEALTHCARE
15.2.8 EDUCATION
15.2.9 OTHERS
15.3 NORTH AMERICA COMMERCIAL IN VSAAS MARKET, BY TYPE, 2018-2033 (USD THOUSAND)
15.3.1 RETAIL
15.3.2 BFSI
15.3.3 CORPORATE OFFICES
15.3.4 HOSPITALITY
15.3.5 SHOPPING MALLS
15.3.6 OTHERS
15.4 NORTH AMERICA COMMERCIAL IN VSAAS MARKET, BY VSAAS MODEL, 2018-2033 (USD THOUSAND)
15.4.1 HOSTED VSAAS
15.4.2 MANAGED VSAAS
15.4.3 HYBRID VSAAS
15.4.4 SELF-MANAGED VSAAS
15.4.5 OTHERS
15.5 NORTH AMERICA COMMERCIAL IN VSAAS MARKET, BY REGION, 2018-2033 (USD THOUSAND)
15.5.1 NORTH AMERICA
15.5.2 ASIA-PACIFIC
15.5.3 EUROPE
15.5.4 MIDDLE EAST & AFRICA
15.5.5 SOUTH AMERICA
15.6 NORTH AMERICA INDUSTRIAL IN VSAAS MARKET, BY TYPE, 2018-2033 (USD THOUSAND)
15.6.1 MANUFACTURING
15.6.2 WAREHOUSING & LOGISTICS
15.6.3 OIL & GAS FACILITIES
15.6.4 ENERGY & UTILITIES
15.6.5 OTHERS
15.7 NORTH AMERICA INDUSTRIAL IN VSAAS MARKET, BY VSAAS MODEL, 2018-2033 (USD THOUSAND)
15.7.1 HOSTED VSAAS
15.7.2 MANAGED VSAAS
15.7.3 HYBRID VSAAS
15.7.4 SELF-MANAGED VSAAS
15.7.5 OTHERS
15.8 NORTH AMERICA INDUSTRIAL IN VSAAS MARKET, BY REGION, 2018-2033 (USD THOUSAND)
15.8.1 NORTH AMERICA
15.8.2 ASIA-PACIFIC
15.8.3 EUROPE
15.8.4 MIDDLE EAST & AFRICA
15.8.5 SOUTH AMERICA
15.9 NORTH AMERICA INFRASTRUCTURE IN VSAAS MARKET, BY TYPE, 2018-2033 (USD THOUSAND)
15.9.1 TRANSPORTATION HUBS
15.9.2 AIRPORTS
15.9.3 RAILWAYS
15.9.4 SEAPORTS
15.9.5 OTHERS
15.1 NORTH AMERICA INFRASTRUCTURE IN VSAAS MARKET, BY VSAAS MODEL, 2018-2033 (USD THOUSAND)
15.10.1 HOSTED VSAAS
15.10.2 MANAGED VSAAS
15.10.3 HYBRID VSAAS
15.10.4 SELF-MANAGED VSAAS
15.10.5 OTHERS
15.11 NORTH AMERICA INFRASTRUCTURE IN VSAAS MARKET, BY REGION, 2018-2033 (USD THOUSAND)
15.11.1 NORTH AMERICA
15.11.2 ASIA-PACIFIC
15.11.3 EUROPE
15.11.4 MIDDLE EAST & AFRICA
15.11.5 SOUTH AMERICA
15.12 NORTH AMERICA GOVERNMENT & PUBLIC FACILITIES IN VSAAS MARKET, BY TYPE, 2018-2033 (USD THOUSAND)
15.12.1 CITY SURVEILLANCE
15.12.2 LAW ENFORCEMENT
15.12.3 PUBLIC SAFETY MONITORING
15.12.4 MUNICIPAL BUILDINGS
15.12.5 OTHERS
15.13 NORTH AMERICA GOVERNMENT & PUBLIC FACILITIES IN VSAAS MARKET, BY VSAAS MODEL, 2018-2033 (USD THOUSAND)
15.13.1 HOSTED VSAAS
15.13.2 MANAGED VSAAS
15.13.3 HYBRID VSAAS
15.13.4 SELF-MANAGED VSAAS
15.13.5 OTHERS
15.14 NORTH AMERICA GOVERNMENT & PUBLIC FACILITIES IN VSAAS MARKET, BY REGION, 2018-2033 (USD THOUSAND)
15.14.1 NORTH AMERICA
15.14.2 ASIA-PACIFIC
15.14.3 EUROPE
15.14.4 MIDDLE EAST & AFRICA
15.14.5 SOUTH AMERICA
15.15 NORTH AMERICA RESIDENTIAL IN VSAAS MARKET, BY TYPE, 2018-2033 (USD THOUSAND)
15.15.1 SMART HOMES
15.15.2 RESIDENTIAL COMPLEXES
15.15.3 GATED COMMUNITIES
15.15.4 OTHERS
15.16 NORTH AMERICA RESIDENTIAL IN VSAAS MARKET, BY VSAAS MODEL, 2018-2033 (USD THOUSAND)
15.16.1 HOSTED VSAAS
15.16.2 MANAGED VSAAS
15.16.3 HYBRID VSAAS
15.16.4 SELF-MANAGED VSAAS
15.16.5 OTHERS
15.17 NORTH AMERICA RESIDENTIAL IN VSAAS MARKET, BY REGION, 2018-2033 (USD THOUSAND)
15.17.1 NORTH AMERICA
15.17.2 ASIA-PACIFIC
15.17.3 EUROPE
15.17.4 MIDDLE EAST & AFRICA
15.17.5 SOUTH AMERICA
15.18 NORTH AMERICA DEFENSE & MILITARY IN VSAAS MARKET, BY TYPE, 2018-2033 (USD THOUSAND)
15.18.1 MILITARY BASES
15.18.2 BORDER SURVEILLANCE
15.18.3 COMMAND & CONTROL CENTERS
15.18.4 AIR FORCE BASES
15.18.5 NAVAL BASES
15.18.6 AMMUNITION DEPOTS
15.18.7 TRAINING FACILITIES
15.18.8 MILITARY RESEARCH FACILITIES
15.18.9 MILITARY LOGISTICS FACILITIES
15.18.10 OTHERS
15.19 NORTH AMERICA DEFENSE & MILITARY IN VSAAS MARKET, BY VSAAS MODEL, 2018-2033 (USD THOUSAND)
15.19.1 HOSTED VSAAS
15.19.2 MANAGED VSAAS
15.19.3 HYBRID VSAAS
15.19.4 SELF-MANAGED VSAAS
15.19.5 OTHERS
15.2 NORTH AMERICA DEFENSE & MILITARY IN VSAAS MARKET, BY REGION, 2018-2033 (USD THOUSAND)
15.20.1 NORTH AMERICA
15.20.2 ASIA-PACIFIC
15.20.3 EUROPE
15.20.4 MIDDLE EAST & AFRICA
15.20.5 SOUTH AMERICA
15.21 NORTH AMERICA HEALTHCARE IN VSAAS MARKET, BY TYPE, 2018-2033 (USD THOUSAND)
15.21.1 HOSPITALS
15.21.2 CLINICS
15.21.3 DIAGNOSTIC CENTERS
15.21.4 AMBULATORY SURGICAL CENTERS
15.21.5 NURSING HOMES
15.21.6 ASSISTED LIVING FACILITIES
15.21.7 MEDICAL LABORATORIES
15.21.8 PHARMACEUTICAL FACILITIES
15.21.9 BLOOD BANKS
15.21.10 OTHERS
15.22 NORTH AMERICA HEALTHCARE IN VSAAS MARKET, BY VSAAS MODEL, 2018-2033 (USD THOUSAND)
15.22.1 HOSTED VSAAS
15.22.2 MANAGED VSAAS
15.22.3 HYBRID VSAAS
15.22.4 SELF-MANAGED VSAAS
15.22.5 OTHERS
15.23 NORTH AMERICA HEALTHCARE IN VSAAS MARKET, BY REGION, 2018-2033 (USD THOUSAND)
15.23.1 NORTH AMERICA
15.23.2 ASIA-PACIFIC
15.23.3 EUROPE
15.23.4 MIDDLE EAST & AFRICA
15.23.5 SOUTH AMERICA
15.24 NORTH AMERICA EDUCATION IN VSAAS MARKET, BY TYPE, 2018-2033 (USD THOUSAND)
15.24.1 SCHOOLS
15.24.2 UNIVERSITIES
15.24.3 COLLEGES
15.24.4 RESEARCH INSTITUTIONS
15.24.5 STUDENT HOUSING & DORMITORIES
15.24.6 VOCATIONAL TRAINING CENTERS
15.24.7 CAMPUS INFRASTRUCTURE FACILITIES
15.24.8 OTHERS
15.25 NORTH AMERICA SCHOOLS IN VSAAS MARKET, BY TYPE, 2018-2033 (USD THOUSAND)
15.25.1 PRIMARY SCHOOLS
15.25.2 SECONDARY SCHOOLS
15.26 NORTH AMERICA EDUCATION IN VSAAS MARKET, BY VSAAS MODEL, 2018-2033 (USD THOUSAND)
15.26.1 HOSTED VSAAS
15.26.2 MANAGED VSAAS
15.26.3 HYBRID VSAAS
15.26.4 SELF-MANAGED VSAAS
15.26.5 OTHERS
15.27 NORTH AMERICA EDUCATION IN VSAAS MARKET, BY REGION, 2018-2033 (USD THOUSAND)
15.27.1 NORTH AMERICA
15.27.2 ASIA-PACIFIC
15.27.3 EUROPE
15.27.4 MIDDLE EAST & AFRICA
15.27.5 SOUTH AMERICA
15.28 NORTH AMERICA OTHERS IN VSAAS MARKET, BY TYPE, 2018-2033 (USD THOUSAND)
15.28.1 HOSTED VSAAS
15.28.2 MANAGED VSAAS
15.28.3 HYBRID VSAAS
15.28.4 SELF-MANAGED VSAAS
15.28.5 OTHERS
15.29 NORTH AMERICA OTHERS IN VSAAS MARKET, BY REGION, 2018-2033 (USD THOUSAND)
15.29.1 NORTH AMERICA
15.29.2 ASIA-PACIFIC
15.29.3 EUROPE
15.29.4 MIDDLE EAST & AFRICA
15.29.5 SOUTH AMERICA
16 NORTH AMERICA VSAAS MARKET, BY CONNECTIVITY TECHNOLOGY
16.1 OVERVIEW
16.2 NORTH AMERICA VSAAS MARKET, BY CONNECTIVITY TECHNOLOGY, 2018-2033 (USD THOUSAND)
16.2.1 WIRED SURVEILLANCE SYSTEMS
16.2.2 WIRELESS SURVEILLANCE SYSTEMS
16.2.3 HYBRID CONNECTIVITY SYSTEMS
16.3 NORTH AMERICA WIRED SURVEILLANCE SYSTEMS IN VSAAS MARKET, BY REGION, 2018-2033 (USD THOUSAND)
16.3.1 NORTH AMERICA
16.3.2 ASIA-PACIFIC
16.3.3 EUROPE
16.3.4 MIDDLE EAST & AFRICA
16.3.5 SOUTH AMERICA
16.4 NORTH AMERICA WIRELESS SURVEILLANCE SYSTEMS IN VSAAS MARKET, BY TYPE, 2018-2033 (USD THOUSAND)
16.4.1 WI-FI SURVEILLANCE
16.4.2 CELLULAR SURVEILLANCE (4G/5G)
16.4.3 LPWAN SURVEILLANCE
16.5 NORTH AMERICA WIRELESS SURVEILLANCE SYSTEMS IN VSAAS MARKET, BY REGION, 2018-2033 (USD THOUSAND)
16.5.1 NORTH AMERICA
16.5.2 ASIA-PACIFIC
16.5.3 EUROPE
16.5.4 MIDDLE EAST & AFRICA
16.5.5 SOUTH AMERICA
16.6 NORTH AMERICA HYBRID CONNECTIVITY SYSTEMS IN VSAAS MARKET, BY REGION, 2018-2033 (USD THOUSAND)
16.6.1 NORTH AMERICA
16.6.2 ASIA-PACIFIC
16.6.3 EUROPE
16.6.4 MIDDLE EAST & AFRICA
16.6.5 SOUTH AMERICA
17 NORTH AMERICA VSAAS MARKET, BY RESOLUTION
17.1 OVERVIEW
17.2 NORTH AMERICA VSAAS MARKET, BY RESOLUTION, 2018-2033 (USD THOUSAND)
17.2.1 FULL HD (1080P)
17.2.2 4K / ULTRA HD
17.2.3 HD (720P)
17.2.4 8K SURVEILLANCE CAMERAS
17.3 NORTH AMERICA FULL HD (1080P) IN VSAAS MARKET, BY REGION, 2018-2033 (USD THOUSAND)
17.3.1 NORTH AMERICA
17.3.2 ASIA-PACIFIC
17.3.3 EUROPE
17.3.4 MIDDLE EAST & AFRICA
17.3.5 SOUTH AMERICA
17.4 NORTH AMERICA 4K / ULTRA HD IN VSAAS MARKET, BY REGION, 2018-2033 (USD THOUSAND)
17.4.1 NORTH AMERICA
17.4.2 ASIA-PACIFIC
17.4.3 EUROPE
17.4.4 MIDDLE EAST & AFRICA
17.4.5 SOUTH AMERICA
17.5 NORTH AMERICA HD (720P) IN VSAAS MARKET, BY REGION, 2018-2033 (USD THOUSAND)
17.5.1 NORTH AMERICA
17.5.2 ASIA-PACIFIC
17.5.3 EUROPE
17.5.4 MIDDLE EAST & AFRICA
17.5.5 SOUTH AMERICA
17.6 NORTH AMERICA 8K SURVEILLANCE CAMERAS IN VSAAS MARKET, BY REGION, 2018-2033 (USD THOUSAND)
17.6.1 NORTH AMERICA
17.6.2 ASIA-PACIFIC
17.6.3 EUROPE
17.6.4 MIDDLE EAST & AFRICA
17.6.5 SOUTH AMERICA
18 NORTH AMERICA VSAAS MARKET, BY MONITORING TYPE
18.1 OVERVIEW
18.2 NORTH AMERICA VSAAS MARKET, BY MONITORING TYPE, 2018-2033 (USD THOUSAND)
18.2.1 REAL-TIME MONITORING
18.2.2 CONTINUOUS MONITORING
18.2.3 EVENT-BASED MONITORING
18.2.4 REMOTE MONITORING
18.3 NORTH AMERICA REAL-TIME MONITORING IN VSAAS MARKET, BY REGION, 2018-2033 (USD THOUSAND)
18.3.1 NORTH AMERICA
18.3.2 ASIA-PACIFIC
18.3.3 EUROPE
18.3.4 MIDDLE EAST & AFRICA
18.3.5 SOUTH AMERICA
18.4 NORTH AMERICA CONTINUOUS MONITORING IN VSAAS MARKET, BY REGION, 2018-2033 (USD THOUSAND)
18.4.1 NORTH AMERICA
18.4.2 ASIA-PACIFIC
18.4.3 EUROPE
18.4.4 MIDDLE EAST & AFRICA
18.4.5 SOUTH AMERICA
18.5 NORTH AMERICA EVENT-BASED MONITORING IN VSAAS MARKET, BY REGION, 2018-2033 (USD THOUSAND)
18.5.1 NORTH AMERICA
18.5.2 ASIA-PACIFIC
18.5.3 EUROPE
18.5.4 MIDDLE EAST & AFRICA
18.5.5 SOUTH AMERICA
18.6 NORTH AMERICA REMOTE MONITORING IN VSAAS MARKET, BY REGION, 2018-2033 (USD THOUSAND)
18.6.1 NORTH AMERICA
18.6.2 ASIA-PACIFIC
18.6.3 EUROPE
18.6.4 MIDDLE EAST & AFRICA
18.6.5 SOUTH AMERICA
19 NORTH AMERICA VSAAS MARKET, BY INTEGRATION CAPABILITY
19.1 OVERVIEW
19.2 NORTH AMERICA VSAAS MARKET, BY INTEGRATION CAPABILITY, 2018-2033 (USD THOUSAND)
19.2.1 STANDALONE VSAAS PLATFORMS
19.2.2 INTEGRATED SECURITY PLATFORMS
19.3 NORTH AMERICA STANDALONE VSAAS PLATFORMS IN VSAAS MARKET, BY REGION, 2018-2033 (USD THOUSAND)
19.3.1 NORTH AMERICA
19.3.2 ASIA-PACIFIC
19.3.3 EUROPE
19.3.4 MIDDLE EAST & AFRICA
19.3.5 SOUTH AMERICA
19.4 NORTH AMERICA INTEGRATED SECURITY PLATFORMS IN VSAAS MARKET, BY TYPE, 2018-2033 (USD THOUSAND)
19.4.1 ACCESS CONTROL INTEGRATION
19.4.2 SMART CITY PLATFORMS
19.4.3 ALARM SYSTEM INTEGRATION
19.4.4 BUILDING MANAGEMENT SYSTEM (BMS) INTEGRATION
19.5 NORTH AMERICA INTEGRATED SECURITY PLATFORMS IN VSAAS MARKET, BY REGION, 2018-2033 (USD THOUSAND)
19.5.1 NORTH AMERICA
19.5.2 ASIA-PACIFIC
19.5.3 EUROPE
19.5.4 MIDDLE EAST & AFRICA
19.5.5 SOUTH AMERICA
20 NORTH AMERICA VSAAS MARKET, BY REGION
20.1 NORTH AMERICA
20.1.1 U.S.
20.1.2 CANADA
20.1.3 MEXICO
21 NORTH AMERICA VSAAS MARKET: COMPANY LANDSCAPE
21.1 MANUFACTURER COMPANY SHARE ANALYSIS: GLOBAL
22 SWOT ANALYSIS
23 COMPANY PROFILES
23.1 HANGZHOU HIKVISION DIGITAL TECHNOLOGY CO., LTD.
23.1.1 COMPANY SNAPSHOT
23.1.2 REVENUE ANALYSIS
23.1.3 COMPANY SHARE ANALYSIS
23.1.4 PRODUCT PORTFOLIO
23.1.5 RECENT DEVELOPMENT
23.2 CISCO SYSTEMS, INC
23.2.1 COMPANY SNAPSHOT
23.2.2 REVENUE ANALYSIS
23.2.3 COMPANY SHARE ANALYSIS
23.2.4 PRODUCT PORTFOLIO
23.2.5 RECENT DEVELOPMENT
23.3 MOTOROLA SOLUTIONS, INC.
23.3.1 COMPANY SNAPSHOT
23.3.2 REVENUE ANALYSIS
23.3.3 COMPANY SHARE ANALYSIS
23.3.4 PRODUCT PORTFOLIO
23.3.5 RECENT DEVELOPMENT
23.4 HONEYWELL INTERNATIONAL INC.
23.4.1 COMPANY SNAPSHOT
23.4.2 REVENUE ANALYSIS
23.4.3 COMPANY SHARE ANALYSIS
23.4.4 PRODUCT PORTFOLIO
23.4.5 RECENT DEVELOPMENT
23.5 DAHUA TECHNOLOGY CO., LTD
23.5.1 COMPANY SNAPSHOT
23.5.2 COMPANY SHARE ANALYSIS
23.5.3 PRODUCT PORTFOLIO
23.5.4 RECENT DEVELOPMENT
23.6 ALARM.COM INCORPORATED.
23.6.1 COMPANY SNAPSHOT
23.6.2 REVENUE ANALYSIS
23.6.3 PRODUCT PORTFOLIO
23.6.4 RECENT DEVELOPMENTS
23.7 ALLGOVISION TECHNOLOGIES PVT. LTD.
23.7.1 COMPANY SNAPSHOT
23.7.2 PRODUCT PORTFOLIO
23.7.3 RECENT DEVELOPMENT
23.8 ARLO
23.8.1 COMPANY SNAPSHOT
23.8.2 REVENUE ANALYSIS
23.8.3 PRODUCT PORTFOLIO
23.8.4 RECENT DEVELOPMENT
23.9 CAMCLOUD INC.
23.9.1 COMPANY SNAPSHOT
23.9.2 PRODUCT PORTFOLIO
23.9.3 RECENT DEVELOPMENT
23.1 GENETEC INC.
23.10.1 COMPANY SNAPSHOT
23.10.2 PRODUCT PORTFOLIO
23.10.3 RECENT DEVELOPMENT
23.11 GORILLA TECHNOLOGY GROUP
23.11.1 COMPANY SNAPSHOT
23.11.2 REVENUE ANALYSIS
23.11.3 PRODUCT PORTFOLIO
23.11.4 RECENT DEVELOPMENTS
23.12 GRAYMATICS INC.
23.12.1 COMPANY SNAPSHOT
23.12.2 PRODUCT PORTFOLIO
23.12.3 RECENT DEVELOPMENT
23.13 HEXAGON AB
23.13.1 COMPANY SNAPSHOT
23.13.2 REVENUE ANALYSIS
23.13.3 PRODUCT PORTFOLIO
23.13.4 RECENT DEVELOPMENTS
23.14 INTUVISION, INC.
23.14.1 COMPANY SNAPSHOT
23.14.2 PRODUCT PORTFOLIO
23.14.3 RECENT DEVELOPMENT
23.15 IRISITY AB
23.15.1 COMPANY SNAPSHOT
23.15.2 REVENUE ANALYSIS
23.15.3 PRODUCT PORTFOLIO
23.15.4 RECENT DEVELOPMENTS
23.16 ISS CORP.
23.16.1 COMPANY SNAPSHOT
23.16.2 PRODUCT PORTFOLIO
23.16.3 RECENT DEVELOPMENT
23.17 IVIDEON
23.17.1 COMPANY SNAPSHOT
23.17.2 PRODUCT PORTFOLIO
23.17.3 RECENT DEVELOPMENT
23.18 JOHNSON CONTROLS
23.18.1 COMPANY SNAPSHOT
23.18.2 REVENUE ANALYSIS
23.18.3 PRODUCT PORTFOLIO
23.18.4 RECENT DEVELOPMENT
23.19 MILESTONE SYSTEMS A/S
23.19.1 COMPANY SNAPSHOT
23.19.2 PRODUCT PORTFOLIO
23.19.3 RECENT DEVELOPMENT
23.2 MORPHEAN SA
23.20.1 COMPANY SNAPSHOT
23.20.2 PRODUCT PORTFOLIO
23.20.3 RECENT DEVELOPMENT
23.21 PURETECH SYSTEMS.
23.21.1 COMPANY SNAPSHOT
23.21.2 PRODUCT PORTFOLIO
23.21.3 RECENT DEVELOPMENT
23.22 RHOMBUS SYSTEMS
23.22.1 COMPANY SNAPSHOT
23.22.2 PRODUCT PORTFOLIO
23.22.3 RECENT DEVELOPMENT
23.23 ROBERT BOSCH GMBH
23.23.1 COMPANY SNAPSHOT
23.23.2 REVENUE ANALYSIS
23.23.3 PRODUCT PORTFOLIO
23.23.4 RECENT DEVELOPMENT
23.24 SECURITAS AB
23.24.1 COMPANY SNAPSHOT
23.24.2 REVENUE ANALYSIS
23.24.3 PRODUCT PORTFOLIO
23.24.4 RECENT DEVELOPMENTS
23.25 VAIDIO.
23.25.1 COMPANY SNAPSHOT
23.25.2 PRODUCT PORTFOLIO
23.25.3 RECENT DEVELOPMENT
23.26 VERINT
23.26.1 COMPANY SNAPSHOT
23.26.2 PRODUCT PORTFOLIO
23.26.3 RECENT DEVELOPMENTS
23.27 VERKADA INC.
23.27.1 COMPANY SNAPSHOT
23.27.2 PRODUCT PORTFOLIO
23.27.3 RECENT DEVELOPMENT
23.28 VIDEOLOFT
23.28.1 COMPANY SNAPSHOT
23.28.2 PRODUCT PORTFOLIO
23.28.3 RECENT DEVELOPMENT
24 QUESTIONNAIRE
25 RELATED REPORTS
List of Table
TABLE 1 KEY FACTORS INFLUENCING COMPETITIVE RIVALRY
TABLE 2 KEY FACTORS INFLUENCING THREAT OF NEW ENTRANTS
TABLE 3 KEY FACTORS INFLUENCING SUPPLIER POWER
TABLE 4 KEY FACTORS INFLUENCING BUYER POWER
TABLE 5 KEY FACTORS INFLUENCING THREAT OF SUBSTITUTE PRODUCTS
TABLE 6 NORTH AMERICA VSAAS MARKET VALUE CHAIN OVERVIEW
TABLE 7 COMPARATIVE REGULATORY MATRIX
TABLE 8 UNIT PRICE RANGE OF VSAAS
TABLE 9 REGIONAL OPPORTUNITY MATRIX
TABLE 10 COMPARATIVE TECHNOLOGY MATRIX OF KEY PLAYERS IN THE NORTH AMERICA VSAAS MARKET
TABLE 11 COMPANY COMPARATIVE ANALYSIS
TABLE 12 COMPANY SERVICE PLATFORM MATRIX
TABLE 13 COUNTRY-LEVEL TARIFF IMPACT ON VSAAS HARDWARE (PRE VS POST U.S. TRADE ACTIONS)
TABLE 14 TARIFF & POLICY MAPPING ACROSS VSAAS VALUE CHAIN COMPONENTS
TABLE 15 ASSESSMENT OF TARIFF-INDUCED COST IMPLICATIONS ACROSS VSAAS STAKEHOLDERS
TABLE 16 MAPPING OF TARIFF AND TRADE POLICY–DRIVEN DISRUPTIONS ACROSS THE VSAAS SUPPLY CHAIN
TABLE 17 STRATEGIC RESPONSE FRAMEWORK ADOPTED BY OEMS IN THE VSAAS MARKET
TABLE 18 NORTH AMERICA VSAAS MARKET, BY VSAAS MODEL, 2018-2033 (USD THOUSAND)
TABLE 19 NORTH AMERICA HOSTED VSAAS IN VSAAS MARKET, BY REGION, 2018-2033 (USD THOUSAND)
TABLE 20 NORTH AMERICA MANAGED VSAAS IN VSAAS MARKET, BY REGION, 2018-2033 (USD THOUSAND)
TABLE 21 NORTH AMERICA HYBRID VSAAS IN VSAAS MARKET, BY REGION, 2018-2033 (USD THOUSAND)
TABLE 22 NORTH AMERICA SELF-MANAGED VSAAS IN VSAAS MARKET, BY REGION, 2018-2033 (USD THOUSAND)
TABLE 23 NORTH AMERICA OTHERS IN VSAAS MARKET, BY REGION, 2018-2033 (USD THOUSAND)
TABLE 24 NORTH AMERICA VSAAS MARKET, BY SYSTEM TYPE, 2018-2033 (USD THOUSAND)
TABLE 25 NORTH AMERICA IP-BASED VSAAS IN VSAAS MARKET, BY TYPE, 2018-2033 (USD THOUSAND)
TABLE 26 NORTH AMERICA IP-BASED VSAAS IN VSAAS MARKET, BY REGION, 2018-2033 (USD THOUSAND)
TABLE 27 NORTH AMERICA HYBRID SURVEILLANCE SYSTEMS IN VSAAS MARKET, BY TYPE, 2018-2033 (USD THOUSAND)
TABLE 28 NORTH AMERICA HYBRID SURVEILLANCE SYSTEMS IN VSAAS MARKET, BY REGION, 2018-2033 (USD THOUSAND)
TABLE 29 NORTH AMERICA ANALOG-TO-CLOUD SURVEILLANCE IN VSAAS MARKET, BY REGION, 2018-2033 (USD THOUSAND)
TABLE 30 NORTH AMERICA OTHERS IN VSAAS MARKET, BY REGION, 2018-2033 (USD THOUSAND)
TABLE 31 NORTH AMERICA VSAAS MARKET, BY COMPONENT, 2018-2033 (USD THOUSAND)
TABLE 32 NORTH AMERICA SERVICES IN VSAAS MARKET, BY TYPE, 2018-2033 (USD THOUSAND)
TABLE 33 NORTH AMERICA SERVICES IN VSAAS MARKET, BY REGION, 2018-2033 (USD THOUSAND)
TABLE 34 NORTH AMERICA SOFTWARE IN VSAAS MARKET, BY TYPE, 2018-2033 (USD THOUSAND)
TABLE 35 NORTH AMERICA SOFTWARE IN VSAAS MARKET, BY REGION, 2018-2033 (USD THOUSAND)
TABLE 36 NORTH AMERICA HARDWARE IN VSAAS MARKET, BY TYPE, 2018-2033 (USD THOUSAND)
TABLE 37 NORTH AMERICA HARDWARE IN VSAAS MARKET, BY REGION, 2018-2033 (USD THOUSAND)
TABLE 38 NORTH AMERICA VSAAS MARKET, BY TECHNOLOGY, 2018-2033 (USD THOUSAND)
TABLE 39 NORTH AMERICA AI-ENABLED VSAAS IN VSAAS MARKET, BY TYPE, 2018-2033 (USD THOUSAND)
TABLE 40 NORTH AMERICA AI-ENABLED VSAAS IN VSAAS MARKET, BY REGION, 2018-2033 (USD THOUSAND)
TABLE 41 NORTH AMERICA NON-AI VSAAS IN VSAAS MARKET, BY REGION, 2018-2033 (USD THOUSAND)
TABLE 42 NORTH AMERICA EDGE AI SURVEILLANCE IN VSAAS MARKET, BY REGION, 2018-2033 (USD THOUSAND)
TABLE 43 NORTH AMERICA IOT-INTEGRATED SURVEILLANCE IN VSAAS MARKET, BY REGION, 2018-2033 (USD THOUSAND)
TABLE 44 NORTH AMERICA OTHERS IN VSAAS MARKET, BY REGION, 2018-2033 (USD THOUSAND)
TABLE 45 NORTH AMERICA VSAAS MARKET, BY DEPLOYMENT ENVIRONMENT, 2018-2033 (USD THOUSAND)
TABLE 46 NORTH AMERICA CLOUD IN VSAAS MARKET, BY TYPE, 2018-2033 (USD THOUSAND)
TABLE 47 NORTH AMERICA CLOUD IN VSAAS MARKET, BY REGION, 2018-2033 (USD THOUSAND)
TABLE 48 NORTH AMERICA ON-PREMISE IN VSAAS MARKET, BY REGION, 2018-2033 (USD THOUSAND)
TABLE 49 NORTH AMERICA HYBRID IN VSAAS MARKET, BY REGION, 2018-2033 (USD THOUSAND)
TABLE 50 NORTH AMERICA MULTI-SITE SURVEILLANCE IN VSAAS MARKET, BY REGION, 2018-2033 (USD THOUSAND)
TABLE 51 NORTH AMERICA SINGLE-SITE SURVEILLANCE IN VSAAS MARKET, BY REGION, 2018-2033 (USD THOUSAND)
TABLE 52 NORTH AMERICA VSAAS MARKET, BY STORAGE ARCHITECTURE, 2018-2033 (USD THOUSAND)
TABLE 53 NORTH AMERICA CLOUD STORAGE IN VSAAS MARKET, BY REGION, 2018-2033 (USD THOUSAND)
TABLE 54 NORTH AMERICA EDGE STORAGE IN VSAAS MARKET, BY REGION, 2018-2033 (USD THOUSAND)
TABLE 55 NORTH AMERICA NETWORK VIDEO RECORDERS IN VSAAS MARKET, BY REGION, 2018-2033 (USD THOUSAND)
TABLE 56 NORTH AMERICA CAMERA EDGE STORAGE IN VSAAS MARKET, BY REGION, 2018-2033 (USD THOUSAND)
TABLE 57 NORTH AMERICA DISTRIBUTED CLOUD STORAGE IN VSAAS MARKET, BY REGION, 2018-2033 (USD THOUSAND)
TABLE 58 NORTH AMERICA LOCAL DATA SERVERS IN VSAAS MARKET, BY REGION, 2018-2033 (USD THOUSAND)
TABLE 59 NORTH AMERICA EDGE GATEWAY STORAGE IN VSAAS MARKET, BY REGION, 2018-2033 (USD THOUSAND)
TABLE 60 NORTH AMERICA OTHERS IN VSAAS MARKET, BY REGION, 2018-2033 (USD THOUSAND)
TABLE 61 NORTH AMERICA VSAAS MARKET, BY ORGANIZATION SIZE, 2018-2033 (USD THOUSAND)
TABLE 62 NORTH AMERICA LARGE ENTERPRISES IN VSAAS MARKET, BY REGION, 2018-2033 (USD THOUSAND)
TABLE 63 NORTH AMERICA SMALL & MEDIUM ENTERPRISES (SMES) IN VSAAS MARKET, BY REGION, 2018-2033 (USD THOUSAND)
TABLE 64 NORTH AMERICA VSAAS MARKET, BY CAMERA TYPE, 2018-2033 (USD THOUSAND)
TABLE 65 NORTH AMERICA DOME CAMERAS IN VSAAS MARKET, BY REGION, 2018-2033 (USD THOUSAND)
TABLE 66 NORTH AMERICA BULLET CAMERAS IN VSAAS MARKET, BY REGION, 2018-2033 (USD THOUSAND)
TABLE 67 NORTH AMERICA PTZ CAMERAS IN VSAAS MARKET, BY REGION, 2018-2033 (USD THOUSAND)
TABLE 68 NORTH AMERICA FISHEYE CAMERAS IN VSAAS MARKET, BY REGION, 2018-2033 (USD THOUSAND)
TABLE 69 NORTH AMERICA PANORAMIC CAMERAS IN VSAAS MARKET, BY REGION, 2018-2033 (USD THOUSAND)
TABLE 70 NORTH AMERICA THERMAL CAMERAS IN VSAAS MARKET, BY REGION, 2018-2033 (USD THOUSAND)
TABLE 71 NORTH AMERICA BODY-WORN CAMERAS IN VSAAS MARKET, BY REGION, 2018-2033 (USD THOUSAND)
TABLE 72 NORTH AMERICA MOBILE CAMERAS IN VSAAS MARKET, BY REGION, 2018-2033 (USD THOUSAND)
TABLE 73 NORTH AMERICA OTHERS IN VSAAS MARKET, BY REGION, 2018-2033 (USD THOUSAND)
TABLE 74 NORTH AMERICA VSAAS MARKET, BY APPLICATION, 2018-2033 (USD THOUSAND)
TABLE 75 NORTH AMERICA SECURITY & SURVEILLANCE IN VSAAS MARKET, BY REGION, 2018-2033 (USD THOUSAND)
TABLE 76 NORTH AMERICA REMOTE MONITORING IN VSAAS MARKET, BY REGION, 2018-2033 (USD THOUSAND)
TABLE 77 NORTH AMERICA INCIDENT DETECTION IN VSAAS MARKET, BY REGION, 2018-2033 (USD THOUSAND)
TABLE 78 NORTH AMERICA ACCESS CONTROL INTEGRATION IN VSAAS MARKET, BY REGION, 2018-2033 (USD THOUSAND)
TABLE 79 NORTH AMERICA TRAFFIC MONITORING IN VSAAS MARKET, BY REGION, 2018-2033 (USD THOUSAND)
TABLE 80 NORTH AMERICA SMART CITY MONITORING IN VSAAS MARKET, BY REGION, 2018-2033 (USD THOUSAND)
TABLE 81 NORTH AMERICA RETAIL ANALYTICS IN VSAAS MARKET, BY REGION, 2018-2033 (USD THOUSAND)
TABLE 82 NORTH AMERICA OPERATIONAL MONITORING IN VSAAS MARKET, BY REGION, 2018-2033 (USD THOUSAND)
TABLE 83 NORTH AMERICA OTHERS IN VSAAS MARKET, BY REGION, 2018-2033 (USD THOUSAND)
TABLE 84 NORTH AMERICA BFSI IN VSAAS MARKET, BY END-USER, 2018-2033 (USD THOUSAND)
TABLE 85 NORTH AMERICA COMMERCIAL IN VSAAS MARKET, BY TYPE, 2018-2033 (USD THOUSAND)
TABLE 86 NORTH AMERICA COMMERCIAL IN VSAAS MARKET, BY VSAAS MODEL, 2018-2033 (USD THOUSAND)
TABLE 87 NORTH AMERICA COMMERCIAL IN VSAAS MARKET, BY REGION, 2018-2033 (USD THOUSAND)
TABLE 88 NORTH AMERICA INDUSTRIAL IN VSAAS MARKET, BY TYPE, 2018-2033 (USD THOUSAND)
TABLE 89 NORTH AMERICA INDUSTRIAL IN VSAAS MARKET, BY VSAAS MODEL, 2018-2033 (USD THOUSAND)
TABLE 90 NORTH AMERICA INDUSTRIAL IN VSAAS MARKET, BY REGION, 2018-2033 (USD THOUSAND)
TABLE 91 NORTH AMERICA INFRASTRUCTURE IN VSAAS MARKET, BY TYPE, 2018-2033 (USD THOUSAND)
TABLE 92 NORTH AMERICA INFRASTRUCTURE IN VSAAS MARKET, BY VSAAS MODEL, 2018-2033 (USD THOUSAND)
TABLE 93 NORTH AMERICA INFRASTRUCTURE IN VSAAS MARKET, BY REGION, 2018-2033 (USD THOUSAND)
TABLE 94 NORTH AMERICA GOVERNMENT & PUBLIC FACILITIES IN VSAAS MARKET, BY TYPE, 2018-2033 (USD THOUSAND)
TABLE 95 NORTH AMERICA GOVERNMENT & PUBLIC FACILITIES IN VSAAS MARKET, BY VSAAS MODEL, 2018-2033 (USD THOUSAND)
TABLE 96 NORTH AMERICA GOVERNMENT & PUBLIC FACILITIES IN VSAAS MARKET, BY REGION, 2018-2033 (USD THOUSAND)
TABLE 97 NORTH AMERICA RESIDENTIAL IN VSAAS MARKET, BY TYPE, 2018-2033 (USD THOUSAND)
TABLE 98 NORTH AMERICA RESIDENTIAL IN VSAAS MARKET, BY VSAAS MODEL, 2018-2033 (USD THOUSAND)
TABLE 99 NORTH AMERICA RESIDENTIAL IN VSAAS MARKET, BY REGION, 2018-2033 (USD THOUSAND)
TABLE 100 NORTH AMERICA DEFENSE & MILITARY IN VSAAS MARKET, BY TYPE, 2018-2033 (USD THOUSAND)
TABLE 101 NORTH AMERICA DEFENSE & MILITARY IN VSAAS MARKET, BY VSAAS MODEL, 2018-2033 (USD THOUSAND)
TABLE 102 NORTH AMERICA DEFENSE & MILITARY IN VSAAS MARKET, BY REGION, 2018-2033 (USD THOUSAND)
TABLE 103 NORTH AMERICA HEALTHCARE IN VSAAS MARKET, BY TYPE, 2018-2033 (USD THOUSAND)
TABLE 104 NORTH AMERICA HEALTHCARE IN VSAAS MARKET, BY VSAAS MODEL, 2018-2033 (USD THOUSAND)
TABLE 105 NORTH AMERICA HEALTHCARE IN VSAAS MARKET, BY REGION, 2018-2033 (USD THOUSAND)
TABLE 106 NORTH AMERICA EDUCATION IN VSAAS MARKET, BY TYPE, 2018-2033 (USD THOUSAND)
TABLE 107 NORTH AMERICA SCHOOLS IN VSAAS MARKET, BY TYPE, 2018-2033 (USD THOUSAND)
TABLE 108 NORTH AMERICA EDUCATION IN VSAAS MARKET, BY VSAAS MODEL, 2018-2033 (USD THOUSAND)
TABLE 109 NORTH AMERICA EDUCATION IN VSAAS MARKET, BY REGION, 2018-2033 (USD THOUSAND)
TABLE 110 NORTH AMERICA OTHERS IN VSAAS MARKET, BY TYPE, 2018-2033 (USD THOUSAND)
TABLE 111 NORTH AMERICA OTHERS IN VSAAS MARKET, BY REGION, 2018-2033 (USD THOUSAND)
TABLE 112 NORTH AMERICA VSAAS MARKET, BY CONNECTIVITY TECHNOLOGY, 2018-2033 (USD THOUSAND)
TABLE 113 NORTH AMERICA WIRED SURVEILLANCE SYSTEMS IN VSAAS MARKET, BY REGION, 2018-2033 (USD THOUSAND)
TABLE 114 NORTH AMERICA WIRELESS SURVEILLANCE SYSTEMS IN VSAAS MARKET, BY TYPE, 2018-2033 (USD THOUSAND)
TABLE 115 NORTH AMERICA WIRELESS SURVEILLANCE SYSTEMS IN VSAAS MARKET, BY REGION, 2018-2033 (USD THOUSAND)
TABLE 116 NORTH AMERICA HYBRID CONNECTIVITY SYSTEMS IN VSAAS MARKET, BY REGION, 2018-2033 (USD THOUSAND)
TABLE 117 NORTH AMERICA VSAAS MARKET, BY RESOLUTION, 2018-2033 (USD THOUSAND)
TABLE 118 NORTH AMERICA FULL HD (1080P) IN VSAAS MARKET, BY REGION, 2018-2033 (USD THOUSAND)
TABLE 119 NORTH AMERICA 4K / ULTRA HD IN VSAAS MARKET, BY REGION, 2018-2033 (USD THOUSAND)
TABLE 120 NORTH AMERICA HD (720P) IN VSAAS MARKET, BY REGION, 2018-2033 (USD THOUSAND)
TABLE 121 NORTH AMERICA 8K SURVEILLANCE CAMERAS IN VSAAS MARKET, BY REGION, 2018-2033 (USD THOUSAND)
TABLE 122 NORTH AMERICA VSAAS MARKET, BY MONITORING TYPE, 2018-2033 (USD THOUSAND)
TABLE 123 NORTH AMERICA REAL-TIME MONITORING IN VSAAS MARKET, BY REGION, 2018-2033 (USD THOUSAND)
TABLE 124 NORTH AMERICA CONTINUOUS MONITORING IN VSAAS MARKET, BY REGION, 2018-2033 (USD THOUSAND)
TABLE 125 NORTH AMERICA EVENT-BASED MONITORING IN VSAAS MARKET, BY REGION, 2018-2033 (USD THOUSAND)
TABLE 126 NORTH AMERICA REMOTE MONITORING IN VSAAS MARKET, BY REGION, 2018-2033 (USD THOUSAND)
TABLE 127 NORTH AMERICA VSAAS MARKET, BY INTEGRATION CAPABILITY, 2018-2033 (USD THOUSAND)
TABLE 128 NORTH AMERICA STANDALONE VSAAS PLATFORMS IN VSAAS MARKET, BY REGION, 2018-2033 (USD THOUSAND)
TABLE 129 NORTH AMERICA INTEGRATED SECURITY PLATFORMS IN VSAAS MARKET, BY TYPE, 2018-2033 (USD THOUSAND)
TABLE 130 NORTH AMERICA INTEGRATED SECURITY PLATFORMS IN VSAAS MARKET, BY REGION, 2018-2033 (USD THOUSAND)
TABLE 131 NORTH AMERICA VSAAS MARKET, BY COUNTRY, 2018-2033 (USD THOUSAND)
TABLE 132 NORTH AMERICA VSAAS MARKET, BY VSAAS MODEL, 2018-2033 (USD THOUSAND)
TABLE 133 NORTH AMERICA VSAAS MARKET, BY SYSTEM TYPE, 2018-2033 (USD THOUSAND)
TABLE 134 NORTH AMERICA IP-BASED VSAAS IN VSAAS MARKET, BY TYPE, 2018-2033 (USD THOUSAND)
TABLE 135 NORTH AMERICA HYBRID SURVEILLANCE SYSTEMS IN VSAAS MARKET, BY TYPE, 2018-2033 (USD THOUSAND)
TABLE 136 NORTH AMERICA VSAAS MARKET, BY COMPONENT, 2018-2033 (USD THOUSAND)
TABLE 137 NORTH AMERICA SERVICES IN VSAAS MARKET, BY TYPE, 2018-2033 (USD THOUSAND)
TABLE 138 NORTH AMERICA SOFTWARE IN VSAAS MARKET, BY TYPE, 2018-2033 (USD THOUSAND)
TABLE 139 NORTH AMERICA HARDWARE IN VSAAS MARKET, BY TYPE, 2018-2033 (USD THOUSAND)
TABLE 140 NORTH AMERICA VSAAS MARKET, BY TECHNOLOGY, 2018-2033 (USD THOUSAND)
TABLE 141 NORTH AMERICA AI-ENABLED VSAAS IN VSAAS MARKET, BY TYPE, 2018-2033 (USD THOUSAND)
TABLE 142 NORTH AMERICA VSAAS MARKET, BY DEPLOYMENT ENVIRONMENT, 2018-2033 (USD THOUSAND)
TABLE 143 NORTH AMERICA CLOUD IN VSAAS MARKET, BY TYPE, 2018-2033 (USD THOUSAND)
TABLE 144 NORTH AMERICA VSAAS MARKET, BY STORAGE ARCHITECTURE, 2018-2033 (USD THOUSAND)
TABLE 145 NORTH AMERICA VSAAS MARKET, BY ORGANIZATION SIZE, 2018-2033 (USD THOUSAND)
TABLE 146 NORTH AMERICA VSAAS MARKET, BY CAMERA TYPE, 2018-2033 (USD THOUSAND)
TABLE 147 NORTH AMERICA VSAAS MARKET, BY APPLICATION, 2018-2033 (USD THOUSAND)
TABLE 148 NORTH AMERICA BFSI IN VSAAS MARKET, BY END-USER, 2018-2033 (USD THOUSAND)
TABLE 149 NORTH AMERICA COMMERCIAL IN VSAAS MARKET, BY TYPE, 2018-2033 (USD THOUSAND)
TABLE 150 NORTH AMERICA COMMERCIAL IN VSAAS MARKET, BY VSAAS MODEL, 2018-2033 (USD THOUSAND)
TABLE 151 NORTH AMERICA INDUSTRIAL IN VSAAS MARKET, BY TYPE, 2018-2033 (USD THOUSAND)
TABLE 152 NORTH AMERICA INDUSTRIAL IN VSAAS MARKET, BY VSAAS MODEL, 2018-2033 (USD THOUSAND)
TABLE 153 NORTH AMERICA INFRASTRUCTURE IN VSAAS MARKET, BY TYPE, 2018-2033 (USD THOUSAND)
TABLE 154 NORTH AMERICA INFRASTRUCTURE IN VSAAS MARKET, BY VSAAS MODEL, 2018-2033 (USD THOUSAND)
TABLE 155 NORTH AMERICA GOVERNMENT & PUBLIC FACILITIES IN VSAAS MARKET, BY TYPE, 2018-2033 (USD THOUSAND)
TABLE 156 NORTH AMERICA GOVERNMENT & PUBLIC FACILITIES IN VSAAS MARKET, BY VSAAS MODEL, 2018-2033 (USD THOUSAND)
TABLE 157 NORTH AMERICA RESIDENTIAL IN VSAAS MARKET, BY TYPE, 2018-2033 (USD THOUSAND)
TABLE 158 NORTH AMERICA RESIDENTIAL IN VSAAS MARKET, BY VSAAS MODEL, 2018-2033 (USD THOUSAND)
TABLE 159 NORTH AMERICA DEFENSE & MILITARY IN VSAAS MARKET, BY TYPE, 2018-2033 (USD THOUSAND)
TABLE 160 NORTH AMERICA DEFENSE & MILITARY IN VSAAS MARKET, BY VSAAS MODEL, 2018-2033 (USD THOUSAND)
TABLE 161 NORTH AMERICA HEALTHCARE IN VSAAS MARKET, BY TYPE, 2018-2033 (USD THOUSAND)
TABLE 162 NORTH AMERICA HEALTHCARE IN VSAAS MARKET, BY VSAAS MODEL, 2018-2033 (USD THOUSAND)
TABLE 163 NORTH AMERICA EDUCATION IN VSAAS MARKET, BY TYPE, 2018-2033 (USD THOUSAND)
TABLE 164 NORTH AMERICA SCHOOLS IN VSAAS MARKET, BY TYPE, 2018-2033 (USD THOUSAND)
TABLE 165 NORTH AMERICA EDUCATION IN VSAAS MARKET, BY VSAAS MODEL, 2018-2033 (USD THOUSAND)
TABLE 166 NORTH AMERICA OTHERS IN VSAAS MARKET, BY TYPE, 2018-2033 (USD THOUSAND)
TABLE 167 NORTH AMERICA VSAAS MARKET, BY CONNECTIVITY TECHNOLOGY, 2018-2033 (USD THOUSAND)
TABLE 168 NORTH AMERICA WIRELESS SURVEILLANCE SYSTEMS IN VSAAS MARKET, BY TYPE, 2018-2033 (USD THOUSAND)
TABLE 169 NORTH AMERICA VSAAS MARKET, BY RESOLUTION, 2018-2033 (USD THOUSAND)
TABLE 170 NORTH AMERICA VSAAS MARKET, BY MONITORING TYPE, 2018-2033 (USD THOUSAND)
TABLE 171 NORTH AMERICA VSAAS MARKET, BY INTEGRATION CAPABILITY, 2018-2033 (USD THOUSAND)
TABLE 172 NORTH AMERICA INTEGRATED SECURITY PLATFORMS IN VSAAS MARKET, BY TYPE, 2018-2033 (USD THOUSAND)
TABLE 173 U.S. VSAAS MARKET, BY VSAAS MODEL, 2018-2033 (USD THOUSAND)
TABLE 174 U.S. VSAAS MARKET, BY SYSTEM TYPE, 2018-2033 (USD THOUSAND)
TABLE 175 U.S. IP-BASED VSAAS IN VSAAS MARKET, BY TYPE, 2018-2033 (USD THOUSAND)
TABLE 176 U.S. HYBRID SURVEILLANCE SYSTEMS IN VSAAS MARKET, BY TYPE, 2018-2033 (USD THOUSAND)
TABLE 177 U.S. VSAAS MARKET, BY COMPONENT, 2018-2033 (USD THOUSAND)
TABLE 178 U.S. SERVICES IN VSAAS MARKET, BY TYPE, 2018-2033 (USD THOUSAND)
TABLE 179 U.S. SOFTWARE IN VSAAS MARKET, BY TYPE, 2018-2033 (USD THOUSAND)
TABLE 180 U.S. HARDWARE IN VSAAS MARKET, BY TYPE, 2018-2033 (USD THOUSAND)
TABLE 181 U.S. VSAAS MARKET, BY TECHNOLOGY, 2018-2033 (USD THOUSAND)
TABLE 182 U.S. AI-ENABLED VSAAS IN VSAAS MARKET, BY TYPE, 2018-2033 (USD THOUSAND)
TABLE 183 U.S. VSAAS MARKET, BY DEPLOYMENT ENVIRONMENT, 2018-2033 (USD THOUSAND)
TABLE 184 U.S. CLOUD IN VSAAS MARKET, BY TYPE, 2018-2033 (USD THOUSAND)
TABLE 185 U.S. VSAAS MARKET, BY STORAGE ARCHITECTURE, 2018-2033 (USD THOUSAND)
TABLE 186 U.S. VSAAS MARKET, BY ORGANIZATION SIZE, 2018-2033 (USD THOUSAND)
TABLE 187 U.S. VSAAS MARKET, BY CAMERA TYPE, 2018-2033 (USD THOUSAND)
TABLE 188 U.S. VSAAS MARKET, BY APPLICATION, 2018-2033 (USD THOUSAND)
TABLE 189 U.S. BFSI IN VSAAS MARKET, BY END-USER, 2018-2033 (USD THOUSAND)
TABLE 190 U.S. COMMERCIAL IN VSAAS MARKET, BY TYPE, 2018-2033 (USD THOUSAND)
TABLE 191 U.S. COMMERCIAL IN VSAAS MARKET, BY VSAAS MODEL, 2018-2033 (USD THOUSAND)
TABLE 192 U.S. INDUSTRIAL IN VSAAS MARKET, BY TYPE, 2018-2033 (USD THOUSAND)
TABLE 193 U.S. INDUSTRIAL IN VSAAS MARKET, BY VSAAS MODEL, 2018-2033 (USD THOUSAND)
TABLE 194 U.S. INFRASTRUCTURE IN VSAAS MARKET, BY TYPE, 2018-2033 (USD THOUSAND)
TABLE 195 U.S. INFRASTRUCTURE IN VSAAS MARKET, BY VSAAS MODEL, 2018-2033 (USD THOUSAND)
TABLE 196 U.S. GOVERNMENT & PUBLIC FACILITIES IN VSAAS MARKET, BY TYPE, 2018-2033 (USD THOUSAND)
TABLE 197 U.S. GOVERNMENT & PUBLIC FACILITIES IN VSAAS MARKET, BY VSAAS MODEL, 2018-2033 (USD THOUSAND)
TABLE 198 U.S. RESIDENTIAL IN VSAAS MARKET, BY TYPE, 2018-2033 (USD THOUSAND)
TABLE 199 U.S. RESIDENTIAL IN VSAAS MARKET, BY VSAAS MODEL, 2018-2033 (USD THOUSAND)
TABLE 200 U.S. DEFENSE & MILITARY IN VSAAS MARKET, BY TYPE, 2018-2033 (USD THOUSAND)
TABLE 201 U.S. DEFENSE & MILITARY IN VSAAS MARKET, BY VSAAS MODEL, 2018-2033 (USD THOUSAND)
TABLE 202 U.S. HEALTHCARE IN VSAAS MARKET, BY TYPE, 2018-2033 (USD THOUSAND)
TABLE 203 U.S. HEALTHCARE IN VSAAS MARKET, BY VSAAS MODEL, 2018-2033 (USD THOUSAND)
TABLE 204 U.S. EDUCATION IN VSAAS MARKET, BY TYPE, 2018-2033 (USD THOUSAND)
TABLE 205 U.S. SCHOOLS IN VSAAS MARKET, BY TYPE, 2018-2033 (USD THOUSAND)
TABLE 206 U.S. EDUCATION IN VSAAS MARKET, BY VSAAS MODEL, 2018-2033 (USD THOUSAND)
TABLE 207 U.S. OTHERS IN VSAAS MARKET, BY TYPE, 2018-2033 (USD THOUSAND)
TABLE 208 U.S. VSAAS MARKET, BY CONNECTIVITY TECHNOLOGY, 2018-2033 (USD THOUSAND)
TABLE 209 U.S. WIRELESS SURVEILLANCE SYSTEMS IN VSAAS MARKET, BY TYPE, 2018-2033 (USD THOUSAND)
TABLE 210 U.S. VSAAS MARKET, BY RESOLUTION, 2018-2033 (USD THOUSAND)
TABLE 211 U.S. VSAAS MARKET, BY MONITORING TYPE, 2018-2033 (USD THOUSAND)
TABLE 212 U.S. VSAAS MARKET, BY INTEGRATION CAPABILITY, 2018-2033 (USD THOUSAND)
TABLE 213 U.S. INTEGRATED SECURITY PLATFORMS IN VSAAS MARKET, BY TYPE, 2018-2033 (USD THOUSAND)
TABLE 214 CANADA VSAAS MARKET, BY VSAAS MODEL, 2018-2033 (USD THOUSAND)
TABLE 215 CANADA VSAAS MARKET, BY SYSTEM TYPE, 2018-2033 (USD THOUSAND)
TABLE 216 CANADA IP-BASED VSAAS IN VSAAS MARKET, BY TYPE, 2018-2033 (USD THOUSAND)
TABLE 217 CANADA HYBRID SURVEILLANCE SYSTEMS IN VSAAS MARKET, BY TYPE, 2018-2033 (USD THOUSAND)
TABLE 218 CANADA VSAAS MARKET, BY COMPONENT, 2018-2033 (USD THOUSAND)
TABLE 219 CANADA SERVICES IN VSAAS MARKET, BY TYPE, 2018-2033 (USD THOUSAND)
TABLE 220 CANADA SOFTWARE IN VSAAS MARKET, BY TYPE, 2018-2033 (USD THOUSAND)
TABLE 221 CANADA HARDWARE IN VSAAS MARKET, BY TYPE, 2018-2033 (USD THOUSAND)
TABLE 222 CANADA VSAAS MARKET, BY TECHNOLOGY, 2018-2033 (USD THOUSAND)
TABLE 223 CANADA AI-ENABLED VSAAS IN VSAAS MARKET, BY TYPE, 2018-2033 (USD THOUSAND)
TABLE 224 CANADA VSAAS MARKET, BY DEPLOYMENT ENVIRONMENT, 2018-2033 (USD THOUSAND)
TABLE 225 CANADA CLOUD IN VSAAS MARKET, BY TYPE, 2018-2033 (USD THOUSAND)
TABLE 226 CANADA VSAAS MARKET, BY STORAGE ARCHITECTURE, 2018-2033 (USD THOUSAND)
TABLE 227 CANADA VSAAS MARKET, BY ORGANIZATION SIZE, 2018-2033 (USD THOUSAND)
TABLE 228 CANADA VSAAS MARKET, BY CAMERA TYPE, 2018-2033 (USD THOUSAND)
TABLE 229 CANADA VSAAS MARKET, BY APPLICATION, 2018-2033 (USD THOUSAND)
TABLE 230 CANADA BFSI IN VSAAS MARKET, BY END-USER, 2018-2033 (USD THOUSAND)
TABLE 231 CANADA COMMERCIAL IN VSAAS MARKET, BY TYPE, 2018-2033 (USD THOUSAND)
TABLE 232 CANADA COMMERCIAL IN VSAAS MARKET, BY VSAAS MODEL, 2018-2033 (USD THOUSAND)
TABLE 233 CANADA INDUSTRIAL IN VSAAS MARKET, BY TYPE, 2018-2033 (USD THOUSAND)
TABLE 234 CANADA INDUSTRIAL IN VSAAS MARKET, BY VSAAS MODEL, 2018-2033 (USD THOUSAND)
TABLE 235 CANADA INFRASTRUCTURE IN VSAAS MARKET, BY TYPE, 2018-2033 (USD THOUSAND)
TABLE 236 CANADA INFRASTRUCTURE IN VSAAS MARKET, BY VSAAS MODEL, 2018-2033 (USD THOUSAND)
TABLE 237 CANADA GOVERNMENT & PUBLIC FACILITIES IN VSAAS MARKET, BY TYPE, 2018-2033 (USD THOUSAND)
TABLE 238 CANADA GOVERNMENT & PUBLIC FACILITIES IN VSAAS MARKET, BY VSAAS MODEL, 2018-2033 (USD THOUSAND)
TABLE 239 CANADA RESIDENTIAL IN VSAAS MARKET, BY TYPE, 2018-2033 (USD THOUSAND)
TABLE 240 CANADA RESIDENTIAL IN VSAAS MARKET, BY VSAAS MODEL, 2018-2033 (USD THOUSAND)
TABLE 241 CANADA DEFENSE & MILITARY IN VSAAS MARKET, BY TYPE, 2018-2033 (USD THOUSAND)
TABLE 242 CANADA DEFENSE & MILITARY IN VSAAS MARKET, BY VSAAS MODEL, 2018-2033 (USD THOUSAND)
TABLE 243 CANADA HEALTHCARE IN VSAAS MARKET, BY TYPE, 2018-2033 (USD THOUSAND)
TABLE 244 CANADA HEALTHCARE IN VSAAS MARKET, BY VSAAS MODEL, 2018-2033 (USD THOUSAND)
TABLE 245 CANADA EDUCATION IN VSAAS MARKET, BY TYPE, 2018-2033 (USD THOUSAND)
TABLE 246 CANADA SCHOOLS IN VSAAS MARKET, BY TYPE, 2018-2033 (USD THOUSAND)
TABLE 247 CANADA EDUCATION IN VSAAS MARKET, BY VSAAS MODEL, 2018-2033 (USD THOUSAND)
TABLE 248 CANADA OTHERS IN VSAAS MARKET, BY TYPE, 2018-2033 (USD THOUSAND)
TABLE 249 CANADA VSAAS MARKET, BY CONNECTIVITY TECHNOLOGY, 2018-2033 (USD THOUSAND)
TABLE 250 CANADA WIRELESS SURVEILLANCE SYSTEMS IN VSAAS MARKET, BY TYPE, 2018-2033 (USD THOUSAND)
TABLE 251 CANADA VSAAS MARKET, BY RESOLUTION, 2018-2033 (USD THOUSAND)
TABLE 252 CANADA VSAAS MARKET, BY MONITORING TYPE, 2018-2033 (USD THOUSAND)
TABLE 253 CANADA VSAAS MARKET, BY INTEGRATION CAPABILITY, 2018-2033 (USD THOUSAND)
TABLE 254 CANADA INTEGRATED SECURITY PLATFORMS IN VSAAS MARKET, BY TYPE, 2018-2033 (USD THOUSAND)
TABLE 255 MEXICO VSAAS MARKET, BY VSAAS MODEL, 2018-2033 (USD THOUSAND)
TABLE 256 MEXICO VSAAS MARKET, BY SYSTEM TYPE, 2018-2033 (USD THOUSAND)
TABLE 257 MEXICO IP-BASED VSAAS IN VSAAS MARKET, BY TYPE, 2018-2033 (USD THOUSAND)
TABLE 258 MEXICO HYBRID SURVEILLANCE SYSTEMS IN VSAAS MARKET, BY TYPE, 2018-2033 (USD THOUSAND)
TABLE 259 MEXICO VSAAS MARKET, BY COMPONENT, 2018-2033 (USD THOUSAND)
TABLE 260 MEXICO SERVICES IN VSAAS MARKET, BY TYPE, 2018-2033 (USD THOUSAND)
TABLE 261 MEXICO SOFTWARE IN VSAAS MARKET, BY TYPE, 2018-2033 (USD THOUSAND)
TABLE 262 MEXICO HARDWARE IN VSAAS MARKET, BY TYPE, 2018-2033 (USD THOUSAND)
TABLE 263 MEXICO VSAAS MARKET, BY TECHNOLOGY, 2018-2033 (USD THOUSAND)
TABLE 264 MEXICO AI-ENABLED VSAAS IN VSAAS MARKET, BY TYPE, 2018-2033 (USD THOUSAND)
TABLE 265 MEXICO VSAAS MARKET, BY DEPLOYMENT ENVIRONMENT, 2018-2033 (USD THOUSAND)
TABLE 266 MEXICO CLOUD IN VSAAS MARKET, BY TYPE, 2018-2033 (USD THOUSAND)
TABLE 267 MEXICO VSAAS MARKET, BY STORAGE ARCHITECTURE, 2018-2033 (USD THOUSAND)
TABLE 268 MEXICO VSAAS MARKET, BY ORGANIZATION SIZE, 2018-2033 (USD THOUSAND)
TABLE 269 MEXICO VSAAS MARKET, BY CAMERA TYPE, 2018-2033 (USD THOUSAND)
TABLE 270 MEXICO VSAAS MARKET, BY APPLICATION, 2018-2033 (USD THOUSAND)
TABLE 271 MEXICO BFSI IN VSAAS MARKET, BY END-USER, 2018-2033 (USD THOUSAND)
TABLE 272 MEXICO COMMERCIAL IN VSAAS MARKET, BY TYPE, 2018-2033 (USD THOUSAND)
TABLE 273 MEXICO COMMERCIAL IN VSAAS MARKET, BY VSAAS MODEL, 2018-2033 (USD THOUSAND)
TABLE 274 MEXICO INDUSTRIAL IN VSAAS MARKET, BY TYPE, 2018-2033 (USD THOUSAND)
TABLE 275 MEXICO INDUSTRIAL IN VSAAS MARKET, BY VSAAS MODEL, 2018-2033 (USD THOUSAND)
TABLE 276 MEXICO INFRASTRUCTURE IN VSAAS MARKET, BY TYPE, 2018-2033 (USD THOUSAND)
TABLE 277 MEXICO INFRASTRUCTURE IN VSAAS MARKET, BY VSAAS MODEL, 2018-2033 (USD THOUSAND)
TABLE 278 MEXICO GOVERNMENT & PUBLIC FACILITIES IN VSAAS MARKET, BY TYPE, 2018-2033 (USD THOUSAND)
TABLE 279 MEXICO GOVERNMENT & PUBLIC FACILITIES IN VSAAS MARKET, BY VSAAS MODEL, 2018-2033 (USD THOUSAND)
TABLE 280 MEXICO RESIDENTIAL IN VSAAS MARKET, BY TYPE, 2018-2033 (USD THOUSAND)
TABLE 281 MEXICO RESIDENTIAL IN VSAAS MARKET, BY VSAAS MODEL, 2018-2033 (USD THOUSAND)
TABLE 282 MEXICO DEFENSE & MILITARY IN VSAAS MARKET, BY TYPE, 2018-2033 (USD THOUSAND)
TABLE 283 MEXICO DEFENSE & MILITARY IN VSAAS MARKET, BY VSAAS MODEL, 2018-2033 (USD THOUSAND)
TABLE 284 MEXICO HEALTHCARE IN VSAAS MARKET, BY TYPE, 2018-2033 (USD THOUSAND)
TABLE 285 MEXICO HEALTHCARE IN VSAAS MARKET, BY VSAAS MODEL, 2018-2033 (USD THOUSAND)
TABLE 286 MEXICO EDUCATION IN VSAAS MARKET, BY TYPE, 2018-2033 (USD THOUSAND)
TABLE 287 MEXICO SCHOOLS IN VSAAS MARKET, BY TYPE, 2018-2033 (USD THOUSAND)
TABLE 288 MEXICO EDUCATION IN VSAAS MARKET, BY VSAAS MODEL, 2018-2033 (USD THOUSAND)
TABLE 289 MEXICO OTHERS IN VSAAS MARKET, BY TYPE, 2018-2033 (USD THOUSAND)
TABLE 290 MEXICO VSAAS MARKET, BY CONNECTIVITY TECHNOLOGY, 2018-2033 (USD THOUSAND)
TABLE 291 MEXICO WIRELESS SURVEILLANCE SYSTEMS IN VSAAS MARKET, BY TYPE, 2018-2033 (USD THOUSAND)
TABLE 292 MEXICO VSAAS MARKET, BY RESOLUTION, 2018-2033 (USD THOUSAND)
TABLE 293 MEXICO VSAAS MARKET, BY MONITORING TYPE, 2018-2033 (USD THOUSAND)
TABLE 294 MEXICO VSAAS MARKET, BY INTEGRATION CAPABILITY, 2018-2033 (USD THOUSAND)
TABLE 295 MEXICO INTEGRATED SECURITY PLATFORMS IN VSAAS MARKET, BY TYPE, 2018-2033 (USD THOUSAND)
List of Figure
FIGURE 1 NORTH AMERICA VSAAS MARKET
FIGURE 2 NORTH AMERICA VSAAS MARKET: DATA TRIANGULATION
FIGURE 3 NORTH AMERICA VSAAS MARKET: DROC ANALYSIS
FIGURE 4 NORTH AMERICA VSAAS MARKET: REGIONAL VS COUNTRY MARKET ANALYSIS
FIGURE 5 NORTH AMERICA VSAAS MARKET: COMPANY RESEARCH ANALYSIS
FIGURE 6 NORTH AMERICA VSAAS MARKET: MULTIVARIATE MODELLING
FIGURE 7 NORTH AMERICA VSAAS MARKET: INTERVIEW DEMOGRAPHICS
FIGURE 8 NORTH AMERICA VSAAS MARKET: DBMR MARKET POSITION GRID
FIGURE 9 NORTH AMERICA VSAAS MARKET: VENDOR SHARE ANALYSIS
FIGURE 10 EXECUTIVE SUMMARY
FIGURE 11 NORTH AMERICA VSAAS MARKET: SEGMENTATION
FIGURE 12 STRATEGIC DECISIONS
FIGURE 13 FIVE SEGMENTS COMPRISE THE NORTH AMERICA VSAAS MARKET, BY TYPE (2025)
FIGURE 14 GROWING ADOPTION OF CLOUD INFRASTRUCTURE ACROSS ENTERPRISES ENABLES SCALABLE AND FLEXIBLE VIDEO SURVEILLANCE SOLUTIONS WITHOUT HEAVY UPFRONT CAPITAL EXPENDITURE IS EXPECTED TO DRIVE THE NORTH AMERICA VSAAS MARKET IN THE FORECAST PERIOD OF 2026 TO 2033
FIGURE 15 THE HOSTED VSAAS SEGMENT IS EXPECTED TO ACCOUNT FOR THE LARGEST MARKET SHARE OF THE NORTH AMERICA VSAAS MARKET IN 2026 AND 2033
FIGURE 16 VALUE CHAIN ANALYSIS
FIGURE 17 TOTAL PATENTS IN THE NORTH AMERICA VSAAS MARKET
FIGURE 18 REVENUE OPPORTUNITY MAPPING (SHORT, MEDIUM, LONG TERM)
FIGURE 19 AVERAGE TARIFF ON VSAAS HARDWARE COMPONENTS BY COUNTRY
FIGURE 20 DROC ANALYSIS
FIGURE 21 NORTH AMERICA VSAAS MARKET: BY VSAAS MODEL, 2025
FIGURE 22 NORTH AMERICA VSAAS MARKET: BY SYSTEM TYPE, 2025
FIGURE 23 NORTH AMERICA VSAAS MARKET: BY COMPONENT, 2025
FIGURE 24 NORTH AMERICA VSAAS MARKET: BY TECHNOLOGY, 2025
FIGURE 25 NORTH AMERICA VSAAS MARKET: BY ENVIRONMENT DEPLOYMENT, 2025
FIGURE 26 NORTH AMERICA VSAAS MARKET: BY STORAGE ARCHITECTURE, 2025
FIGURE 27 NORTH AMERICA VSAAS MARKET: BY ORGANIZATION SIZE, 2025
FIGURE 28 NORTH AMERICA VSAAS MARKET: BY CAMERA TYPE, 2025
FIGURE 29 NORTH AMERICA VSAAS MARKET: BY APPLICATION, 2025
FIGURE 30 NORTH AMERICA VSAAS MARKET: BY END USER, 2025
FIGURE 31 NORTH AMERICA VSAAS MARKET: BY CONNECTIVITY TECHNOLOGY, 2025
FIGURE 32 NORTH AMERICA VSAAS MARKET: BY RESOLUTION, 2025
FIGURE 33 NORTH AMERICA VSAAS MARKET: BY MONITORING TYPE, 2025
FIGURE 34 NORTH AMERICA VSAAS MARKET: BY INTEGRATION CAPABILITY, 2025
FIGURE 35 NORTH AMERICA VSAAS MARKET: SNAPSHOT (2025)
FIGURE 36 NORTH AMERICA VSAAS MARKET: COMPANY SHARE 2025 (%)
Data collection and base year analysis are done using data collection modules with large sample sizes. The stage includes obtaining market information or related data through various sources and strategies. It includes examining and planning all the data acquired from the past in advance. It likewise envelops the examination of information inconsistencies seen across different information sources. The market data is analysed and estimated using market statistical and coherent models. Also, market share analysis and key trend analysis are the major success factors in the market report. To know more, please request an analyst call or drop down your inquiry.
The key research methodology used by DBMR research team is data triangulation which involves data mining, analysis of the impact of data variables on the market and primary (industry expert) validation. Data models include Vendor Positioning Grid, Market Time Line Analysis, Market Overview and Guide, Company Positioning Grid, Patent Analysis, Pricing Analysis, Company Market Share Analysis, Standards of Measurement, Global versus Regional and Vendor Share Analysis. To know more about the research methodology, drop in an inquiry to speak to our industry experts.
Data Bridge Market Research is a leader in advanced formative research. We take pride in servicing our existing and new customers with data and analysis that match and suits their goal. The report can be customized to include price trend analysis of target brands understanding the market for additional countries (ask for the list of countries), clinical trial results data, literature review, refurbished market and product base analysis. Market analysis of target competitors can be analyzed from technology-based analysis to market portfolio strategies. We can add as many competitors that you require data about in the format and data style you are looking for. Our team of analysts can also provide you data in crude raw excel files pivot tables (Fact book) or can assist you in creating presentations from the data sets available in the report.


