
North America Water Detection Sensors Market
Market Size in USD Million
 USD
458.09 Million
USD
792.99 Million
2025
2033
USD
458.09 Million
USD
792.99 Million
2025
2033
| 2026 - 2033 | |
| USD 458.09 Million | |
| USD 792.99 Million | |
| % | |
|
North America Water Detection Sensors Market Size
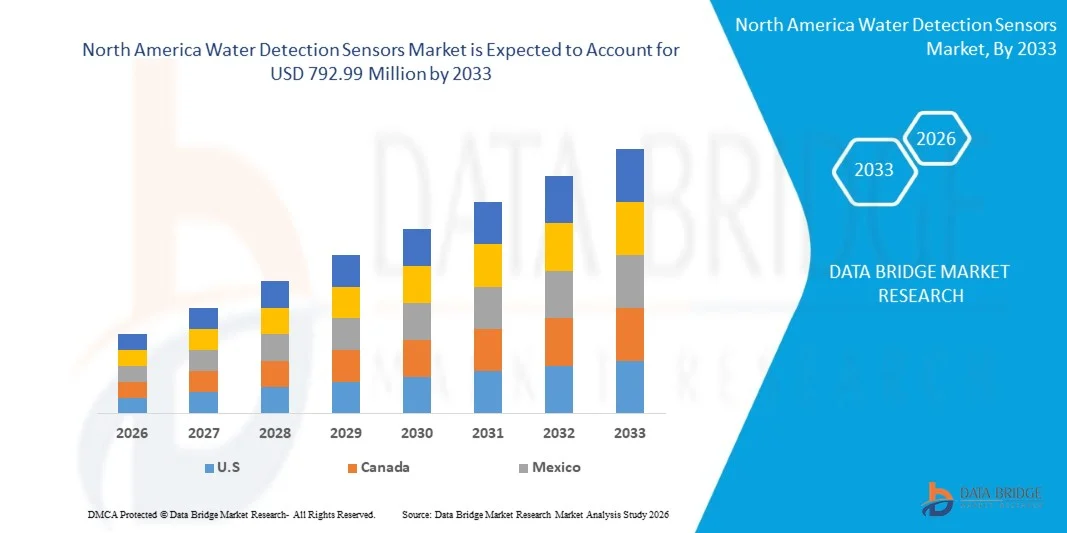
- The North America water detection sensors market size was valued at USD 458.09 million in 2025 and is expected to reach USD 792.99 million by 2033, at a CAGR of 7.10% during the forecast period
- The market growth is largely fuelled by increasing demand for automated leak detection in industrial, commercial, and residential sectors
- Rising adoption of IoT-enabled smart sensors for water monitoring and management is driving market expansion
North America Water Detection Sensors Market Analysis
- The market is witnessing rapid technological advancements, including wireless, smart, and multi-parameter sensors for precise water leakage and level detection
- Increasing integration of water detection sensors in smart buildings, industrial plants, and municipal water systems is enhancing operational efficiency and reducing maintenance costs
- U.S. dominated the water detection sensors market with the largest revenue share in 2025, driven by high adoption in commercial, industrial, and residential facilities and a strong focus on water conservation and damage prevention.
- Canada is expected to witness the highest compound annual growth rate (CAGR) in the North America water detection sensors market due to increasing investments in smart infrastructure and sustainable water management practices. Rising adoption of connected sensors in residential buildings, utilities, and industrial facilities, along with government initiatives focused on water conservation and leak prevention, is supporting rapid market expansion
- The Chlorine Residual Sensor segment held the largest market revenue share in 2025, driven by its widespread use in monitoring water quality in industrial and drinking water applications. These sensors provide accurate, real-time measurements of chlorine levels, ensuring water safety, regulatory compliance, and operational efficiency
Report Scope and North America Water Detection Sensors Market Segmentation
|
Attributes |
North America Water Detection Sensors Key Market Insights |
|
Segments Covered |
|
|
Countries Covered |
North America
|
|
Key Market Players |
|
|
Market Opportunities |
|
|
Value Added Data Infosets |
In addition to the insights on market scenarios such as market value, growth rate, segmentation, geographical coverage, and major players, the market reports curated by the Data Bridge Market Research also include in-depth expert analysis, geographically represented company-wise production and capacity, network layouts of distributors and partners, detailed and updated price trend analysis and deficit analysis of supply chain and demand. |
North America Water Detection Sensors Market Trends
“Rise of Smart and Real-Time Water Detection Systems”
• The growing adoption of smart water detection sensors is transforming the water management landscape by enabling real-time monitoring and leakage detection. These sensors allow immediate identification of water ingress or pipeline leaks, reducing operational losses and preventing property damage. Integration with IoT platforms allows automated alerts and predictive maintenance, further minimizing downtime and costly repairs. Advanced analytics provide actionable insights for water usage optimization and resource conservation
• Increasing demand for rapid and precise detection in industrial, commercial, and residential settings is accelerating the adoption of IoT-enabled sensors and automated alert systems. These solutions are particularly effective in critical infrastructure where timely detection prevents costly downtime and water-related damage. Smart sensors also support remote monitoring through mobile and cloud-based applications, enabling operators to manage multiple sites efficiently. The data collected can be used for compliance reporting and predictive maintenance planning
• The affordability, ease of deployment, and scalability of modern water detection sensors are making them attractive for widespread usage. Operators benefit from continuous monitoring without heavy manual inspection, enhancing preventive maintenance and operational efficiency. Modular sensor designs allow flexible installation in new and existing infrastructure, reducing retrofitting costs. These solutions support both large-scale industrial setups and smaller commercial or residential applications, broadening market reach
• For instance, in 2023, several commercial facilities integrated smart water sensors into their building management systems, enabling early leak detection, reducing water wastage, and lowering maintenance costs. The automated notifications allowed maintenance teams to respond immediately, preventing extensive damage. Implementation of these sensors also helped reduce insurance premiums and enhanced overall sustainability credentials of the facilities
• While smart detection systems are improving water management and reducing losses, their effectiveness depends on continued innovation, integration with building systems, and ease of maintenance. Manufacturers must focus on robust, scalable, and cost-effective solutions to fully capitalize on growing market demand. Increasing interoperability with other building automation systems and AI-powered analytics will further strengthen operational efficiency and reduce false alarms
North America Water Detection Sensors Market Dynamics
Driver
“Increasing Water Conservation Efforts and Focus on Infrastructure Safety”
• Rising concerns over water scarcity and the need for efficient water management are driving adoption of advanced water detection sensors. These systems help detect leaks, prevent water loss, and support sustainability initiatives. They also play a critical role in minimizing environmental impact and promoting responsible resource management in commercial and industrial sectors. Widespread awareness campaigns about water conservation are further encouraging adoption
• Growing investments in smart building infrastructure and automated monitoring systems are enhancing demand for connected water sensors that integrate with building management platforms. The integration enables real-time dashboards, remote alerts, and predictive maintenance, ensuring operational continuity. Organizations are increasingly leveraging cloud-based analytics to optimize water usage and reduce operational costs while meeting regulatory requirements
• Industrial and commercial operators are increasingly prioritizing water damage prevention to avoid costly repairs, downtime, and regulatory penalties, accelerating the deployment of smart detection technologies. The ability to monitor critical points continuously and predict potential failures helps minimize operational risks. Water sensors are now being adopted as part of broader facility management strategies to ensure sustainability, safety, and regulatory compliance
• For instance, in 2023, multiple manufacturing facilities implemented IoT-enabled water detection sensors, reducing water-related operational disruptions and improving resource efficiency. These implementations also allowed predictive maintenance scheduling, preventing costly emergency repairs. In addition, companies reported improved operational KPIs, such as reduced water loss, enhanced asset lifespan, and lower operational downtime
• While rising awareness and technological adoption are driving market growth, sensor reliability, integration capability, and system scalability remain critical for sustained expansion. Continuous improvement in sensor accuracy, wireless connectivity, and AI-based data analysis is essential for maximizing return on investment. Strong after-sales support and user-friendly interfaces are also vital to maintaining high adoption rates
Restraint/Challenge
“High Costs and Maintenance Requirements of Advanced Water Detection Systems”
• The high initial investment for advanced water detection sensors, especially IoT-enabled or real-time monitoring systems, limits adoption among smaller facilities and residential users. Implementation costs, including installation, software licensing, and sensor calibration, can be prohibitive. Smaller operators may delay adoption until costs decrease or integrated solutions become more affordable
• Maintenance and calibration requirements for sophisticated sensors can increase operational complexity and costs, reducing overall accessibility. Sensors require periodic testing, firmware updates, and sometimes replacement of parts to maintain accuracy. The need for skilled personnel to manage these processes adds further operational overhead, impacting adoption in resource-constrained environments
• Integration challenges with existing building or industrial management systems may delay deployment and reduce operational efficiency. Compatibility issues with legacy systems or third-party platforms can necessitate additional investment in middleware or custom integration. Ensuring seamless interoperability while maintaining system security remains a challenge for many operators
• For instance, in 2023, several small commercial operators postponed sensor installation due to high equipment and integration costs, highlighting affordability as a key barrier. In some cases, delayed implementation resulted in higher water-related damages, illustrating the trade-off between cost and risk mitigation. Businesses emphasized the need for modular, easy-to-install solutions to overcome these challenges
• While technological innovation continues to advance sensor capabilities, addressing cost-effectiveness, maintenance simplicity, and seamless system integration is essential for unlocking the market’s full potential. Manufacturers focusing on plug-and-play solutions, subscription-based pricing models, and AI-powered predictive maintenance are likely to see faster adoption and higher market penetration
North America Water Detection Sensors Market Scope
The market is segmented on the basis of sensor type, size, weight, device range, voltage range, purpose, connectivity, and end use.
• By Sensor Type
On the basis of sensor type, the North America water detection sensors market is segmented into Chlorine Residual Sensor, pH Sensor, TOC Sensor, ORP Sensor, Conductivity Sensor, and Others. The Chlorine Residual Sensor segment held the largest market revenue share in 2025, driven by its widespread use in monitoring water quality in industrial and drinking water applications. These sensors provide accurate, real-time measurements of chlorine levels, ensuring water safety, regulatory compliance, and operational efficiency.
The pH Sensor segment is expected to witness the fastest growth rate from 2026 to 2033, driven by its critical role in maintaining chemical balance and preventing corrosion in water systems. pH sensors are increasingly integrated with IoT-enabled monitoring systems, allowing real-time alerts and remote management. Their compact size and ease of installation make them suitable for a variety of industrial and municipal water applications, supporting sustainable water management practices.
• By Size
On the basis of size, the North America water detection sensors market is segmented into Less Than 38 mm and More Than 38 mm. The Less Than 38 mm segment held the largest market revenue share in 2025, owing to the demand for compact, space-saving sensors that can be easily installed in tight pipelines and confined water systems. Smaller sensors are increasingly preferred for modular installations and portable detection devices.
The More Than 38 mm segment is expected to witness the fastest growth from 2026 to 2033 due to its suitability for high-flow industrial water systems and large-scale treatment plants, where durability and robust performance are required. Larger sensors offer enhanced measurement stability and longer operational lifespan, making them ideal for continuous monitoring applications.
• By Weight
On the basis of weight, the North America water detection sensors market is segmented into Less Than 60 gms and More Than 60 gms. The Less Than 60 gms segment held the largest revenue share in 2025, driven by the growing adoption of lightweight, portable water sensors for easy handling and installation. These sensors are particularly suitable for field inspections, mobile water quality testing, and remote monitoring.
The More Than 60 gms segment is expected to register the fastest growth rate from 2026 to 2033, fueled by demand for heavy-duty, industrial-grade sensors that provide higher durability and resistance to harsh operational conditions. These sensors are widely used in wastewater treatment and large-scale aquaculture systems where robustness is critical.
• By Device Range
On the basis of device range, the North America water detection sensors market is segmented into Less Than 250 ft and More Than 250 ft. The Less Than 250 ft segment held the largest revenue share in 2025, driven by its suitability for localized water monitoring in residential, industrial, and municipal settings. Short-range sensors allow precise monitoring of small-scale systems and reduce latency in data collection.
The More Than 250 ft segment is expected to witness the fastest growth rate from 2026 to 2033 due to its application in large distribution networks and industrial plants. Long-range sensors support centralized monitoring and integration with SCADA systems, enabling real-time alerts and preventive maintenance across extended water networks.
• By Voltage Range
On the basis of voltage range, the North America water detection sensors market is segmented into Less Than 15 VDC, 15 VDC To 25 VDC, and More Than 25 VDC. The Less Than 15 VDC segment held the largest market revenue share in 2025, driven by the low power requirements and compatibility with battery-operated and portable water detection devices. Energy-efficient sensors are increasingly preferred in sustainable water monitoring systems.
The 15 VDC To 25 VDC segment is expected to witness the fastest growth rate from 2026 to 2033 due to its balance between power efficiency and sensor performance. These sensors are widely deployed in industrial applications where stable voltage operation is critical for accurate measurements.
• By Purpose
On the basis of purpose, the North America water detection sensors market is segmented into Constitute In Water (Chemical Concentrations, Solids) and Measure Surrogates. The Constitute In Water segment held the largest revenue share in 2025, fueled by growing regulatory compliance requirements and the need for precise monitoring of water contaminants. These sensors enable real-time detection of chemical levels, solids, and pollutants.
The Measure Surrogates segment is expected to witness the fastest growth rate from 2026 to 2033, driven by demand for indirect monitoring solutions that estimate water quality parameters using surrogate indicators. Surrogate measurement allows cost-effective, rapid assessment of water systems, reducing the need for frequent laboratory testing.
• By Connectivity
On the basis of connectivity, the North America water detection sensors market is segmented into Wireless and Wired. The Wired segment held the largest market revenue share in 2025, due to its reliability, stable data transmission, and suitability for integration into established water monitoring networks. Wired sensors are widely used in industrial plants, treatment facilities, and large municipal systems.
The Wireless segment is expected to witness the fastest growth rate from 2026 to 2033, driven by rising adoption of IoT-enabled water monitoring systems. Wireless connectivity enables remote monitoring, reduced installation costs, and flexibility for retrofitting in existing pipelines and distributed water networks.
• By End Use
On the basis of end use, the North America water detection sensors market is segmented into Industrial, Drinking Water, Ground Water, Aquaculture, Wastewater, and Others. The Industrial segment held the largest revenue share in 2025, owing to the critical need for leak detection and quality monitoring in manufacturing plants, food & beverage, and chemical industries. Industrial applications require continuous, accurate monitoring to prevent operational losses and ensure compliance with environmental regulations.
The Drinking Water segment is expected to witness the fastest growth rate from 2026 to 2033 due to increasing focus on public health, safety, and regulatory mandates for safe drinking water. Sensors in drinking water systems provide real-time monitoring of chemical and microbial parameters, ensuring quality standards and reducing contamination risks.
North America Water Detection Sensors Market Regional Analysis
• The U.S. dominated the water detection sensors market with the largest revenue share in 2025, driven by high adoption in commercial, industrial, and residential facilities and a strong focus on water conservation and damage prevention.
• Operators highly value real-time monitoring, predictive maintenance, and integration with smart building platforms.
• Widespread adoption is further supported by advanced sensor technologies, regulatory requirements, and rising infrastructure investments, establishing water detection sensors as critical for operational efficiency.
Canada Water Detection Sensors Market Insight
The Canada water detection sensors market is expected to witness the fastest growth rate from 2026 to 2033, fueled by increasing industrialization, adoption of smart buildings, and demand for early leak detection. Facilities are deploying IoT-enabled sensors for operational efficiency, water loss prevention, and regulatory compliance. Technological advancements and integration with real-time monitoring systems further support market expansion.
North America Water Detection Sensors Market Share
The North America water detection sensors industry is primarily led by well-established companies, including:
- Honeywell International Inc. (U.S.)
- Xylem Inc. (U.S.)
- Badger Meter, Inc. (U.S.)
- Emerson Electric Co. (U.S.)
- A. O. Smith Corporation (U.S.)
- Sensaphone, Inc. (U.S.)
- Teledyne Technologies Inc. (U.S.)
- Hach Company (U.S.)
- Danaher Corporation (U.S.)
- ABB Inc. (U.S.)
SKU-

- Interactive Data Analysis Dashboard
- Company Analysis Dashboard for high growth potential opportunities
- Research Analyst Access for customization & queries
- Competitor Analysis with Interactive dashboard
- Latest News, Updates & Trend analysis
- Harness the Power of Benchmark Analysis for Comprehensive Competitor Tracking
North America Water Detection Sensors Market, Supply Chain Analysis and Ecosystem Framework
To support market growth and help clients navigate the impact of geopolitical shifts, DBMR has integrated in-depth supply chain analysis into its North America Water Detection Sensors Market research reports. This addition empowers clients to respond effectively to global changes affecting their industries. The supply chain analysis section includes detailed insights such as North America Water Detection Sensors Market consumption and production by country, price trend analysis, the impact of tariffs and geopolitical developments, and import and export trends by country and HSN code. It also highlights major suppliers with data on production capacity and company profiles, as well as key importers and exporters. In addition to research, DBMR offers specialized supply chain consulting services backed by over a decade of experience, providing solutions like supplier discovery, supplier risk assessment, price trend analysis, impact evaluation of inflation and trade route changes, and comprehensive market trend analysis.
Data collection and base year analysis are done using data collection modules with large sample sizes. The stage includes obtaining market information or related data through various sources and strategies. It includes examining and planning all the data acquired from the past in advance. It likewise envelops the examination of information inconsistencies seen across different information sources. The market data is analysed and estimated using market statistical and coherent models. Also, market share analysis and key trend analysis are the major success factors in the market report. To know more, please request an analyst call or drop down your inquiry.
The key research methodology used by DBMR research team is data triangulation which involves data mining, analysis of the impact of data variables on the market and primary (industry expert) validation. Data models include Vendor Positioning Grid, Market Time Line Analysis, Market Overview and Guide, Company Positioning Grid, Patent Analysis, Pricing Analysis, Company Market Share Analysis, Standards of Measurement, Global versus Regional and Vendor Share Analysis. To know more about the research methodology, drop in an inquiry to speak to our industry experts.
Data Bridge Market Research is a leader in advanced formative research. We take pride in servicing our existing and new customers with data and analysis that match and suits their goal. The report can be customized to include price trend analysis of target brands understanding the market for additional countries (ask for the list of countries), clinical trial results data, literature review, refurbished market and product base analysis. Market analysis of target competitors can be analyzed from technology-based analysis to market portfolio strategies. We can add as many competitors that you require data about in the format and data style you are looking for. Our team of analysts can also provide you data in crude raw excel files pivot tables (Fact book) or can assist you in creating presentations from the data sets available in the report.


