
Saudi Arabia And Egypt Float Glass Market
Market Size in USD Million
 USD
608.40 Million
USD
815.45 Million
2025
2033
USD
608.40 Million
USD
815.45 Million
2025
2033
| 2026 - 2033 | |
| USD 608.40 Million | |
| USD 815.45 Million | |
| % | |
|
Saudi Arabia and Egypt Float Glass Market Size
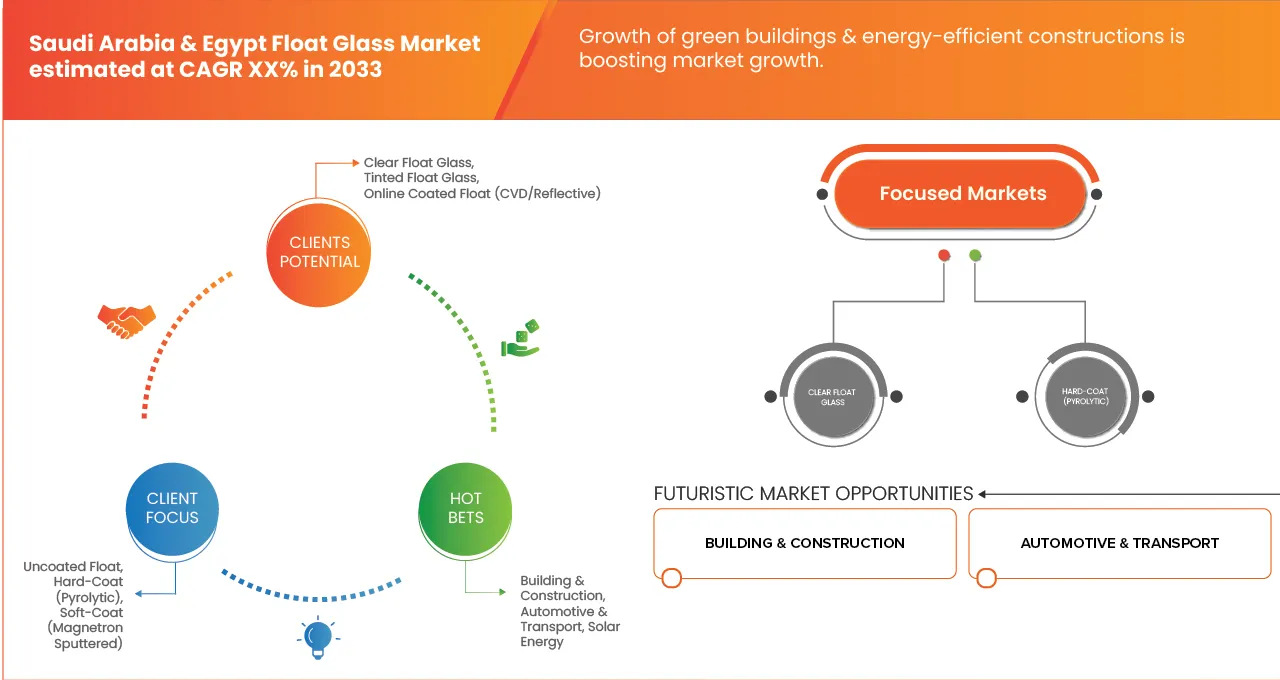
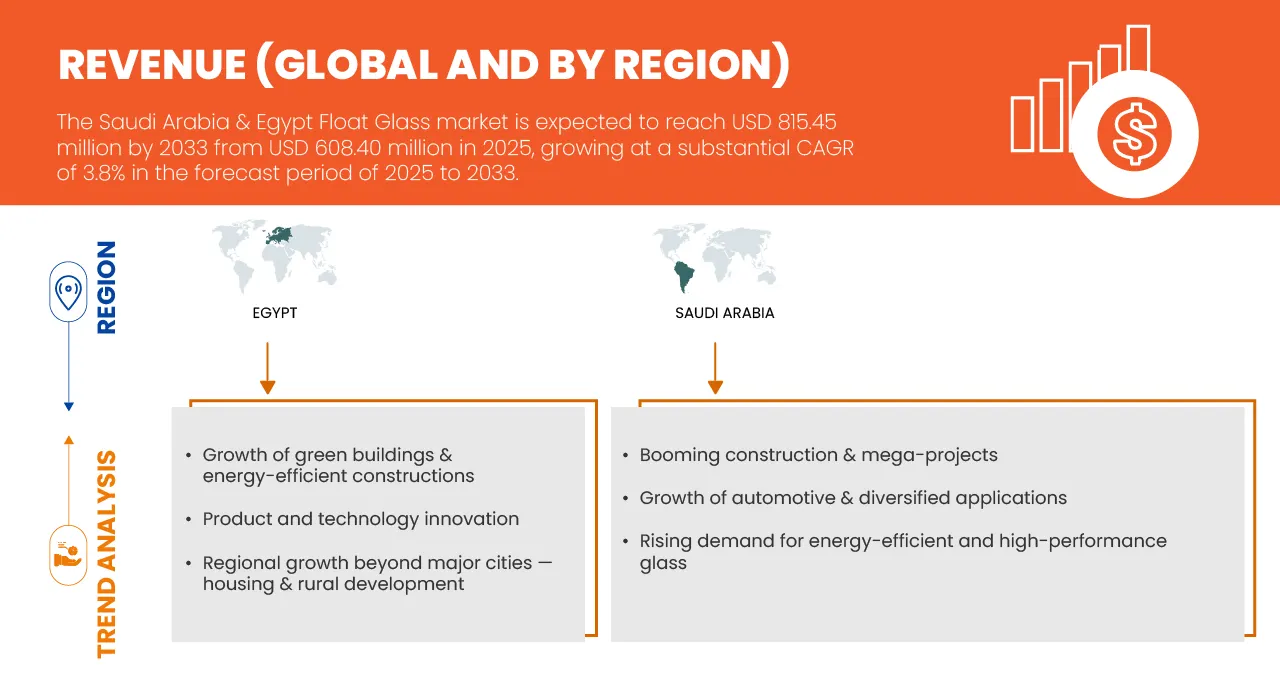
- The Saudi Arabia and Egypt Float Glass Market size was valued at USD 608.40 Million in 2025 and is expected to reach USD 815.45 Million by 2033, at a CAGR of 3.8% during the forecast period
- The Saudi Arabia and Egypt Float Glass Market in Saudi Arabia and Egypt is rapidly evolving due to strong construction growth, industrial expansion, and rising demand for high-performance glazing materials. Both countries have become important float glass producers in the MENA region, supported by abundant raw materials, expanding infrastructure projects, and government initiatives aimed at boosting local manufacturing capabilities. Float glass is essential for architectural façades, windows, skylights, solar panels, and automotive applications, making it a critical material for national development programs.
- In Saudi Arabia, demand is driven by the Vision 2030 megaprojects such as NEOM, The Line, Red Sea projects, Qiddiya, and large-scale residential and commercial developments. These projects require advanced glazing products including low-E glass, reflective glass, solar-control glass, and tempered and laminated architectural glass. The country is also investing heavily in renewable energy, increasing demand for low-iron solar glass used in photovoltaic modules. Strong government support, energy availability, and industrial diversification policies are further encouraging float glass capacity expansion and modernization
- Egypt has built a strong position as one of Africa’s leading float glass producers and a key exporter to the Middle East, Europe, and Africa. Its strategic location near the Suez Canal, competitive production costs, and growing domestic construction sector have strengthened its market presence. The New Administrative Capital, national housing programs, tourism infrastructure, and industrial parks continue to drive demand for clear and coated float glass. Export competitiveness is supported by developed manufacturing clusters and improving logistics networks.
Saudi Arabia and Egypt Float Glass Market Analysis
- The Saudi Arabia and Egypt Float Glass Markets are witnessing steady expansion, driven by strong construction activity, rising urbanization, and growing investments in industrial and infrastructure projects. In Saudi Arabia, Vision 2030 continues to boost demand for high-quality architectural glass across residential, commercial, and smart-city developments, including NEOM, the Red Sea Project, and Qiddiya. The country’s shift toward localized manufacturing, energy-efficient buildings, and renewable energy has further strengthened consumption of value-added float glass products such as tempered, laminated, coated, and solar-control glass.
- Egypt, on the other hand, is emerging as a competitive production hub supported by the government’s industrialization policies, availability of raw materials, export incentives, and the expanding real estate pipeline. Projects such as the New Administrative Capital and large-scale housing programs are increasing internal demand, while Egypt’s strategic location enables high export potential to Africa, Southern Europe, and the Middle East.
- Both countries benefit from growing automotive production, renewable energy installations, and government-backed initiatives promoting domestic manufacturing. However, the market faces challenges including energy price fluctuations, competition from low-cost imports, and geopolitical uncertainties affecting trade flows. Overall, the combined Saudi Arabia and Egypt Float Glass Market in Saudi Arabia and Egypt is positioned for healthy long-term growth, supported by construction momentum, diversification agendas, and increased investments in modern glass manufacturing capabilities.
- Saudi Arabia’s Saudi Arabia and Egypt Float Glass Market is expected to grow at a CAGR of 3.9%, driven by its significantly larger production capacity, strong industrial base, and substantial investments in construction and mega-projects compared to Egypt. Vision 2030 initiatives, rapid urban development, and expanding automotive and architectural sectors continue to generate high, sustained demand for float glass. Moreover, the Kingdom’s abundant raw materials, advanced manufacturing facilities, and supportive government policies enhance its competitiveness, solidifying Saudi Arabia as the dominant player in the regional Saudi Arabia and Egypt Float Glass Market.
- Clear float glass dominates the product type segment with a 41.57% market share because it provides high transparency, versatility, and cost-effectiveness for broad use across construction and automotive applications. Its wide availability and suitability for further processing—such as tempering, laminating, or coating—make it the preferred option for manufacturers and end-users alike.
Report Scope and Saudi Arabia and Egypt Float Glass Market Segmentation
|
Attributes |
Saudi Arabia and Egypt Float Glass Key Market Insights |
|
Segments Covered |
|
|
Countries Covered |
Egypt Saudi Arabia |
|
Key Market Players |
|
|
Market Opportunities |
|
|
Value Added Data Infosets |
In addition to the insights on market scenarios such as market value, growth rate, segmentation, geographical coverage, and major players, the market reports curated by the Data Bridge Market Research also include import export analysis, production capacity overview, production consumption analysis, price trend analysis, climate change scenario, supply chain analysis, value chain analysis, raw material/consumables overview, vendor selection criteria, PESTLE Analysis, Porter Analysis, and regulatory framework. |
Saudi Arabia and Egypt Float Glass Market Trends
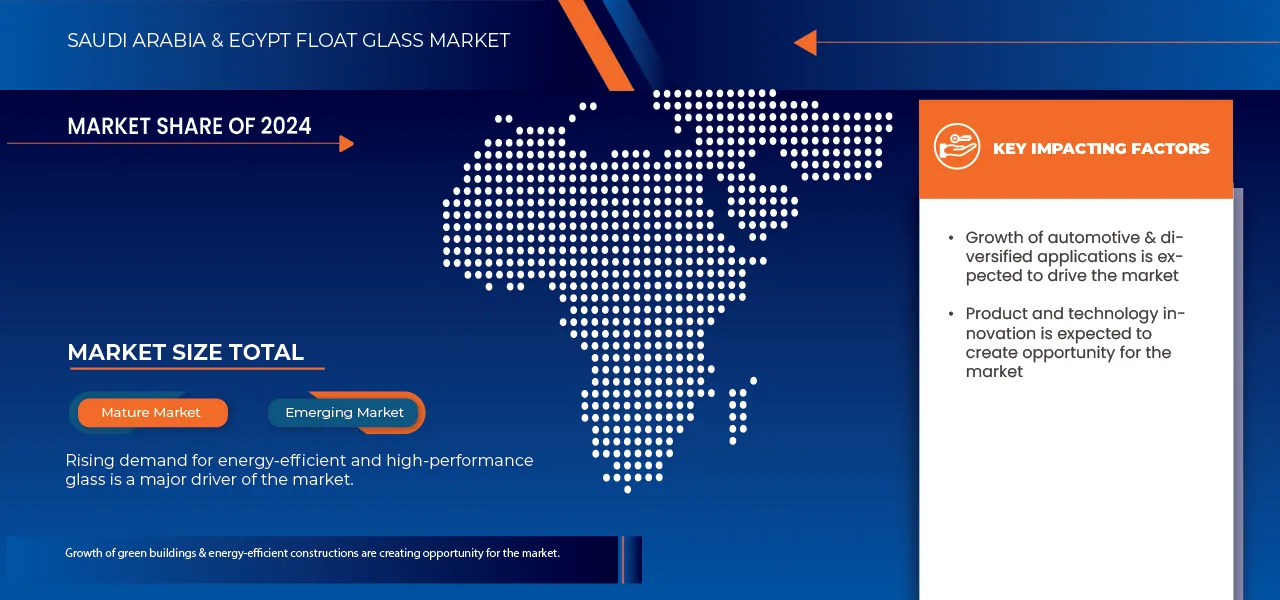
“Growth of automotive & diversified applications”
- Saudi Arabia’s industrial diversification under Vision 2030—especially the development of a domestic automotive manufacturing ecosystem—has significantly increased demand for float glass beyond its traditional construction uses. As the Kingdom expands local vehicle and EV production, the need for laminated, tempered, and safety glass for windshields, windows, and sunroofs continues to grow.
- Government incentives, foreign-investment partnerships, and dedicated vehicle-assembly zones have strengthened local automotive output. Rising vehicle ownership, fleet modernization, and expanded transport networks have also increased aftermarket demand for replacement windshields and safety glass, ensuring steady year-round consumption of float glass.
- In addition to automotive growth, the Kingdom is broadening the use of float glass across décor, furniture, smart-glass systems, and mobility infrastructure. This diversification is prompting manufacturers to invest in advanced lamination, tempering, and precision-cutting technologies, which enhances capacity utilization and improves industry competitiveness.
- Recent developments—such as plans to scale production to 400,000 vehicles by 2030, Stellantis–Petromin manufacturing initiatives, rising aftermarket demand, and the PIF–Hyundai plant in KAEC—underscore the strengthening ecosystem. Together, these factors position float-glass producers for long-term stability by expanding demand, advancing processing capabilities, and reducing reliance on any single sector.
Saudi Arabia and Egypt Float Glass Market Dynamics
Driver
“Rising demand for mdi-based polyurethanes in construction, automotive, and appliances”
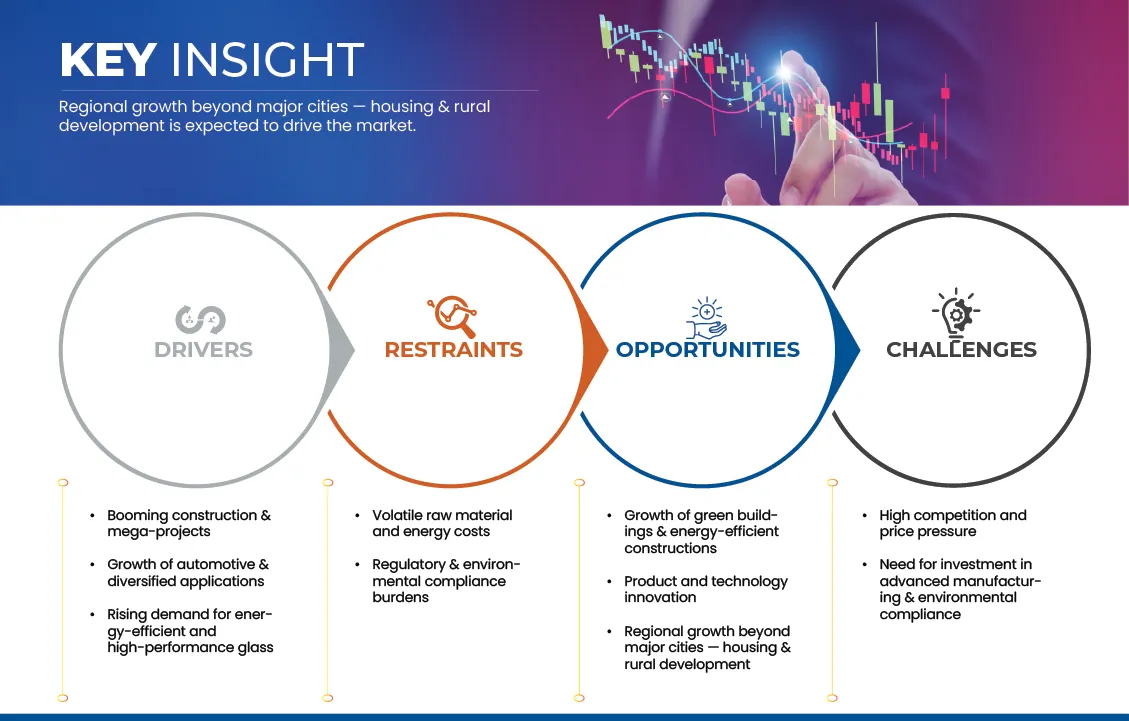
- Saudi Arabia’s construction sector is experiencing transformative growth, fueled by a surge of mega-projects and urban development initiatives under Vision 2030. Landmark developments such as NEOM, The Line, Qiddiya, Red Sea Global, AMAALA, and Diriyah Gate, along with large-scale expansions in Riyadh and Jeddah, are driving continuous demand for float glass across façades, skylights, curtain walls, partitions, windows, and interior applications.
- The scale and ambition of these projects require advanced glass solutions that balance energy efficiency, solar control, aesthetic appeal, and structural strength. Consequently, demand is shifting from basic float glass to specialized products, including Low-E, reflective, laminated, insulated, and high-durability coated glass. Emphasis on smart cities, climate-responsive architecture, and low-carbon buildings has accelerated the adoption of innovative glass technologies, prompting local and regional producers to expand capacity and upgrade production lines.
- Population growth, rapid urban migration, and rising residential demand provide a stable baseline for construction activity across the kingdom. Government housing schemes, public-private partnerships, and large-scale residential master plans continue to generate demand for both standard and high-performance glass. The commercial real-estate sector—including offices, hotels, retail complexes, and mixed-use developments—also contributes significantly, as modern architecture increasingly prioritizes extensive glazing and advanced façade solutions.
- Reports from 2024–2025 highlight that NEOM and other giga-projects remain under active development, with multi-billion-dollar investments in housing, offices, retail, and hospitality driving large-scale demand for architectural glass. This construction boom, central to Saudi Arabia’s economic diversification, is creating sustained demand for high-quality, technologically advanced float glass. Combined with rapid urbanization and evolving architectural standards, it stands as one of the most influential and enduring drivers of growth in the kingdom’s float-glass market.
Restraint/Challenge
“Volatile raw material and energy costs”
- Volatility in raw material and energy prices poses a significant challenge for the growth and stability of Saudi Arabia’s Saudi Arabia and Egypt Float Glass Market. Key inputs such as silica sand, soda ash, limestone, and dolomite—essential for glass production—are highly sensitive to price fluctuations. Many high-purity raw materials are imported, exposing manufacturers to international market trends, currency shifts, and variable freight rates, which can compress margins and disrupt production planning.
- Energy costs represent another critical factor, as float glass production requires continuous operation of high-temperature melting furnaces, accounting for a major portion of production expenses. While Saudi Arabia historically benefited from stable fuel prices, recent increases in domestic energy tariffs, global oil and gas market fluctuations, and stricter fuel-efficiency regulations have heightened operational cost unpredictability. Manufacturers must either absorb these costs or pass them on to customers, impacting pricing in construction and automotive sectors.
- Global shipping disruptions and commodity-market volatility—driven by geopolitical tensions, supply-chain issues, and fluctuating international demand—have further complicated raw-material procurement. For capital-intensive float glass operations with strict production schedules, such uncertainty increases inventory risks and complicates long-term investment decisions. The combined impact of raw-material dependency, energy variability, and external market pressures creates financial strain, especially for companies aiming to expand capacity or develop value-added products.
- Recent reports illustrate these challenges: rising industrial energy tariffs in December 2025 increased operating costs for energy-intensive sectors; October 2025 saw significant soda ash price volatility due to supply shortages and export cost increases; and February 2024 Red Sea shipping disruptions drove up freight rates for imported raw materials. These cost fluctuations reduce profitability, limit production flexibility, and elevate financial risks, making effective management of energy and raw-material expenses a persistent constraint on long-term competitiveness in Saudi Arabia’s Saudi Arabia and Egypt Float Glass Market.
Saudi Arabia and Egypt Float Glass Market Scope
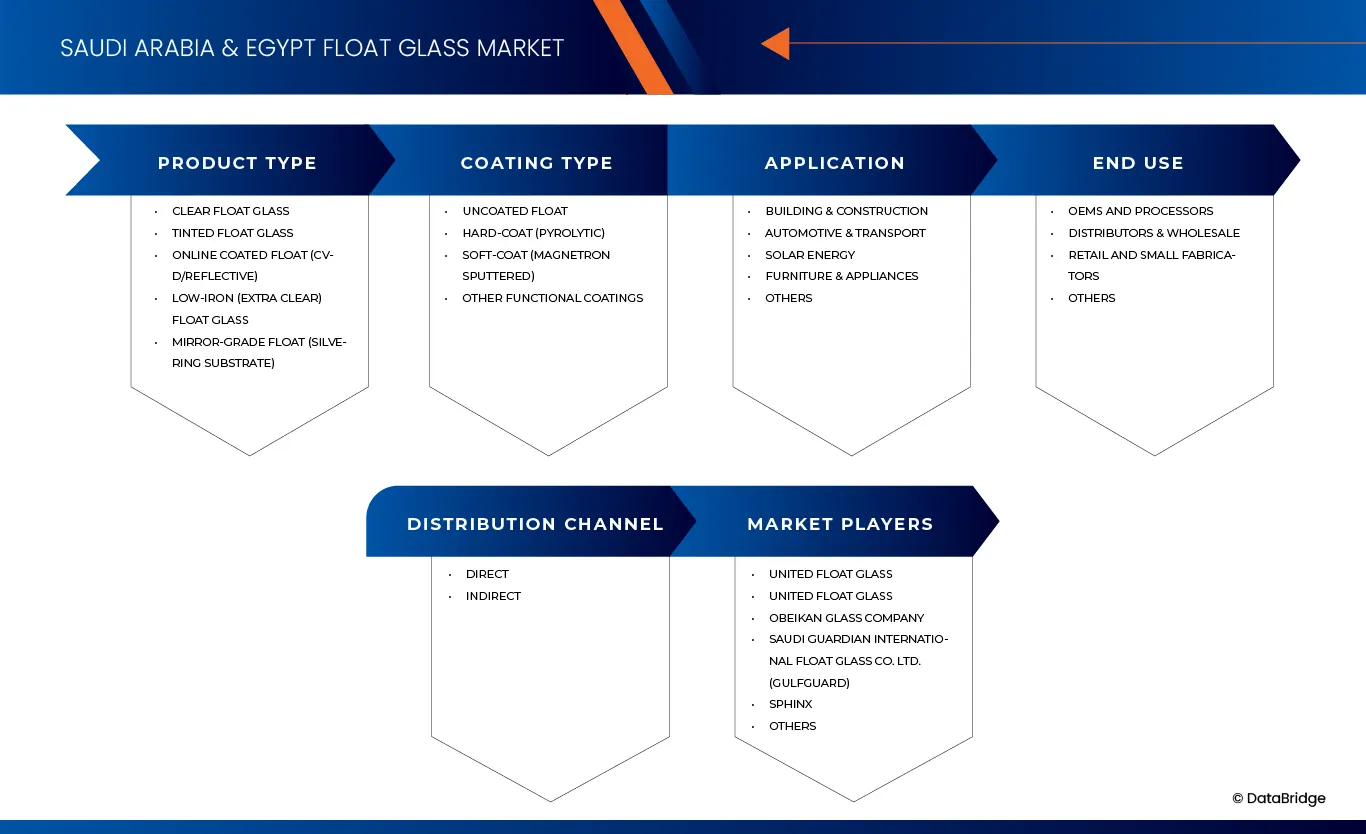
The Saudi Arabia and Egypt Float Glass Market is segmented into Five notable segments which are based on product type, coting type, application, end use, distribution channel
- By Product Type
On the basis of product type, the market is segmented into Clear Float Glass, Tinted Float Glass, Low-Iron (Extra Clear) Float Glass, Mirror-Grade Float (Silvering Substrate), Online Coated Float (Cvd/Reflective). In 2026, Clear Float Glass segment is expected to dominate the Saudi Arabia and Egypt Float Glass Market with 41.48% market share and is expected to reach USD 332.36 Million by 2033 growing with the highest CAGR of 3.5% in the forecast period of 2026 to 2033. This trend is attributed to the high demand for aesthetic and energy-efficient architectural applications. Moreover, its versatility in residential and commercial construction is driving sustained market growth.
- By Coating Type
On the basis of Coating Type, the market is segmented into Uncoated Float, Hard-Coat (Pyrolytic), Soft-Coat (Magnetron Sputtered), Other Functional Coatings. In 2026, Uncoated Float segment is expected to dominate the Saudi Arabia and Egypt Float Glass Market with 62.43% market share and is expected to reach USD 497.40 Million by 2033 growing with the highest CAGR of 3.5% in the forecast period of 2026 to 2033. This growth is driven by the segment’s cost-effectiveness and widespread application in standard construction projects. Additionally, its high availability and ease of installation continue to support strong market adoption.
- By Application
On the basis of application, the market is segmented into Building & Construction, Automotive & Transport, Solar Energy, Furniture & Appliances, Others. In 2026, Building & Construction segment is expected to dominate the Saudi Arabia and Egypt Float Glass Market with 76.13% market share and is expected to reach USD 618.50 Million by 2033 growing with the highest CAGR of 3.8% in the forecast period of 2026 to 2033. This growth is driven by rapid urbanization and increasing infrastructure projects in both countries. Additionally, rising demand for energy-efficient and durable construction materials is boosting float glass adoption.
- By End user
On the basis of end use, the market is segmented into OEMS And Processors, Distributors & Wholesale, Retail and Small Fabricators, Others. In 2026, OEMs and Processors segment is expected to dominate the Saudi Arabia and Egypt Float Glass Market with 49.35% market share and is expected to reach USD 409.10 Million by 2033 growing with the highest CAGR of 4.0% in the forecast period of 2026 to 2033. This dominance is driven by the increasing demand from automotive and industrial sectors for customized glass solutions. Additionally, strong collaborations between manufacturers and processors are enhancing supply chain efficiency and market growth.
- By Distribution channel
On the basis of distribution Channel, the market is segmented into direct, indirect. In 2026, Direct segment is expected to dominate the Saudi Arabia and Egypt Float Glass Market with 66.43% market share and is expected to reach USD 546.33 Million by 2033 growing with the highest CAGR of 3.9% in the forecast period of 2026 to 2033. This growth is fueled by manufacturers’ preference for direct sales to reduce costs and improve distribution efficiency. Additionally, stronger customer relationships and streamlined supply chains are driving higher adoption in the region.
Saudi Arabia and Egypt Float Glass Market Regional Analysis
- Saudi Arabia dominates the Saudi Arabia and Egypt Float Glass Market, accounting for 74.22% of the total share in 2026, supported by robust construction activities and large-scale infrastructure projects across the country. Additionally, increasing urbanization and investments in residential and commercial developments are boosting market demand. The region also demonstrates the strongest CAGR of 3.9% , indicating strong and sustained market growth driven by rising demand for modern construction materials and expanding industrial applications. This reflects increasing investments in infrastructure and urban development across the region.
- Furthermore, government initiatives promoting smart cities and energy-efficient buildings are expected to further accelerate float glass demand. Coupled with advancements in glass manufacturing technology, the market is poised for steady expansion over the forecast period.
Saudi Arabia and Egypt Float Glass Market Insight
The Saudi Arabia and Egypt Float Glass Market is set for robust growth, driven by a booming construction sector and rising demand for high-quality building materials. Strengthening standards and regulations are further boosting the need for superior glass products, while expanding export opportunities in regional and global markets continue to support market expansion.
Saudi Arabia and Egypt Float Glass Market Share
The Float Glass industry is primarily led by well-established companies, including:
- Mohammed Mannaa Glass Corporation (Saudi Arabia)
- China Glass Holdings Limited (China)
- Egyptian Glass Company (Egypt)
- Dr. Greiche Glass (Egypt)
- Guardian Industries Holdings (U.S.)
- Arab Union Glass Co., Ltd (Egypt)
- Saint-Gobain Glass Egypt (Egypt)
- Obeikan Glass Company (Saudi Arabia)
- AL Andalus Glass (Saudi Arabia)
- United Float Glass (Saudi Arabia)
- Xinyi Glass Holdings Limited (China)
- Düzce Cam Sanayi ve Tic. A.Ş. (Turkey)
- Şişecam (Turkey)
- Sphinx (Egypt)
- Al-Shams Architectural Glass (Bangladesh)
Latest Developments in Saudi Arabia and Egypt Float Glass Market
- In November 2024, Guardian Glass launched CLARIA, a global AI-powered assistant on its website designed to help customers navigate technical aspects of glass, recommend glazing solutions, identify local suppliers, and access relevant resources. CLARIA supports conversational, context-aware interactions in all supported languages, enabling users to quickly resolve complex questions, explore technical topics, and receive tailored guidance, marking a major step in Guardian Glass’s digital engagement and customer support strategy.
- In September 2022, Guardian Glass introduced Guardian Clarity™ Neutral, an advanced anti-reflective coated glass designed for architectural and special-purpose applications. With a reflectivity of just 0.6%, it offers the highest transparency of any Guardian product, reducing glare, bluish reflections, haze, and color shift, even in low or diffused light. Suitable for use on Guardian ExtraClear or UltraClear float glass, in thicknesses from 3 mm to 15 mm and jumbo sizes up to 6,000 mm × 3,210 mm, it can be annealed or heat-treated for safety, security, or acoustic applications, delivering virtually uninterrupted, crystal-clear views.
- In December 2023, Sphinx Glass signed an exclusive distribution agreement with Diamon‑Fusion International (DFI) to bring Diamon‑Fusion® glass‑coating technology to Egypt and the Mediterranean North‑African region, enabling coated glass surfaces with improved hygiene, water‑repellent and anti‑stain properties.
SKU-

- Interactive Data Analysis Dashboard
- Company Analysis Dashboard for high growth potential opportunities
- Research Analyst Access for customization & queries
- Competitor Analysis with Interactive dashboard
- Latest News, Updates & Trend analysis
- Harness the Power of Benchmark Analysis for Comprehensive Competitor Tracking
Table of Content
1 INTRODUCTION
1.1 OBJECTIVES OF THE STUDY
1.2 MARKET DEFINITION
1.3 OVERVIEW OF SAUDI ARABIA & EGYPT FLOAT GLASS MARKET
1.4 CURRENCY AND PRICING
1.5 LIMITATIONS
1.6 MARKETS COVERED
2 MARKET SEGMENTATION
2.1 MARKETS COVERED
2.2 GEOGRAPHICAL SCOPE
2.3 YEARS CONSIDERED FOR THE STUDY
2.4 DBMR TRIPOD DATA VALIDATION MODEL
2.5 PRIMARY INTERVIEWS WITH KEY OPINION LEADERS
2.6 DBMR MARKET POSITION GRID
2.7 VENDOR SHARE ANALYSIS
2.8 VENDOR SHARE ANALYSIS
2.9 MULTIVARIATE MODELING
2.1 PRODUCT TYPE TIMELINE CURVE
2.11 MARKET APPLICATION COVERAGE GRID
2.12 SECONDARY SOURCES
2.13 ASSUMPTIONS
3 EXECUTIVE SUMMARY
4 PREMIUM INSIGHTS
4.1 PORTER’S FIVE FORCES
4.1.1 THREAT OF NEW ENTRANTS
4.1.2 BARGAINING POWER OF SUPPLIERS
4.1.3 BARGAINING POWER OF BUYERS
4.2 THREAT OF SUBSTITUTE PRODUCTS
4.2.1 INDUSTRY RIVALRY
4.2.2 CONCLUSION
4.3 BRAND OUTLOOK
4.3.1 PRODUCT COMPARISON
4.3.2 BRAND DEVELOPMENT ACROSS APPLICATION
4.4 VALUE CHAIN ANALYSIS
4.4.1 RAW MATERIAL PROCUREMENT
4.4.2 GLASS MELTING AND FLOATING
4.4.3 GLASS PROCESSING AND FINISHING
4.4.4 DISTRIBUTION AND LOGISTICS
4.4.5 END-USE MANUFACTURING AND INSTALLATION
4.4.6 RETAIL AND DISTRIBUTION TO CONSUMERS
4.4.7 CONCLUSION
4.5 CONSUMER BUYING BEHAVIOUR
4.5.1 GROUP 1 PREMIUM CHEMICAL PRODUCERS
4.5.2 GROUP 2 PRICE-SENSITIVE MID-SIZED FORMULATORS
4.5.3 GROUP 3 INDUSTRIAL USERS WITH LOGISTICS FOCUS
4.5.4 GROUP 4 COST-FOCUSED SMALL PROCESSORS / TRADERS
4.5.5 GROUP 5 SPECIALTY APPLICATION MANUFACTURERS
4.5.6 GROUP 6 EMERGING MARKET LARGE BUYERS
4.6 RAW MATERIAL COVERAGE
4.6.1 SILICA SAND
4.6.2 SODA ASH
4.6.3 LIMESTONE AND DOLOMITE
4.6.4 CULLET (RECYCLED GLASS)
4.6.5 CHEMICALS AND ADDITIVES
4.6.6 POLICY AND ENVIRONMENTAL FRAMEWORK
4.6.7 CONCLUSION
4.7 TECHNOLOGICAL ADVANCEMENTS – SAUDI ARABIA & EGYPT FLOAT GLASS MARKET
4.7.1 SAUDI ARABIA – FLOAT GLASS TECHNOLOGICAL ADVANCEMENTS
4.7.2 EGYPT – FLOAT GLASS TECHNOLOGICAL ADVANCEMENTS
4.7.3 CONCLUSION
4.8 CHAPTER 1: INNOVATION TRACKER AND STRATEGIC ANALYSIS
4.8.1 MAJOR DEALS AND STRATEGIC ALLIANCES ANALYSIS
4.8.1.1 JOINT VENTURES
4.8.1.2 MERGERS AND ACQUISITIONS
4.8.1.3 LICENSING AND PARTNERSHIP
4.8.1.4 TECHNOLOGY COLLABORATIONS
4.8.1.5 STRATEGIC DIVESTMENTS
4.8.2 NUMBER OF PRODUCTS IN DEVELOPMENT
4.8.3 STAGE OF DEVELOPMENT
4.8.4 TIMELINES AND MILESTONES
4.8.5 INNOVATION STRATEGIES AND METHODOLOGIES
4.8.6 RISK ASSESSMENT AND MITIGATION
4.9 RAW MATERIAL AND ENERGY PRICE VOLATILITY
4.9.1 HIGH CAPITAL EXPENDITURE AND LONG RETURN ON INVESTMENT (ROI) PERIODS
4.9.2 REGULATORY AND ENVIRONMENTAL COMPLIANCE RISKS
4.9.3 TECHNICAL AND SKILLS GAP
4.9.4 MARKET AND DEMAND RISKS
4.9.5 LOGISTICS AND DISTRIBUTION CHALLENGES
4.9.6 CONCLUSION
4.1 FUTURE OUTLOOK
4.11 CHAPTER 2: TARIFFS & IMPACT ON THE MARKET
4.11.1 CURRENT TARIFF RATE (S) IN TOP-5 COUNTRY MARKETS
4.11.2 OUTLOOK: LOCAL PRODUCTION V/S IMPORT RELIANCE
4.11.3 VENDOR SELECTION CRITERIA DYNAMICS
4.11.4 IMPACT ON SUPPLY CHAIN
4.11.5 RAW MATERIAL PROCUREMENT
4.11.6 MANUFACTURING AND PRODUCTION
4.11.6.1 LOGISTICS AND DISTRIBUTION
4.11.6.2 PRICE PITCHING AND POSITION OF MARKET
4.11.7 INDUSTRY PARTICIPANTS: PROACTIVE MOVES
4.11.7.1 SUPPLY CHAIN OPTIMIZATION
4.11.7.2 JOINT VENTURE ESTABLISHMENTS
4.11.8 IMPACT ON PRICES
4.11.9 REGULATORY INCLINATION
4.11.9.1 GEOPOLITICAL SITUATION
4.11.9.2 TRADE PARTNERSHIPS BETWEEN THE COUNTRIES
4.11.9.2.1 FREE TRADE AGREEMENTS
4.11.9.2.2 ALLIANCES ESTABLISHMENTS
4.11.9.3 STATUS ACCREDITATION (INCLUDING MFTN)
4.11.9.4 DOMESTIC COURSE OF CORRECTION
4.11.9.4.1 INCENTIVE SCHEMES TO BOOST PRODUCTION OUTPUTS
4.11.9.4.2 ESTABLISHMENT OF SEZS/INDUSTRIAL PARKS
4.12 SUPPLY CHAIN ANALYSIS – SAUDI ARABIA & EGYPT FLOAT GLASS MARKET
4.12.1 OVERVIEW
4.12.2 LOGISTIC COST SCENARIO
4.12.2.1 INBOUND LOGISTICS FOR RAW MATERIALS
4.12.2.2 DOMESTIC DISTRIBUTION OF FLOAT GLASS SHEETS AND PROCESSED PRODUCTS
4.12.2.3 EXPORT LOGISTICS AND GLOBAL SHIPPING CONDITIONS
4.12.3 IMPORTANCE OF LOGISTIC SERVICE PROVIDERS
4.12.3.1 SPECIALIZED HANDLING AND DAMAGE PREVENTION
4.12.3.2 NETWORK DESIGN AND ROUTE OPTIMIZATION
4.12.3.3 CUSTOMS COMPLIANCE AND EXPORT FACILITATION
4.12.3.4 RESILIENCE AND RISK MANAGEMENT
4.12.3.5 ENHANCEMENT OF CUSTOMER SERVICE LEVELS
4.12.4 CONCLUSION
5 REGULATION COVERAGE – SAUDI ARABIA & EGYPT FLOAT GLASS MARKET
5.1 PRODUCT CODES
5.2 CERTIFIED STANDARDS
5.2.1 SAUDI ARABIA – SASO AND GSO/ISO
5.2.2 EGYPT – EOS AND MANDATORY DECREES
5.2.3 MULTI-STANDARD COMPLIANCE
5.3 SAFETY STANDARDS
5.3.1 MATERIAL HANDLING & STORAGE
5.3.2 TRANSPORT & PRECAUTIONS
5.3.3 HAZARD IDENTIFICATION
6 MARKET OVERVIEW OF EGYPT
6.1 DRIVERS
6.1.1 CONSTRUCTION / BUILDING BOOM & RISING DEMAND FOR QUALITY BUILDING MATERIALS
6.1.2 RISING STANDARDS AND REGULATIONS PUSHING DEMAND FOR “GOOD QUALITY GLASS
6.1.3 EXPORT DEMAND — REGIONAL AND GLOBAL MARKETS
6.1.4 PRODUCT DIVERSIFICATION & INNOVATION (COATED, TINTED, ARCHITECTURAL/AUTOMOTIVE GLASS)
6.2 RESTRAINT
6.2.1 CURRENCY VOLATILITY INCREASES RAW MATERIAL IMPORT COSTS
6.2.2 STRONG REGIONAL COMPETITION PRESSURES DOMESTIC PRICE MARGINS
6.3 OPPORTUNITES
6.3.1 GROWING DEMAND FOR ENERGY-EFFICIENT AND “GREEN BUILDING” GLASS PRODUCTS
6.3.2 EXPORT EXPANSION TO UNDERSERVED REGIONAL MARKETS (MENA, AFRICA, GLOBAL)
6.3.3 FURTHER CAPACITY EXPANSION & MODERNIZATION CAN MEET GROWING GLOBAL QUALITY AND VOLUME DEMAND
6.4 CHALLENGES
6.4.1 OVERCAPACITY RISK FROM MULTIPLE NEW FLOAT LINES
6.4.2 DOMESTIC REGULATORY REQUIREMENTS INCREASE QUALITY-COMPLIANCE BURDENS FOR FLOAT-GLASS PRODUCERS
7 MARKET OVERVIEW OF SAUDI ARABIA
7.1 DRIVERS
7.1.1 BOOMING CONSTRUCTION & MEGA-PROJECTS FUEL SUSTAINED DEMAND FOR FLOAT GLASS IN SAUDI ARABIA
7.1.2 GROWTH OF AUTOMOTIVE & DIVERSIFIED APPLICATIONS
7.1.3 RISING DEMAND FOR ENERGY-EFFICIENT AND HIGH-PERFORMANCE GLASS IN SAUDI ARABIA
7.2 RESTRAINTS
7.2.1 VOLATILE RAW MATERIAL AND ENERGY COSTS
7.2.2 REGULATORY & ENVIRONMENTAL COMPLIANCE BURDENS
7.3 OPPORTUNITIES
7.3.1 GROWTH OF GREEN BUILDINGS & ENERGY-EFFICIENT CONSTRUCTIONS
7.3.2 PRODUCT AND TECHNOLOGY INNOVATION
7.3.3 REGIONAL GROWTH BEYOND MAJOR CITIES IN HOUSING AND RURAL DEVELOPMENT
7.4 CHALLENGES
7.4.1 HIGH COMPETITION AND PRICE PRESSURE
7.4.2 NEED FOR INVESTMENT IN ADVANCED MANUFACTURING & ENVIRONMENTAL COMPLIANCE
8 SAUDI ARABIA & EGYPT FLOAT GLASS MARKET, BY PRODUCT TYPE.
8.1 OVERVIEW
8.2 SAUDI ARABIA & EGYPT FLOAT GLASS MARKET, 2018-2033 (USD THOUSAND)
8.2.1 SAUDI ARABIA
8.2.2 EGYPT
8.3 SAUDI ARABIA & EGYPT FLOAT GLASS MARKET, BY PRODUCT TYPE, 2018-2033 (USD THOUSAND)
8.3.1 CLEAR FLOAT GLASS
8.3.2 TINTED FLOAT GLASS
8.3.3 ONLINE COATED FLOAT (CVD/REFLECTIVE)
8.3.4 LOW-IRON (EXTRA CLEAR) FLOAT GLASS
8.3.5 MIRROR-GRADE FLOAT (SILVERING SUBSTRATE)
8.4 SAUDI ARABIA & EGYPT CLEAR FLOAT GLASS IN FLOAT GLASS MARKET, BY THICKNESS, 2018-2033 (USD THOUSAND)
8.4.1 4–6 MM
8.4.2 8–12 MM
8.4.3 2–3 MM
8.4.4 ABOVE 12 MM
8.5 SAUDI ARABIA & EGYPT CLEAR FLOAT GLASS IN FLOAT GLASS MARKET, BY COATING, 2018-2033 (USD THOUSAND)
8.5.1 UNCOATED
8.5.2 HARD-COAT (PYROLYTIC)
8.5.3 SOFT-COAT (MAGNETRON)
8.6 SAUDI ARABIA & EGYPT CLEAR FLOAT GLASS IN FLOAT GLASS MARKET, BY STATE, 2018-2033 (USD THOUSAND)
8.6.1 SAUDI ARABIA
8.6.2 EGYPT
8.7 SAUDI ARABIA & EGYPT TINTED FLOAT GLASS IN FLOAT GLASS MARKET, BY COLOR, 2018-2033 (USD THOUSAND)
8.7.1 GREY
8.7.2 BRONZE
8.7.3 GREEN
8.7.4 BLUE
8.8 SAUDI ARABIA & EGYPT TINTED FLOAT GLASS IN FLOAT GLASS MARKET, BY THICKNESS, 2018-2033 (USD THOUSAND)
8.8.1 4–6 MM
8.8.2 8–12 MM
8.8.3 ABOVE 12 MM
8.9 SAUDI ARABIA & EGYPT TINTED FLOAT GLASS IN FLOAT GLASS MARKET, BY COATING, 2018-2033 (USD THOUSAND)
8.9.1 UNCOATED
8.9.2 SOLAR CONTROL LOW-E
8.1 SAUDI ARABIA & EGYPT TINTED FLOAT GLASS IN FLOAT GLASS MARKET, BY STATE, 2018-2033 (USD THOUSAND)
8.10.1 SAUDI ARABIA
8.10.2 EGYPT
8.11 SAUDI ARABIA & EGYPT ONLINE COATED FLOAT (CVD/REFLECTIVE) IN FLOAT GLASS MARKET, BY STATE, 2018-2033 (USD THOUSAND)
8.11.1 SAUDI ARABIA
8.11.2 EGYPT
8.12 SAUDI ARABIA & EGYPT LOW-IRON (EXTRA CLEAR) FLOAT GLASS IN FLOAT GLASS MARKET, BY THICKNESS, 2018-2033 (USD THOUSAND)
8.12.1 8–12 MM
8.12.2 4–6 MM
8.12.3 ABOVE 12 MM
8.13 SAUDI ARABIA & EGYPT LOW-IRON (EXTRA CLEAR) FLOAT GLASS IN FLOAT GLASS MARKET, BY COATING, 2018-2033 (USD THOUSAND)
8.13.1 UNCOATED
8.13.2 LOW-E AND ANTI-REFLECTIVE
8.14 SAUDI ARABIA & EGYPT LOW-IRON (EXTRA CLEAR) FLOAT GLASS IN FLOAT GLASS MARKET, BY STATE, 2018-2033 (USD THOUSAND)
8.14.1 SAUDI ARABIA
8.14.2 EGYPT
8.15 SAUDI ARABIA & EGYPT MIRROR-GRADE FLOAT (SILVERING SUBSTRATE) IN FLOAT GLASS MARKET, BY STATE, 2018-2033 (USD THOUSAND)
8.15.1 SAUDI ARABIA
8.15.2 EGYPT
9 SAUDI ARABIA & EGYPT FLOAT GLASS MARKET, BY COATING TYPE
9.1 OVERVIEW
9.2 SAUDI ARABIA & EGYPT FLOAT GLASS MARKET, BY COATING TYPE, 2018-2033 (USD THOUSAND)
9.2.1 UNCOATED FLOAT
9.2.2 HARD-COAT (PYROLYTIC)
9.2.3 SOFT-COAT (MAGNETRON SPUTTERED)
9.2.4 OTHER FUNCTIONAL COATINGS
9.2.5 SAUDI ARABIA & EGYPT UNCOATED FLOAT IN FLOAT GLASS MARKET, BY STATE, 2018-2033 (USD THOUSAND)
9.2.6 SAUDI ARABIA
9.2.7 EGYPT
9.3 SAUDI ARABIA & EGYPT HARD-COAT (PYROLYTIC) IN FLOAT GLASS MARKET, BY STATE, 2018-2033 (USD THOUSAND)
9.3.1 SAUDI ARABIA
9.3.2 EGYPT
9.4 SAUDI ARABIA & EGYPT SOFT-COAT (MAGNETRON SPUTTERED) IN FLOAT GLASS MARKET, BY STATE, 2018-2033 (USD THOUSAND)
9.4.1 SAUDI ARABIA
9.4.2 EGYPT
9.5 SAUDI ARABIA & EGYPT OTHER FUNCTIONAL COATINGS IN FLOAT GLASS MARKET, BY STATE, 2018-2033 (USD THOUSAND)
9.5.1 SAUDI ARABIA
9.5.2 EGYPT
10 SAUDI ARABIA & EGYPT FLOAT GLASS MARKET, BY APPLICATION
10.1 OVERVIEW
10.2 SAUDI ARABIA & EGYPT FLOAT GLASS MARKET, BY APPLICATION, 2018-2033 (USD THOUSAND)
10.2.1 BUILDING & CONSTRUCTION
10.2.2 AUTOMOTIVE & TRANSPORT
10.2.3 SOLAR ENERGY
10.2.4 FURNITURE & APPLIANCES
10.2.5 OTHERS
10.3 SAUDI ARABIA & EGYPT BUILDING & CONSTRUCTION IN FLOAT GLASS MARKET, BY TYPE, 2018-2033 (USD THOUSAND)
10.3.1 EXTERIOR GLAZING
10.3.2 INTERIOR
10.4 SAUDI ARABIA & EGYPT EXTERIOR GLAZING IN FLOAT GLASS MARKET, BY TYPE, 2018-2033 (USD THOUSAND)
10.4.1 CURTAIN WALLS & FACADES
10.4.2 WINDOWS & FENESTRATION
10.4.3 SKYLIGHTS
10.5 SAUDI ARABIA & EGYPT INTERIOR IN FLOAT GLASS MARKET, BY TYPE, 2018-2033 (USD THOUSAND)
10.5.1 PARTITIONS & BALUSTRADES
10.5.2 MIRRORS
10.6 SAUDI ARABIA & EGYPT BUILDING & CONSTRUCTION IN FLOAT GLASS MARKET, BY STATE, 2018-2033 (USD THOUSAND)
10.6.1 SAUDI ARABIA
10.6.2 EGYPT
10.7 SAUDI ARABIA & EGYPT AUTOMOTIVE & TRANSPORT IN FLOAT GLASS MARKET, BY TYPE, 2018-2033 (USD THOUSAND)
10.7.1 WINDSCREENS (LAMINATED)
10.7.2 SIDE & BACKLITES (TEMPERED)
10.7.3 SUNROOFS
10.8 SAUDI ARABIA & EGYPT AUTOMOTIVE & TRANSPORT IN FLOAT GLASS MARKET, BY STATE, 2018-2033 (USD THOUSAND)
10.8.1 SAUDI ARABIA
10.8.2 EGYPT
10.9 SAUDI ARABIA & EGYPT SOLAR ENERGY IN FLOAT GLASS MARKET, BY TYPE, 2018-2033 (USD THOUSAND)
10.9.1 SOLAR PV MODULE GLASS
10.9.2 SOLAR THERMAL COLLECTOR GLASS
10.1 SAUDI ARABIA & EGYPT SOLAR ENERGY IN FLOAT GLASS MARKET, BY STATE, 2018-2033 (USD THOUSAND)
10.10.1 SAUDI ARABIA
10.10.2 EGYPT
10.11 SAUDI ARABIA & EGYPT FURNITURE & APPLIANCES IN FLOAT GLASS MARKET, BY TYPE, 2018-2033 (USD THOUSAND)
10.11.1 FURNITURE GLASS
10.11.2 HOME APPLIANCE GLASS
10.12 SAUDI ARABIA & EGYPT FURNITURE & APPLIANCES IN FLOAT GLASS MARKET, BY STATE, 2018-2033 (USD THOUSAND)
10.12.1 SAUDI ARABIA
10.12.2 EGYPT
10.13 SAUDI ARABIA & EGYPT OTHERS IN FLOAT GLASS MARKET, BY STATE, 2018-2033 (USD THOUSAND)
10.13.1 SAUDI ARABIA
10.13.2 EGYPT
11 SAUDI ARABIA & EGYPT FLOAT GLASS MARKET, BY END USE.
11.1 OVERVIEW
11.2 SAUDI ARABIA & EGYPT FLOAT GLASS MARKET, BY END USE, 2018-2033 (USD THOUSAND)
11.2.1 OEMS AND PROCESSORS
11.2.2 DISTRIBUTORS & WHOLESALE
11.2.3 RETAIL AND SMALL FABRICATORS
11.2.4 OTHERS
11.3 SAUDI ARABIA & EGYPT OEMS AND PROCESSORS IN FLOAT GLASS MARKET, BY TYPE, 2018-2033 (USD THOUSAND)
11.3.1 ARCHITECTURAL PROCESSORS
11.3.2 AUTOMOTIVE GLASS FABRICATORS
11.4 SAUDI ARABIA & EGYPT OEMS AND PROCESSORS IN FLOAT GLASS MARKET, BY STATE, 2018-2033 (USD THOUSAND)
11.4.1 SAUDI ARABIA
11.4.2 EGYPT
11.5 SAUDI ARABIA & EGYPT DISTRIBUTORS & WHOLESALE IN FLOAT GLASS MARKET, BY STATE, 2018-2033 (USD THOUSAND)
11.5.1 SAUDI ARABIA
11.5.2 EGYPT
11.6 SAUDI ARABIA & EGYPT RETAIL AND SMALL FABRICATORS IN FLOAT GLASS MARKET, BY STATE, 2018-2033 (USD THOUSAND)
11.6.1 SAUDI ARABIA
11.6.2 EGYPT
11.7 SAUDI ARABIA & EGYPT OTHERS IN FLOAT GLASS MARKET, BY STATE, 2018-2033 (USD THOUSAND)
11.7.1 SAUDI ARABIA
11.7.2 EGYPT
12 SAUDI ARABIA & EGYPT FLOAT GLASS MARKET, BY DISTRIBUTION CHANNEL
12.1 OVERVIEW
12.2 SAUDI ARABIA & EGYPT FLOAT GLASS MARKET, BY DISTRIBUTION CHANNEL, 2018-2033 (USD THOUSAND)
12.2.1 DIRECT
12.2.2 INDIRECT
12.3 SAUDI ARABIA & EGYPT DIRECT IN FLOAT GLASS MARKET, BY TYPE, 2018-2033 (USD THOUSAND)
12.3.1 SALES DIRECTLY FROM MANUFACTURER TO CONSTRUCTION/COMMERCIAL PROJECT
12.3.2 MANUFACTURER TO OEM EQUIPMENT
12.3.3 MANUFACTURER TO LARGE REAL-ESTATE DEVELOPER
12.3.4 DIRECT E-COMMERCE
12.4 SAUDI ARABIA & EGYPT DIRECT IN FLOAT GLASS MARKET, BY STATE, 2018-2033 (USD THOUSAND)
12.4.1 SAUDI ARABIA
12.4.2 EGYPT
12.5 SAUDI ARABIA & EGYPT INDIRECT IN FLOAT GLASS MARKET, BY TYPE, 2018-2033 (USD THOUSAND)
12.5.1 DISTRIBUTOR/WHOLESALER SALES
12.5.2 GLASS & GLAZING FABRICATORS
12.5.3 BUILDING-MATERIAL RETAILERS
12.5.4 STOCKIST/WAREHOUSE CHANNEL
12.6 SAUDI ARABIA & EGYPT INDIRECT IN FLOAT GLASS MARKET, BY STATE, 2018-2033 (USD THOUSAND)
12.6.1 SAUDI ARABIA
12.6.2 EGYPT
13 SAUDI ARABIA & EGYPT FLOAT GLASS MARKET, COMPANY LANDSCAPE
13.1 COMPANY SHARE ANALYSIS: SAUDI ARABIA
13.2 COMPANY SHARE ANALYSIS: EGYPT
14 SWOT ANALYSIS
15 COMPANY PROFILE
15.1 UNITED FLOAT GLASS
15.1.1 COMPANY SNAPSHOT
15.1.2 REVENUE ANALYSIS
15.1.3 PRODUCT PORTFOLIO
15.1.4 RECENT DEVELOPMENT
15.2 XINYI GLASS HOLDINGS LIMITED
15.2.1 COMPANY SNAPSHOT
15.2.2 REVENUE ANALYSIS
15.2.3 PRODUCT PORTFOLIO
15.2.4 RECENT DEVELOPMENT
15.3 OBEIKAN GLASS COMPANY
15.3.1 COMPANY SNAPSHOT
15.3.2 REVENUE ANALYSIS
15.3.3 PRODUCT PORTFOLIO
15.3.4 RECENT DEVELOPMENT
15.4 GUARDIAN INDUSTRIES HOLDINGS
15.4.1 COMPANY SNAPSHOT
15.4.2 PRODUCT PORTFOLIO
15.4.3 RECENT DEVELOPMENT
15.5 SPHINX
15.5.1 COMPANY SNAPSHOT
15.5.2 PRODUCT PORTFOLIO
15.5.3 RECENT DEVELOPMENT
15.6 AL JAZEERA GLASS
15.6.1 COMPANY SNAPSHOT
15.6.2 PRODUCT PORTFOLIO
15.6.3 RECENT DEVELOPMENT
15.7 ARAB UNION GLASS CO., LTD
15.7.1 COMPANY SNAPSHOT
15.7.2 PRODUCT PORTFOLIO
15.7.3 RECENT DEVELOPMENT
15.8 AL ANDALUS GLASS
15.8.1 COMPANY SNAPSHOT
15.8.2 PRODUCT PORTFOLIO
15.8.3 RECENT DEVELOPMENT
15.9 CHINA GLASS HOLDINGS LIMITED
15.9.1 COMPANY SNAPSHOT
15.9.2 REVENUE ANALYSIS
15.9.3 PRODUCT PORTFOLIO
15.9.4 RECENT DEVELOPMENT
15.1 DR. GREICHE GLASS
15.10.1 COMPANY SNAPSHOT
15.10.2 PRODUCT PORTFOLIO
15.10.3 RECENT DEVELOPMENT
15.11 EGYPTIAN GLASS COMPANY
15.11.1 COMPANY SNAPSHOT
15.11.2 PRODUCT PORTFOLIO
15.11.3 RECENT DEVELOPMENT
15.12 GUARDIAN INDUSTRIES HOLDINGS
15.12.1 COMPANY SNAPSHOT
15.12.2 PRODUCT PORTFOLIO
15.12.3 RECENT DEVELOPMENT
15.13 MANNA GLASS CO.
15.13.1 COMPANY SNAPSHOT
15.13.2 PRODUCT PORTFOLIO
15.13.3 RECENT DEVELOPMENT
15.14 MOHAMMED MANNAA GLASS CORPORATION
15.14.1 COMPANY SNAPSHOT
15.14.2 PRODUCT PORTFOLIO
15.14.3 RECENT DEVELOPMENT
15.15 SISECAM
15.15.1 COMPANY SNAPSHOT
15.15.2 REVENUE ANALYSIS
15.15.3 PRODUCT PORTFOLIO
15.15.4 RECENT DEVELOPMENT
16 QUESTIONNAIRE
17 RELATED REPORTS
List of Table
TABLE 1 NUMBER OF PRODUCTS IN DEVELOPMENT
TABLE 2 TIMELINES AND MILESTONES IN THE SAUDI ARABIA & EGYPT FLOAT GLASS INDUSTRY
TABLE 3 SAUDI ARABIA & EGYPT FLOAT GLASS MARKET, 2018-2033 (USD THOUSAND)
TABLE 4 SAUDI ARABIA & EGYPT FLOAT GLASS MARKET, BY PRODUCT TYPE, 2018-2033 (USD THOUSAND)
TABLE 5 SAUDI ARABIA & EGYPT CLEAR FLOAT GLASS IN FLOAT GLASS MARKET, BY THICKNESS, 2018-2033 (USD THOUSAND)
TABLE 6 SAUDI ARABIA & EGYPT CLEAR FLOAT GLASS IN FLOAT GLASS MARKET, BY COATING, 2018-2033 (USD THOUSAND)
TABLE 7 SAUDI ARABIA & EGYPT CLEAR FLOAT GLASS IN FLOAT GLASS MARKET, BY STATE, 2018-2033 (USD THOUSAND)
TABLE 8 SAUDI ARABIA & EGYPT TINTED FLOAT GLASS IN FLOAT GLASS MARKET, BY COLOR, 2018-2033 (USD THOUSAND)
TABLE 9 SAUDI ARABIA & EGYPT TINTED FLOAT GLASS IN FLOAT GLASS MARKET, BY THICKNESS, 2018-2033 (USD THOUSAND)
TABLE 10 SAUDI ARABIA & EGYPT TINTED FLOAT GLASS IN FLOAT GLASS MARKET, BY COATING, 2018-2033 (USD THOUSAND)
TABLE 11 SAUDI ARABIA & EGYPT TINTED FLOAT GLASS IN FLOAT GLASS MARKET, BY STATE, 2018-2033 (USD THOUSAND)
TABLE 12 SAUDI ARABIA & EGYPT ONLINE COATED FLOAT (CVD/REFLECTIVE) IN FLOAT GLASS MARKET, BY STATE, 2018-2033 (USD THOUSAND)
TABLE 13 SAUDI ARABIA & EGYPT LOW-IRON (EXTRA CLEAR) FLOAT GLASS IN FLOAT GLASS MARKET, BY THICKNESS, 2018-2033 (USD THOUSAND)
TABLE 14 SAUDI ARABIA & EGYPT LOW-IRON (EXTRA CLEAR) FLOAT GLASS IN FLOAT GLASS MARKET, BY COATING, 2018-2033 (USD THOUSAND)
TABLE 15 SAUDI ARABIA & EGYPT LOW-IRON (EXTRA CLEAR) FLOAT GLASS IN FLOAT GLASS MARKET, BY STATE, 2018-2033 (USD THOUSAND)
TABLE 16 SAUDI ARABIA & EGYPT MIRROR-GRADE FLOAT (SILVERING SUBSTRATE) IN FLOAT GLASS MARKET, BY STATE, 2018-2033 (USD THOUSAND)
TABLE 17 SAUDI ARABIA & EGYPT FLOAT GLASS MARKET, BY COATING TYPE, 2018-2033 (USD THOUSAND)
TABLE 18 SAUDI ARABIA & EGYPT UNCOATED FLOAT IN FLOAT GLASS MARKET, BY STATE, 2018-2033 (USD THOUSAND)
TABLE 19 SAUDI ARABIA & EGYPT HARD-COAT (PYROLYTIC) IN FLOAT GLASS MARKET, BY STATE, 2018-2033 (USD THOUSAND)
TABLE 20 SAUDI ARABIA & EGYPT SOFT-COAT (MAGNETRON SPUTTERED) IN FLOAT GLASS MARKET, BY STATE, 2018-2033 (USD THOUSAND)
TABLE 21 SAUDI ARABIA & EGYPT OTHER FUNCTIONAL COATINGS IN FLOAT GLASS MARKET, BY STATE, 2018-2033 (USD THOUSAND)
TABLE 22 SAUDI ARABIA & EGYPT FLOAT GLASS MARKET, BY APPLICATION, 2018-2033 (USD THOUSAND)
TABLE 23 SAUDI ARABIA & EGYPT BUILDING & CONSTRUCTION IN FLOAT GLASS MARKET, BY TYPE, 2018-2033 (USD THOUSAND)
TABLE 24 SAUDI ARABIA & EGYPT EXTERIOR GLAZING IN FLOAT GLASS MARKET, BY TYPE, 2018-2033 (USD THOUSAND)
TABLE 25 SAUDI ARABIA & EGYPT INTERIOR IN FLOAT GLASS MARKET, BY TYPE, 2018-2033 (USD THOUSAND)
TABLE 26 SAUDI ARABIA & EGYPT BUILDING & CONSTRUCTION IN FLOAT GLASS MARKET, BY STATE, 2018-2033 (USD THOUSAND)
TABLE 27 SAUDI ARABIA & EGYPT AUTOMOTIVE & TRANSPORT IN FLOAT GLASS MARKET, BY TYPE, 2018-2033 (USD THOUSAND)
TABLE 28 SAUDI ARABIA & EGYPT AUTOMOTIVE & TRANSPORT IN FLOAT GLASS MARKET, BY STATE, 2018-2033 (USD THOUSAND)
TABLE 29 SAUDI ARABIA & EGYPT SOLAR ENERGY IN FLOAT GLASS MARKET, BY TYPE, 2018-2033 (USD THOUSAND)
TABLE 30 SAUDI ARABIA & EGYPT SOLAR ENERGY IN FLOAT GLASS MARKET, BY STATE, 2018-2033 (USD THOUSAND)
TABLE 31 SAUDI ARABIA & EGYPT FURNITURE & APPLIANCES IN FLOAT GLASS MARKET, BY TYPE, 2018-2033 (USD THOUSAND)
TABLE 32 SAUDI ARABIA & EGYPT FURNITURE & APPLIANCES IN FLOAT GLASS MARKET, BY STATE, 2018-2033 (USD THOUSAND)
TABLE 33 SAUDI ARABIA & EGYPT OTHERS IN FLOAT GLASS MARKET, BY STATE, 2018-2033 (USD THOUSAND)
TABLE 34 SAUDI ARABIA & EGYPT FLOAT GLASS MARKET, BY END USE, 2018-2033 (USD THOUSAND)
TABLE 35 SAUDI ARABIA & EGYPT OEMS AND PROCESSORS IN FLOAT GLASS MARKET, BY TYPE, 2018-2033 (USD THOUSAND)
TABLE 36 SAUDI ARABIA & EGYPT OEMS AND PROCESSORS IN FLOAT GLASS MARKET, BY STATE, 2018-2033 (USD THOUSAND)
TABLE 37 SAUDI ARABIA & EGYPT DISTRIBUTORS & WHOLESALE IN FLOAT GLASS MARKET, BY STATE, 2018-2033 (USD THOUSAND)
TABLE 38 SAUDI ARABIA & EGYPT RETAIL AND SMALL FABRICATORS IN FLOAT GLASS MARKET, BY STATE, 2018-2033 (USD THOUSAND)
TABLE 39 SAUDI ARABIA & EGYPT OTHERS IN FLOAT GLASS MARKET, BY STATE, 2018-2033 (USD THOUSAND)
TABLE 40 SAUDI ARABIA & EGYPT FLOAT GLASS MARKET, BY DISTRIBUTION CHANNEL, 2018-2033 (USD THOUSAND)
TABLE 41 SAUDI ARABIA & EGYPT DIRECT IN FLOAT GLASS MARKET, BY TYPE, 2018-2033 (USD THOUSAND)
TABLE 42 SAUDI ARABIA & EGYPT DIRECT IN FLOAT GLASS MARKET, BY STATE, 2018-2033 (USD THOUSAND)
TABLE 43 SAUDI ARABIA & EGYPT INDIRECT IN FLOAT GLASS MARKET, BY TYPE, 2018-2033 (USD THOUSAND)
TABLE 44 SAUDI ARABIA & EGYPT INDIRECT IN FLOAT GLASS MARKET, BY STATE, 2018-2033 (USD THOUSAND)
List of Figure
FIGURE 1 SAUDI ARABIA & EGYPT FLOAT GLASS MARKET: SEGMENTATION
FIGURE 2 SAUDI ARABIA & EGYPT FLOAT GLASS MARKET: DATA TRIANGULATION
FIGURE 3 SAUDI ARABIA & EGYPT FLOAT GLASS MARKET: DROC ANALYSIS
FIGURE 4 SAUDI ARABIA & EGYPT FLOAT GLASS MARKET: REGIONAL VS COUNTRY MARKET ANALYSIS
FIGURE 5 SAUDI ARABIA & EGYPT FLOAT GLASS MARKET: COMPANY RESEARCH ANALYSIS
FIGURE 6 SAUDI ARABIA & EGYPT FLOAT GLASS MARKET: INTERVIEW DEMOGRAPHICS
FIGURE 7 SAUDI ARABIA FLOAT GLASS MARKET: DBMR MARKET POSITION GRID
FIGURE 8 EGYPT FLOAT GLASS MARKET: DBMR MARKET POSITION GRID
FIGURE 9 SAUDI ARABIA FLOAT GLASS MARKET: VENDOR SHARE ANALYSIS
FIGURE 10 EGYPT FLOAT GLASS MARKET: VENDOR SHARE ANALYSIS
FIGURE 11 SAUDI ARABIA FLOAT GLASS MARKET: MARKET APPLICATION COVERAGE GRID
FIGURE 12 EGYPT FLOAT GLASS MARKET: MARKET APPLICATION COVERAGE GRID
FIGURE 13 SAUDI ARABIA & EGYPT FLOAT GLASS MARKET: SEGMENTATION
FIGURE 14 EXECUTIVE SUMMARY
FIGURE 15 BOOMING CONSTRUCTION & MEGA-PROJECTS IS A MAJOR FACTOR BOOSTING THE SAUDI ARABIA & EGYPT FLOAT GLASS MARKET IN THE FORECAST PERIOD OF 2026 TO 2033
FIGURE 16 CLEAR FLOAT GLASS SEGMENT IS EXPECTED TO ACCOUNT FOR THE LARGEST SHARE OF SAUDI ARABIA & EGYPT FLOAT GLASS MARKET IN 2026 & 2033
FIGURE 17 PORTER’S FIVE FORCES
FIGURE 18 VALUE CHAIN ANALYSIS FOR SAUDI ARABIA AND EGYPT FLOAT GLASS MARKET
FIGURE 19 TOTAL NUMBER OF DEALS
FIGURE 20 DEALS BY TYPE
FIGURE 21 DEALS BY SEGMENT
FIGURE 22 EGYPT FLOAT GLASS MARKET: COMPANY SHARE 2025 (%)
FIGURE 23 SAUDI ARABIA FLOAT GLASS MARKET: COMPANY SHARE 2025 (%)
FIGURE 24 DROC ANALYSIS
FIGURE 25 DROC ANALYSIS
FIGURE 26 SAUDI ARABIA & EGYPT FLOAT GLASS MARKET, BY PRODUCT TYPE, 2025
FIGURE 27 SAUDI ARABIA & EGYPT FLOAT GLASS MARKET, BY COATING TYPE, 2025
FIGURE 28 SAUDI ARABIA & EGYPT FLOAT GLASS MARKET, BY APPLICATION, 2025
FIGURE 29 SAUDI ARABIA & EGYPT FLOAT GLASS MARKET, BY END USE, 2025
FIGURE 30 SAUDI ARABIA & EGYPT FLOAT GLASS MARKET, BY DISTRIBUTION CHANNEL, 2025
FIGURE 31 SAUDI ARABIA & EGYPT FLOAT GLASS MARKET: COMPANY SHARE 2025 (%)
FIGURE 32 SAUDI ARABIA & EGYPT FLOAT GLASS MARKET: COMPANY SHARE 2025 (%)
Saudi Arabia And Egypt Float Glass Market, Supply Chain Analysis and Ecosystem Framework
To support market growth and help clients navigate the impact of geopolitical shifts, DBMR has integrated in-depth supply chain analysis into its Saudi Arabia And Egypt Float Glass Market research reports. This addition empowers clients to respond effectively to global changes affecting their industries. The supply chain analysis section includes detailed insights such as Saudi Arabia And Egypt Float Glass Market consumption and production by country, price trend analysis, the impact of tariffs and geopolitical developments, and import and export trends by country and HSN code. It also highlights major suppliers with data on production capacity and company profiles, as well as key importers and exporters. In addition to research, DBMR offers specialized supply chain consulting services backed by over a decade of experience, providing solutions like supplier discovery, supplier risk assessment, price trend analysis, impact evaluation of inflation and trade route changes, and comprehensive market trend analysis.
Data collection and base year analysis are done using data collection modules with large sample sizes. The stage includes obtaining market information or related data through various sources and strategies. It includes examining and planning all the data acquired from the past in advance. It likewise envelops the examination of information inconsistencies seen across different information sources. The market data is analysed and estimated using market statistical and coherent models. Also, market share analysis and key trend analysis are the major success factors in the market report. To know more, please request an analyst call or drop down your inquiry.
The key research methodology used by DBMR research team is data triangulation which involves data mining, analysis of the impact of data variables on the market and primary (industry expert) validation. Data models include Vendor Positioning Grid, Market Time Line Analysis, Market Overview and Guide, Company Positioning Grid, Patent Analysis, Pricing Analysis, Company Market Share Analysis, Standards of Measurement, Global versus Regional and Vendor Share Analysis. To know more about the research methodology, drop in an inquiry to speak to our industry experts.
Data Bridge Market Research is a leader in advanced formative research. We take pride in servicing our existing and new customers with data and analysis that match and suits their goal. The report can be customized to include price trend analysis of target brands understanding the market for additional countries (ask for the list of countries), clinical trial results data, literature review, refurbished market and product base analysis. Market analysis of target competitors can be analyzed from technology-based analysis to market portfolio strategies. We can add as many competitors that you require data about in the format and data style you are looking for. Our team of analysts can also provide you data in crude raw excel files pivot tables (Fact book) or can assist you in creating presentations from the data sets available in the report.


