
South East and Rocky Mountains Pre-engineered Building Market Analysis and Size
The South East and Rocky Mountains pre-engineered building is being driven cost-effectiveness and time efficiency are expected to drive the market growth is, an important driver for the South East and Rocky Mountains pre-engineered building. Moreover, advances in technology and innovations in design and materials are driving progress in the construction sector is expected to boost market growth. However, The cost associated with transporting prefabricated modules is expected to challenge market growth which is expected to restrain the market growth.
Data Bridge Market Research analyses that the South East and Rocky Mountains pre-engineered building market is expected to reach the value of USD 2,490.94 million by 2030, at a CAGR of 8.4% during the forecast period 2023-2030.
|
Report Metric |
Details |
|
Forecast Period |
2023 to 2030 |
|
Base Year |
2022 |
|
Historic Year |
2021 (Customizable 2015-2020) |
|
Quantitative Units |
Revenue in USD Million |
|
Segments Covered |
Building Type (Commercial and Industrial), Building Size (Small-Scale Buildings (20,000 Sq. Ft - 50,000 Sq. Ft), Medium-Scale Buildings (50,001 Sq. Ft - 70,000 Sq. Ft), Large-Scale Buildings (More than 70,000 Sq. Ft)), Construction Material (Steel, Aluminum, and Others) |
|
Countries Covered |
Florida, North Carolina, Georgia, Virginia, Tennessee, South Carolina, Louisiana, Alabama, Mississippi and West Virginia, Colorado, Utah, Montana, Wyoming, Idaho, and New Mexico |
|
Market Players Covered |
Nucor Corporation, Cornerstone Building Brands, Inc., ATCO LTD., Allied builders, Stevens, Wollam Construction, JB STEEL, BlueScope Buildings North America, Mountain State Construction, AA Metal Buildings, Sunward Steel Buildings, Whirlwind Steel, CanAm Steel Buildings, Pluma Construction Systems Steel Buildings, Federal Steel Systems, DFB Buildings, Great Western Building Systems, Schulte Building Systems, Inc, Pacific Building Systems and among others |
Market Definition
Pre-engineered buildings (PEBs) are a type of construction solution characterized by the use of pre-fabricated and pre-designed structural components. These components, including columns, beams, roof trusses, wall panels, and other elements, are manufactured off-site in a factory or manufacturing facility. They are then transported to the construction site where they are assembled and erected to create the final building structure.
South East and Rocky Mountains Pre-engineered Building Market Dynamics
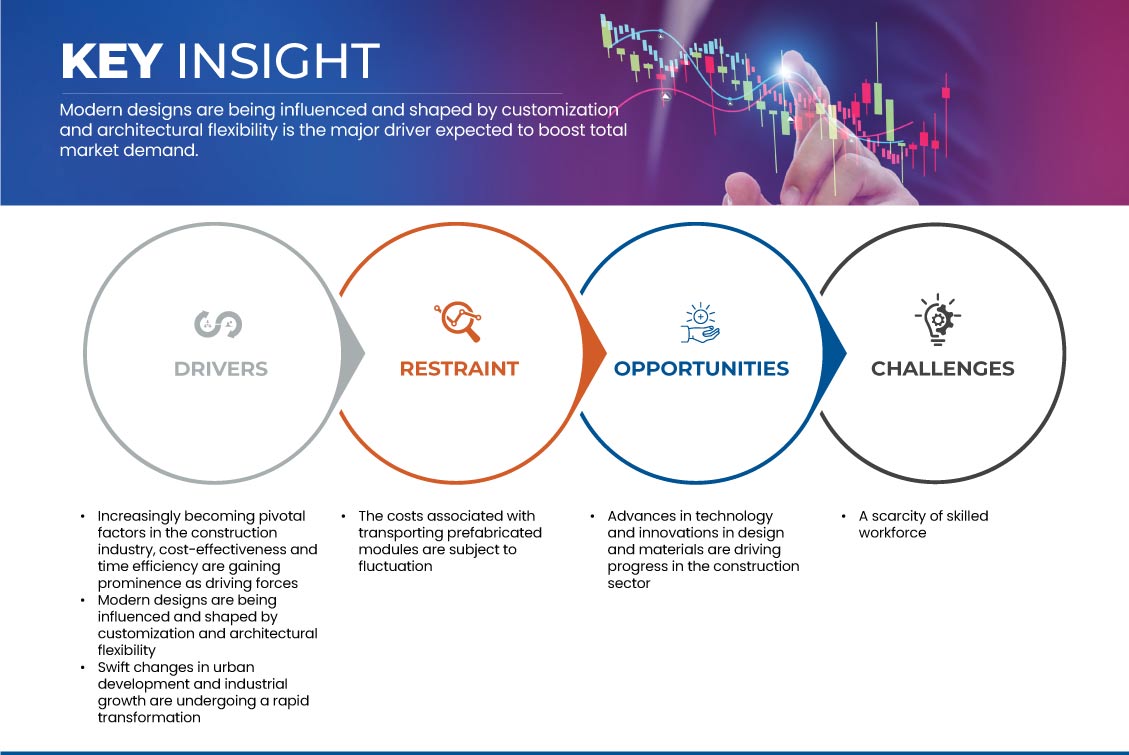
This section deals with understanding the market drivers, advantages, opportunities, restraints and challenges. All of this is discussed in detail as below:
Drivers
- Increasingly Becoming Pivotal Factors in the Construction Industry, Cost-Effectiveness and Time Efficiency are Gaining Prominence as Driving Forces
The growing importance of driving forces in the construction sector, such as cost-efficiency and time savings, is expected to significantly drive the market growth. These forces are reshaping the construction industry by offering practical solutions to address the pressing challenges of reducing costs and expediting project timelines. Pre-engineered buildings offer distinct advantages in terms of cost-efficiency and time savings when compared to traditional construction methods. Pre-engineered structures are designed and manufactured off-site, allowing for precise planning and minimizing material wastage.
This results in reduced construction costs, as builders can purchase materials in bulk and streamline the construction process. In addition, pre-fabricated components are engineered for quick assembly, significantly reducing on-site labor requirements and associated costs. In contrast, traditional construction methods often involve lengthy planning, custom fabrication, and complex on-site construction, which can lead to higher expenses due to extended project timelines and labor-intensive work. The cost-efficient nature of pre-engineered buildings, combined with their expedited construction process, makes them a compelling choice for projects where budget and time constraints are critical considerations.
- Modern Designs are Being Influenced and Shaped by Customization and Architectural Flexibility
Customization and architectural versatility are playing a pivotal role in shaping modern designs and are poised to drive market growth. This trend reflects a fundamental shift in construction preferences, driven by factors such as aesthetics, functionality, and cost-efficiency.
The customization in pre-engineered buildings allows architects and builders to meet the unique needs of various industries and businesses. These structures can be tailored to accommodate specific functions and design preferences, making them highly adaptable for a wide range of applications. For instance, the South East region often requires buildings that can withstand hurricanes and high humidity, while the Rocky Mountains region demands structures capable of withstanding heavy snow loads. Customization ensures that PEBs can meet these varied climate and environmental challenges effectively. In addition, Architectural versatility plays a key role in meeting modern design demands. Pre-engineered building systems have evolved to offer a wide array of aesthetic options, including various cladding materials, colors, and finishes.
This versatility allows architects and designers to create visually appealing structures that align with their client's brand identity and architectural vision. Moreover, PEBs can incorporate architectural features such as large windows, skylights, and mezzanines, further enhancing their aesthetic appeal and functionality. Cost efficiency is another critical factor driving the adoption of customizable and architecturally versatile pre-engineered buildings. PEBs often result in shorter project timelines and reduced labor costs by streamlining the design and construction process. In addition, the ability to customize building sizes and features optimizes space utilization, reducing wasted square footage and, consequently, the overall cost of construction.
- Swift Changes in Urban Development and Industrial Growth are Undergoing a Rapid Transformation
The rapid transformation in urbanization and industrialization is expected to drive market growth. Several factors contribute to this significant market influence.
The accelerating pace of urbanization across the South East and Rocky Mountains regions is leading to increased demand for infrastructure and commercial spaces. There is a growing demand for efficient, budget-friendly, and rapid construction solutions as cities expand and populations increase. PEBs offer an ideal solution due to their speed of construction, versatility, and affordability. Industries ranging from manufacturing to warehousing, logistics, and commercial real estate are increasingly turning to PEBs to meet their construction needs. This trend is expected to drive substantial growth in the market. In addition, industrialization in these regions is fostering the development of various industries, including manufacturing, energy, and logistics. These industries require large, custom-designed spaces that can be quickly erected to accommodate their operations. PEBs are well-suited for such purposes, as they can be tailored to meet specific industrial requirements, including clear-span designs for unobstructed floor space and the ability to house heavy machinery and equipment. The increasing industrialization is expected to significantly increase the demand for PEBs as industrial facilities.
Opportunities
- Advances in Technology and Innovations in Design and Materials are Driving Progress in the Construction Sector
Technological advancements and innovations in design and materials are poised to create significant opportunities for market growth. These advancements represent a pivotal shift in the construction industry and offer a range of benefits that appeal to both builders and clients. One key opportunity lies in the improved efficiency and speed of construction through pre-engineered building systems. Advanced design software, computer-aided manufacturing (CAM), and Building Information Modeling (BIM) have revolutionized the way pre-engineered buildings are designed and fabricated. This results in faster project timelines, reduced labor costs, and enhanced precision during construction, which appeals to developers and contractors aiming to complete projects more quickly and cost-effectively.
Innovations in design have also expanded the architectural possibilities for pre-engineered buildings. Historically associated with utilitarian structures, pre-engineered buildings now incorporate versatile design options, allowing for more aesthetically pleasing and customized solutions. This shift broadens the market's appeal, as pre-engineered buildings become a viable choice for a wider range of applications, including commercial, industrial, and even residential projects. In the commercial sector, they include warehouses for efficient storage, retail spaces, modern office buildings, showrooms, and recreational facilities. In industrial settings, pre-engineered structures house manufacturing plants, distribution centers, workshops, agricultural facilities, and cold storage units, optimizing production and storage processes.
Restraints/ Challenges
- The Costs Associated with Transporting Prefabricated Modules are Subject to Fluctuation
Prefabricated constructed building is one of the quickest and most unique forms of construction as most of the construction is done off-site. Then the modules are transported carefully and assembled on-site. Prefabricated-constructed buildings are fast becoming the construction method choice across the world. People worldwide shifted to prefabricated construction due to cost-effectiveness, efficient construction, and safety associated with the workers. The transportation of prefabricated modular building sections requires lots of space. The restriction on manufacturing and transportation can limit the size of modular units used for construction, which impacts the desirable room sizes. Changing transportation costs for prefabricated modules can significantly restrain market growth.
- A Scarcity of Skilled Workforce
Pre-engineered building construction methods are gradually becoming a desired alternative to traditional on-site stick-built construction methods, which help minimize the on-site work and maximize the output and quicker delivery of the project. The primary advantage of pre-engineered buildings over the traditional construction method is improved quality of the constructed product, maintaining and supporting sustainable and greener construction by reducing waste generation.
The major challenge faced by the market is the lack of skilled labor in the industry, which hampers the growth of the market to a larger extent. An unskilled labor force negatively impacts project performance. The focus should be made on improving and enhancing labor skills as it is highly demanding in the construction sector. Performance in any industry is important in achieving measures to ensure sustainability and competitiveness
Recent Developments
- In August 2023, Cornerstone Building Brands, Inc., the largest manufacturer of exterior building products in North America, has acquired MAC Metal Architectural, a company based in Saint-Hubert, Quebec, specializing in high-end steel siding and roofing products for residential and commercial markets in North America. This acquisition aims to expand Cornerstone Building Brands' exterior product portfolio, particularly in the fast-growing metal siding and roofing segment, enhancing their market presence and leveraging their manufacturing expertise. The acquisition is expected to bring benefits through margin expansion, increased market share, and manufacturing efficiencies.
- In September 2023, ATCO LTD. released its 2022 Sustainability Report highlighting the company’s sustainability and environmental, social, and governance (ESG) performance including strategies, initiatives, targets, and metrics. The report focuses on the transition to low-carbon energy; climate change and environmental stewardship; operational reliability and resilience; community and Indigenous relations; diversity, equity, and inclusion; and safety. This will help the company to attract a large consumer base.
South East and Rocky Mountains Pre-engineered Building Market Scope
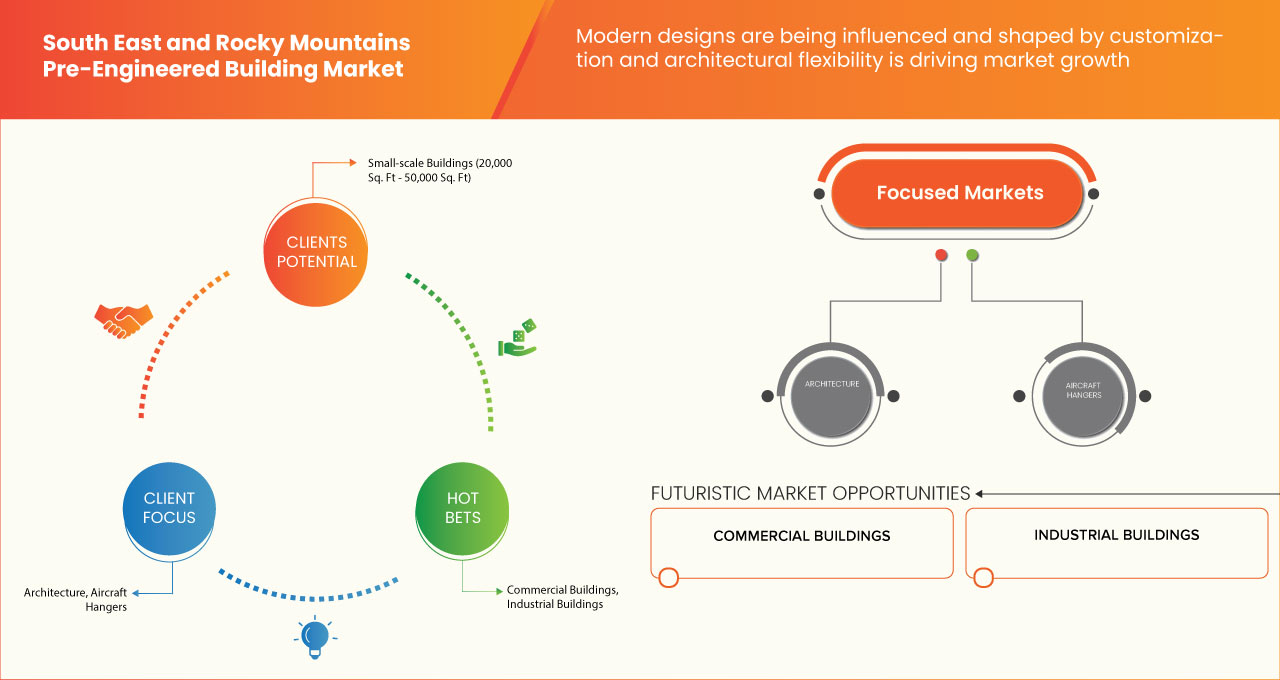
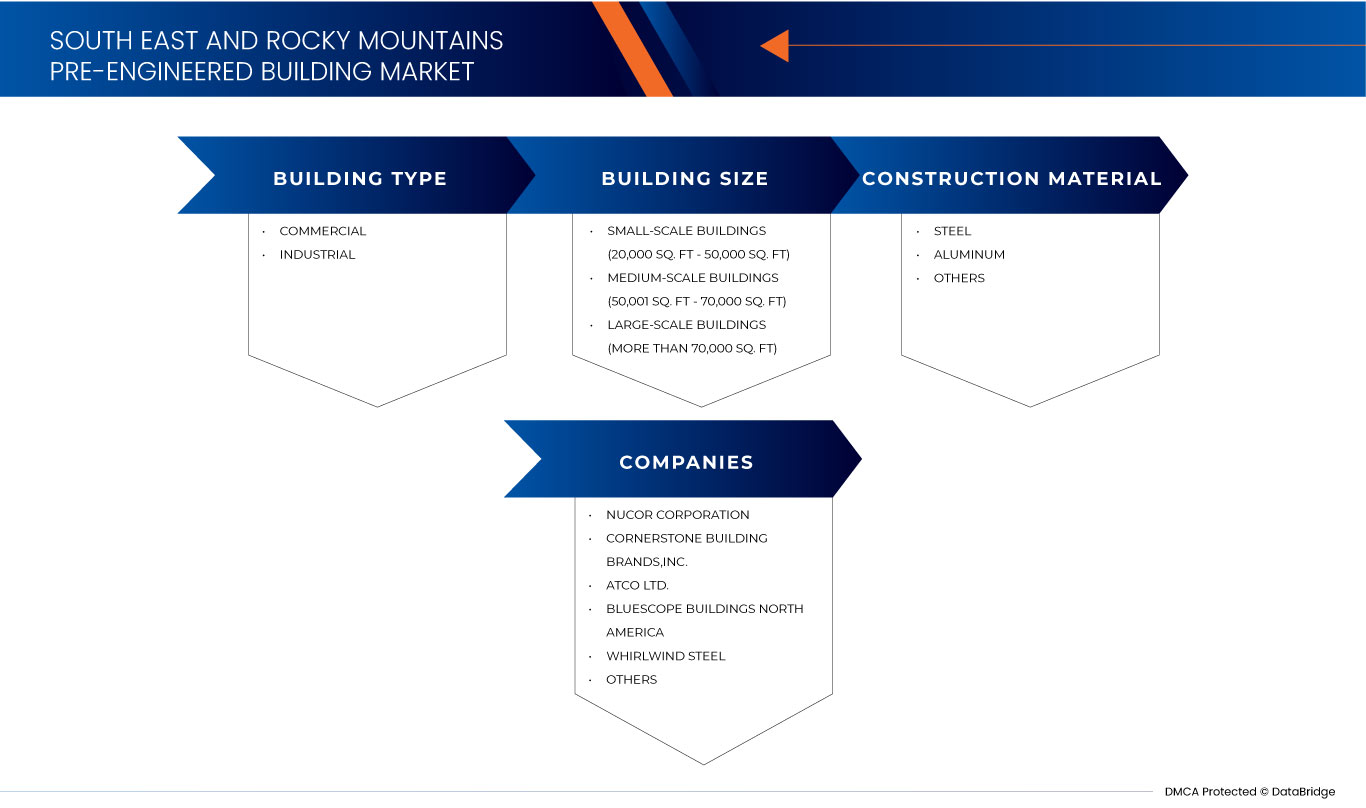
The South East and Rocky Mountains pre-engineered building market is categorized into three notable segment by building type, building size, construction material. The growth amongst these segments will help you analyze major growth segments in the industries and provide the users with a valuable market overview and market insights to help them make strategic decisions for identifying core market applications.
Building Type
- Commercial
- Industrial
On the basis of building type, the market is segmented into commercial and industrial.
Building Size
- Small-Scale Buildings (20,000 Sq. Ft - 50,000 Sq. Ft)
- Medium-Scale Buildings (50,001 Sq. Ft - 70,000 Sq. Ft)
- Large-Scale Buildings (More than 70,000 Sq. Ft)
On the basis of building size, the market is segmented into small-scale buildings (20,000 Sq. Ft - 50,000 Sq. Ft), medium-scale buildings (50,001 Sq. Ft - 70,000 Sq. Ft), large-scale buildings (more than 70,000 Sq. Ft).
Construction Material
- Steel
- Aluminum
- Others
On the basis of construction material, the market is segmented into steel, aluminium and others.
South East and Rocky Mountains Pre-engineered Building Market Regional Analysis/Insights
The South East and Rocky Mountains pre-engineered building market is categorized into three notable segment by building type, building size, construction material.
The states covered in the South East and Rocky mountains pre-engineered building market report are Florida, North Carolina, Georgia, Virginia, Tennessee, South Carolina, Louisiana, Alabama, Mississippi and West Virginia, Colorado, Utah, Montana, Wyoming, Idaho, and New Mexico.
South East is expected to dominate due to the presence of key market players in the largest consumer market with high GDP. Florida is expected to grow due to rise in demand of pre-engineered building in commercial segment.
The country section of the report also provides individual market impacting factors and changes in market regulation that impact the current and future trends of the market. Data points like down-stream and upstream value chain analysis, technical trends and porter's five forces analysis, case studies are some of the pointers used to forecast the market scenario for individual countries. Also, the presence and availability of Asia-Pacific brands and their challenges faced due to large or scarce competition from local and domestic brands, impact of domestic tariffs and trade routes are considered while providing forecast analysis of the country data.
Competitive Landscape and South East and Rocky Mountains Pre-engineered Building Market Share Analysis
The South East and Rocky Mountains pre-engineered building market competitive landscape provides details by competitor. Details included are company overview, company financials, revenue generated, market potential, investment in research and development, new market initiatives, presence, production sites and facilities, production capacities, company strengths and weaknesses, product launch, product width and breadth, application dominance. The above data points provided are only related to the companies' focus on the South East and Rocky mountains pre-engineered building market.
Some of the major players operating in the South East and Rocky mountains pre-engineered building are Nucor Corporation, Cornerstone Building Brands, Inc., ATCO LTD., Allied builders, Stevens, Wollam Construction, JB STEEL, BlueScope Buildings North America, Mountain State Construction, AA Metal Buildings, Sunward Steel Buildings, Whirlwind Steel, CanAm Steel Buildings, Pluma Construction Systems Steel Buildings, Federal Steel Systems, DFB Buildings, Great Western Building Systems, Schulte Building Systems, Inc, Pacific Building Systems and among others.
SKU-

- Interactive Data Analysis Dashboard
- Company Analysis Dashboard for high growth potential opportunities
- Research Analyst Access for customization & queries
- Competitor Analysis with Interactive dashboard
- Latest News, Updates & Trend analysis
- Harness the Power of Benchmark Analysis for Comprehensive Competitor Tracking
Table of Content
1 INTRODUCTION
1.1 OBJECTIVES OF THE STUDY
1.2 MARKET DEFINITION
1.3 OVERVIEW OF THE SOUTH EAST AND ROCKY MOUNTAINS PRE-ENGINEERED BUILDING MARKET
1.4 LIMITATIONS
1.5 MARKETS COVERED
2 MARKET SEGMENTATION
2.1 MARKETS COVERED
2.2 GEOGRAPHICAL SCOPE
2.3 YEARS CONSIDERED FOR THE STUDY
2.4 CURRENCY AND PRICING
2.5 DBMR TRIPOD DATA VALIDATION MODEL
2.6 MULTIVARIATE MODELLING MULTIVARIATE MODELING
2.7 PRIMARY INTERVIEWS WITH KEY OPINION LEADERS
2.8 DBMR MARKET POSITION GRID
2.9 SECONDARY SOURCES
2.1 ASSUMPTIONS
3 EXECUTIVE SUMMARY
4 PREMIUM INSIGHTS
5 MARKET OVERVIEW
5.1 DRIVERS
5.1.1 INCREASINGLY BECOMING PIVOTAL FACTORS IN THE CONSTRUCTION INDUSTRY, COST-EFFECTIVENESS AND TIME EFFICIENCY ARE GAINING PROMINENCE AS DRIVING FORCES
5.1.2 MODERN DESIGNS ARE BEING INFLUENCED AND SHAPED BY CUSTOMIZATION AND ARCHITECTURAL FLEXIBILITY
5.1.3 SWIFT CHANGES IN URBAN DEVELOPMENT AND INDUSTRIAL GROWTH ARE UNDERGOING A RAPID TRANSFORMATION
5.2 RESTRAINT
5.2.1 THE COSTS ASSOCIATED WITH TRANSPORTING PREFABRICATED MODULES ARE SUBJECT TO FLUCTUATION
5.3 OPPORTUNITY
5.3.1 ADVANCES IN TECHNOLOGY AND INNOVATIONS IN DESIGN AND MATERIALS ARE DRIVING PROGRESS IN THE CONSTRUCTION SECTOR
5.4 CHALLENGE
5.4.1 A SCARCITY OF SKILLED WORKFORCE
6 SOUTH EAST AND ROCKY MOUNTAINS PRE-ENGINEERED BUILDING MARKET, BY BUILDING SIZE
6.1 OVERVIEW
6.1.1 SMALL-SCALE BUILDINGS (20,000 SQ. FT - 50,000 SQ. FT)
6.1.2 MEDIUM-SCALE BUILDINGS (50,001 SQ. FT - 70,000 SQ. FT)
6.1.3 LARGE-SCALE BUILDINGS (MORE THAN 70,000 SQ. FT)
7 SOUTH EAST AND ROCKY MOUNTAINS PRE-ENGINEERED BUILDING MARKET, BY BUILDING TYPE
7.1 OVERVIEW
7.2 INDUSTRIAL
7.2.1 INDUSTRIAL, BY TYPE
7.2.1.1 MANUFACTURING
7.2.1.1.1 MEDIUM-SCALE BUILDINGS (50,001 SQ. FT - 70,000 SQ. FT)
7.2.1.1.2 SMALL-SCALE BUILDINGS (20,000 SQ. FT - 50,000 SQ. FT))
7.2.1.1.3 LARGE-SCALE BUILDINGS (MORE THAN 70,000 SQ. FT)
7.2.1.2 HEAVY INDUSTRIES
7.2.1.3 PROCESSING
7.2.1.4 OTHERS
7.2.2 INDUSTRIAL, BY BUILDING SIZE
7.2.2.1 MEDIUM-SCALE BUILDINGS (50,001 SQ. FT - 70,000 SQ. FT)
7.2.2.2 SMALL-SCALE BUILDINGS (20,000 SQ. FT - 50,000 SQ. FT)
7.2.2.3 LARGE-SCALE BUILDINGS (MORE THAN 70,000 SQ. FT)
7.2.3 COMMERCIAL
7.2.4 WAREHOUSES
7.2.5 RETAIL
7.2.6 OFFICES
7.2.7 SHOWROOMS
7.2.8 OTHERS
8 SOUTH EAST AND ROCKY MOUNTAINS PRE-ENGINEERED BUILDING MARKET, BY CONSTRUCTION MATERIAL
8.1 OVERVIEW
8.1.1 STEEL
8.1.2 ALUMINIUM
8.1.3 OTHERS
9 SOUTH EAST AND ROCKY MOUNTAINS PRE-ENGINEERED BUILDING MARKET, BY REGION
10 SOUTH EAST AND ROCKY MOUNTAINS PRE-ENGINEERED BUILDING MARKET: COMPANY LANDSCAPE
10.1 COMPANY SHARE ANALYSIS: SOUTH EAST
10.2 COMPANY SHARE ANALYSIS: ROCKY MOUNTAINS
11 SWOT ANALYSIS
12 COMPANY PROFILES
12.1 NUCOR CORPORATION
12.1.1 COMPANY SNAPSHOT
12.1.2 REVENUE ANALYSIS
12.1.3 PRODUCT PORTFOLIO
12.1.4 RECENT DEVELOPMENT
12.2 CORNERSTONE BUILDING BRANDS, INC.
12.2.1 COMPANY SNAPSHOT
12.2.2 REVENUE ANALYSIS
12.2.3 PRODUCT PORTFOLIO
12.2.4 RECENT DEVELOPMENTS
12.3 ATCO LTD.
12.3.1 COMPANY SNAPSHOT
12.3.2 REVENUE ANALYSIS
12.3.3 PRODUCT PORTFOLIO
12.3.4 RECENT DEVELOPMENT
12.4 BLUESCOPE BUILDINGS NORTH AMERICA
12.4.1 COMPANY SNAPSHOT
12.4.2 PRODUCT PORTFOLIO
12.4.3 RECENT DEVELOPMENTS
12.5 WHIRLWINDSTEEL
12.5.1 COMPANY SNAPSHOT
12.5.2 PRODUCT PORTFOLIO
12.5.3 RECENT DEVELOPMENTS
12.6 AA METAL BUILDINGS
12.6.1 COMPANY SNAPSHOT
12.6.2 PRODUCT PORTFOLIOS
12.6.3 RECENT DEVELOPMENTS
12.7 ALLIED BUILDERS
12.7.1 COMPANY SNAPSHOT
12.7.2 PRODUCT PORTFOLIO
12.7.3 RECENT DEVELOPMENTS
12.8 CANAM STEEL BUILDINGS
12.8.1 COMPANY SNAPSHOT
12.8.2 PRODUCT PORTFOLIO
12.8.3 RECENT DEVELOPMENTS
12.9 DFB BUILDINGS
12.9.1 COMPANY SNAPSHOT
12.9.2 PRODUCT PORTFOLIO
12.9.3 RECENT DEVELOPMENTS
12.1 FEDERAL STEEL SYSTEMS
12.10.1 COMPANY SNAPSHOT
12.10.2 PRODUCT PORTFOLIO
12.10.3 RECENT DEVELOPMENTS
12.11 GREAT WESTERN BUILDING SYSTEMS
12.11.1 COMPANY SNAPSHOT
12.11.2 PRODUCT PORTFOLIO
12.11.3 RECENT DEVELOPMENTS
12.12 JB STEEL
12.12.1 COMPANY SNAPSHOT
12.12.2 PRODUCT PORTFOLIO
12.12.3 RECENT DEVELOPMENTS
12.13 MOUNTAINS STATE CONSTRUCTION
12.13.1 COMPANY SNAPSHOT
12.13.2 PRODUCT PORTFOLIO
12.13.3 RECENT DEVELOPMENTS
12.14 PACIFIC BUILDING SYSTEMS
12.14.1 COMPANY SNAPSHOT
12.14.2 PRODUCT PORTFOLIO
12.14.3 RECENT DEVELOPMENTS
12.15 PLUMA CONSTRUCTION SYSTEMS STEEL BUILDINGS
12.15.1 COMPANY SNAPSHOT
12.15.2 PRODUCT PORTFOLIO
12.15.3 RECENT DEVELOPMENTS
12.16 SCHULTE BUILDING SYSTEMS, INC.
12.16.1 COMPANY SNAPSHOT
12.16.2 PRODUCT PORTFOLIO
12.16.3 RECENT DEVELOPMENTS
12.17 STEVENS
12.17.1 COMPANY SNAPSHOT
12.17.2 PRODUCT PORTFOLIO
12.17.3 RECENT DEVELOPMENTS
12.18 SUNWARD STEEL BUILDING
12.18.1 COMPANY SNAPSHOT
12.18.2 PRODUCT PORTFOLIO
12.18.3 RECENT DEVELOPMENTS
12.19 WOLLAM CONSTRUCTION
12.19.1 COMPANY SNAPSHOT
12.19.2 PRODUCT PORTFOLIO
12.19.3 RECENT DEVELOPMENTS
13 QUESTIONNAIRE
14 RELATED REPORTS
List of Table
TABLE 1 SOUTH EAST PRE-ENGINEERED BUILDING MARKET, BY BUILDING SIZE, 2021-2030 (USD MILLION)
TABLE 2 ROCKY MOUNTAINS PRE-ENGINEERED BUILDING MARKET, BY BUILDING SIZE, 2021-2030 (USD MILLION)
TABLE 3 SOUTH EAST PRE-ENGINEERED BUILDING MARKET, BY BUILDING TYPE, 2021-2030 (USD MILLION)
TABLE 4 ROCKY MOUNTAINS PRE-ENGINEERED BUILDING MARKET, BY BUILDING TYPE, 2021-2030 (USD MILLION)
TABLE 5 SOUTH EAST INDUSTRIAL IN PRE-ENGINEERED BUILDING MARKET, BY TYPE, 2021-2030 (USD MILLION)
TABLE 6 ROCKY MOUNTAINS PRE-ENGINEERED BUILDING MARKET, BY TYPE, 2021-2030 (USD MILLION)
TABLE 7 SOUTH EAST MANUFACTURING IN PRE-ENGINEERED BUILDING MARKET, BY BUILDING SIZE, 2021-2030 (USD MILLION)
TABLE 8 ROCKY MOUNTAINS PRE-ENGINEERED BUILDING MARKET, BY BUILDING SIZE, 2021-2030 (USD MILLION)
TABLE 9 SOUTH EAST MANUFACTURING IN PRE-ENGINEERED BUILDING MARKET, BY BUILDING SIZE, 2021-2030 (USD MILLION)
TABLE 10 ROCKY MOUNTAINS PRE-ENGINEERED BUILDING MARKET, BY BUILDING SIZE, 2021-2030 (USD MILLION)
TABLE 11 SOUTH EAST COMMERCIAL IN PRE-ENGINEERED BUILDING MARKET, BY TYPE, 2021-2030 (USD MILLION)
TABLE 12 ROCKY MOUNTAINS PRE-ENGINEERED BUILDING MARKET, BY TYPE, 2021-2030 (USD MILLION)
TABLE 13 SOUTH EAST PRE-ENGINEERED BUILDING MARKET, BY CONSTRUCTION MATERIAL, 2021-2030 (USD MILLION)
TABLE 14 ROCKY MOUNTAINS PRE-ENGINEERED BUILDING MARKET, BY CONSTRUCTION MATERIAL, 2021-2030 (USD MILLION)
TABLE 15 SOUTH EAST AND ROCKY MOUNTAINS PRE-ENGINEERED BUILDING MARKET, BY REGION, 2021-2030 (USD MILLION)
TABLE 16 SOUTH EAST PRE-ENGINEERED BUILDING MARKET, BY STATE, 2021-2030 (USD MILLION)
TABLE 17 FLORIDA PRE-ENGINEERED BUILDING MARKET, BY BUILDING TYPE, 2021-2030 (USD MILLION)
TABLE 18 FLORIDA INDUSTRIAL IN PRE-ENGINEERED BUILDING MARKET, BY TYPE, 2021-2030 (USD MILLION)
TABLE 19 FLORIDA INDUSTRIAL IN PRE-ENGINEERED BUILDING MARKET, BY BUILDING SIZE, 2021-2030 (USD MILLION)
TABLE 20 FLORIDA MANUFACTURING IN PRE-ENGINEERED BUILDING MARKET, BY BUILDING SIZE, 2021-2030 (USD MILLION)
TABLE 21 FLORIDA COMMERCIAL IN PRE-ENGINEERED BUILDING MARKET, BY TYPE, 2021-2030 (USD MILLION)
TABLE 22 FLORIDA PRE-ENGINEERED BUILDING MARKET, BY BUILDING SIZE, 2021-2030 (USD MILLION)
TABLE 23 FLORIDA PRE-ENGINEERED BUILDING MARKET, BY CONSTRUCTION MATERIAL, 2021-2030 (USD MILLION)
TABLE 24 NORTH CAROLINA PRE-ENGINEERED BUILDING MARKET, BY BUILDING TYPE, 2021-2030 (USD MILLION)
TABLE 25 NORTH CAROLINA INDUSTRIAL IN PRE-ENGINEERED BUILDING MARKET, BY TYPE, 2021-2030 (USD MILLION)
TABLE 26 NORTH CAROLINA INDUSTRIAL IN PRE-ENGINEERED BUILDING MARKET, BY BUILDING SIZE, 2021-2030 (USD MILLION)
TABLE 27 NORTH CAROLINA MANUFACTURING IN PRE-ENGINEERED BUILDING MARKET, BY BUILDING SIZE, 2021-2030 (USD MILLION)
TABLE 28 NORTH CAROLINA COMMERCIAL IN PRE-ENGINEERED BUILDING MARKET, BY TYPE, 2021-2030 (USD MILLION)
TABLE 29 NORTH CAROLINA PRE-ENGINEERED BUILDING MARKET, BY BUILDING SIZE, 2021-2030 (USD MILLION)
TABLE 30 NORTH CAROLINA PRE-ENGINEERED BUILDING MARKET, BY CONSTRUCTION MATERIAL, 2021-2030 (USD MILLION)
TABLE 31 GEORGIA PRE-ENGINEERED BUILDING MARKET, BY BUILDING TYPE, 2021-2030 (USD MILLION)
TABLE 32 GEORGIA INDUSTRIAL IN PRE-ENGINEERED BUILDING MARKET, BY TYPE, 2021-2030 (USD MILLION)
TABLE 33 GEORGIA INDUSTRIAL IN PRE-ENGINEERED BUILDING MARKET, BY BUILDING SIZE, 2021-2030 (USD MILLION)
TABLE 34 GEORGIA MANUFACTURING IN PRE-ENGINEERED BUILDING MARKET, BY BUILDING SIZE, 2021-2030 (USD MILLION)
TABLE 35 GEORGIA COMMERCIAL IN PRE-ENGINEERED BUILDING MARKET, BY TYPE, 2021-2030 (USD MILLION)
TABLE 36 GEORGIA PRE-ENGINEERED BUILDING MARKET, BY BUILDING SIZE, 2021-2030 (USD MILLION)
TABLE 37 GEORGIA PRE-ENGINEERED BUILDING MARKET, BY CONSTRUCTION MATERIAL, 2021-2030 (USD MILLION)
TABLE 38 VIRGINIA PRE-ENGINEERED BUILDING MARKET, BY BUILDING TYPE, 2021-2030 (USD MILLION)
TABLE 39 VIRGINIA INDUSTRIAL IN PRE-ENGINEERED BUILDING MARKET, BY TYPE, 2021-2030 (USD MILLION)
TABLE 40 VIRGINIA INDUSTRIAL IN PRE-ENGINEERED BUILDING MARKET, BY BUILDING SIZE, 2021-2030 (USD MILLION)
TABLE 41 VIRGINIA MANUFACTURING IN PRE-ENGINEERED BUILDING MARKET, BY BUILDING SIZE, 2021-2030 (USD MILLION)
TABLE 42 VIRGINIA COMMERCIAL IN PRE-ENGINEERED BUILDING MARKET, BY TYPE, 2021-2030 (USD MILLION)
TABLE 43 VIRGINIA PRE-ENGINEERED BUILDING MARKET, BY BUILDING SIZE, 2021-2030 (USD MILLION)
TABLE 44 VIRGINIA PRE-ENGINEERED BUILDING MARKET, BY CONSTRUCTION MATERIAL, 2021-2030 (USD MILLION)
TABLE 45 TENNESSEE PRE-ENGINEERED BUILDING MARKET, BY BUILDING TYPE, 2021-2030 (USD MILLION)
TABLE 46 TENNESSEE INDUSTRIAL IN PRE-ENGINEERED BUILDING MARKET, BY TYPE, 2021-2030 (USD MILLION)
TABLE 47 TENNESSEE INDUSTRIAL IN PRE-ENGINEERED BUILDING MARKET, BY BUILDING SIZE, 2021-2030 (USD MILLION)
TABLE 48 TENNESSEE MANUFACTURING IN PRE-ENGINEERED BUILDING MARKET, BY BUILDING SIZE, 2021-2030 (USD MILLION)
TABLE 49 TENNESSEE COMMERCIAL IN PRE-ENGINEERED BUILDING MARKET, BY TYPE, 2021-2030 (USD MILLION)
TABLE 50 TENNESSEE PRE-ENGINEERED BUILDING MARKET, BY BUILDING SIZE, 2021-2030 (USD MILLION)
TABLE 51 TENNESSEE PRE-ENGINEERED BUILDING MARKET, BY CONSTRUCTION MATERIAL, 2021-2030 (USD MILLION)
TABLE 52 SOUTH CAROLINA PRE-ENGINEERED BUILDING MARKET, BY BUILDING TYPE, 2021-2030 (USD MILLION)
TABLE 53 SOUTH CAROLINA INDUSTRIAL IN PRE-ENGINEERED BUILDING MARKET, BY TYPE, 2021-2030 (USD MILLION)
TABLE 54 SOUTH CAROLINA INDUSTRIAL IN PRE-ENGINEERED BUILDING MARKET, BY BUILDING SIZE, 2021-2030 (USD MILLION)
TABLE 55 SOUTH CAROLINA MANUFACTURING IN PRE-ENGINEERED BUILDING MARKET, BY BUILDING SIZE, 2021-2030 (USD MILLION)
TABLE 56 SOUTH CAROLINA COMMERCIAL IN PRE-ENGINEERED BUILDING MARKET, BY TYPE, 2021-2030 (USD MILLION)
TABLE 57 SOUTH CAROLINA PRE-ENGINEERED BUILDING MARKET, BY BUILDING SIZE, 2021-2030 (USD MILLION)
TABLE 58 SOUTH CAROLINA PRE-ENGINEERED BUILDING MARKET, BY CONSTRUCTION MATERIAL, 2021-2030 (USD MILLION)
TABLE 59 LOUISIANA PRE-ENGINEERED BUILDING MARKET, BY BUILDING TYPE, 2021-2030 (USD MILLION)
TABLE 60 LOUISIANA INDUSTRIAL IN PRE-ENGINEERED BUILDING MARKET, BY TYPE, 2021-2030 (USD MILLION)
TABLE 61 LOUISIANA INDUSTRIAL IN PRE-ENGINEERED BUILDING MARKET, BY BUILDING SIZE, 2021-2030 (USD MILLION)
TABLE 62 LOUISIANA MANUFACTURING IN PRE-ENGINEERED BUILDING MARKET, BY BUILDING SIZE, 2021-2030 (USD MILLION)
TABLE 63 LOUISIANA COMMERCIAL IN PRE-ENGINEERED BUILDING MARKET, BY TYPE, 2021-2030 (USD MILLION)
TABLE 64 LOUISIANA PRE-ENGINEERED BUILDING MARKET, BY BUILDING SIZE, 2021-2030 (USD MILLION)
TABLE 65 LOUISIANA PRE-ENGINEERED BUILDING MARKET, BY CONSTRUCTION MATERIAL, 2021-2030 (USD MILLION)
TABLE 66 ALABAMA PRE-ENGINEERED BUILDING MARKET, BY BUILDING TYPE, 2021-2030 (USD MILLION)
TABLE 67 ALABAMA INDUSTRIAL IN PRE-ENGINEERED BUILDING MARKET, BY TYPE, 2021-2030 (USD MILLION)
TABLE 68 ALABAMA INDUSTRIAL IN PRE-ENGINEERED BUILDING MARKET, BY BUILDING SIZE, 2021-2030 (USD MILLION)
TABLE 69 ALABAMA MANUFACTURING IN PRE-ENGINEERED BUILDING MARKET, BY BUILDING SIZE, 2021-2030 (USD MILLION)
TABLE 70 ALABAMA COMMERCIAL IN PRE-ENGINEERED BUILDING MARKET, BY TYPE, 2021-2030 (USD MILLION)
TABLE 71 ALABAMA PRE-ENGINEERED BUILDING MARKET, BY BUILDING SIZE, 2021-2030 (USD MILLION)
TABLE 72 ALABAMA PRE-ENGINEERED BUILDING MARKET, BY CONSTRUCTION MATERIAL, 2021-2030 (USD MILLION)
TABLE 73 MISSISSIPPI PRE-ENGINEERED BUILDING MARKET, BY BUILDING TYPE, 2021-2030 (USD MILLION)
TABLE 74 MISSISSIPPI INDUSTRIAL IN PRE-ENGINEERED BUILDING MARKET, BY TYPE, 2021-2030 (USD MILLION)
TABLE 75 MISSISSIPPI INDUSTRIAL IN PRE-ENGINEERED BUILDING MARKET, BY BUILDING SIZE, 2021-2030 (USD MILLION)
TABLE 76 MISSISSIPPI MANUFACTURING IN PRE-ENGINEERED BUILDING MARKET, BY BUILDING SIZE, 2021-2030 (USD MILLION)
TABLE 77 MISSISSIPPI COMMERCIAL IN PRE-ENGINEERED BUILDING MARKET, BY TYPE, 2021-2030 (USD MILLION)
TABLE 78 MISSISSIPPI PRE-ENGINEERED BUILDING MARKET, BY BUILDING SIZE, 2021-2030 (USD MILLION)
TABLE 79 MISSISSIPPI PRE-ENGINEERED BUILDING MARKET, BY CONSTRUCTION MATERIAL, 2021-2030 (USD MILLION)
TABLE 80 WEST VIRGINIA PRE-ENGINEERED BUILDING MARKET, BY BUILDING TYPE, 2021-2030 (USD MILLION)
TABLE 81 WEST VIRGINIA INDUSTRIAL IN PRE-ENGINEERED BUILDING MARKET, BY TYPE, 2021-2030 (USD MILLION)
TABLE 82 WEST VIRGINIA INDUSTRIAL IN PRE-ENGINEERED BUILDING MARKET, BY BUILDING SIZE, 2021-2030 (USD MILLION)
TABLE 83 WEST VIRGINIA MANUFACTURING IN PRE-ENGINEERED BUILDING MARKET, BY BUILDING SIZE, 2021-2030 (USD MILLION)
TABLE 84 WEST VIRGINIA COMMERCIAL IN PRE-ENGINEERED BUILDING MARKET, BY TYPE, 2021-2030 (USD MILLION)
TABLE 85 WEST VIRGINIA PRE-ENGINEERED BUILDING MARKET, BY BUILDING SIZE, 2021-2030 (USD MILLION)
TABLE 86 WEST VIRGINIA PRE-ENGINEERED BUILDING MARKET, BY CONSTRUCTION MATERIAL, 2021-2030 (USD MILLION)
TABLE 87 ROCKY MOUNTAINS PRE-ENGINEERED BUILDING MARKET, BY STATE, 2021-2030 (USD MILLION)
TABLE 88 COLORADO PRE-ENGINEERED BUILDING MARKET, BY BUILDING TYPE, 2021-2030 (USD MILLION)
TABLE 89 COLORADO INDUSTRIAL IN PRE-ENGINEERED BUILDING MARKET, BY TYPE, 2021-2030 (USD MILLION)
TABLE 90 COLORADO INDUSTRIAL IN PRE-ENGINEERED BUILDING MARKET, BY BUILDING SIZE, 2021-2030 (USD MILLION)
TABLE 91 COLORADO MANUFACTURING IN PRE-ENGINEERED BUILDING MARKET, BY BUILDING SIZE, 2021-2030 (USD MILLION)
TABLE 92 COLORADO COMMERCIAL IN PRE-ENGINEERED BUILDING MARKET, BY TYPE, 2021-2030 (USD MILLION)
TABLE 93 COLORADO PRE-ENGINEERED BUILDING MARKET, BY BUILDING SIZE, 2021-2030 (USD MILLION)
TABLE 94 COLORADO PRE-ENGINEERED BUILDING MARKET, BY CONSTRUCTION MATERIAL, 2021-2030 (USD MILLION)
TABLE 95 UTAH PRE-ENGINEERED BUILDING MARKET, BY BUILDING TYPE, 2021-2030 (USD MILLION)
TABLE 96 UTAH INDUSTRIAL IN PRE-ENGINEERED BUILDING MARKET, BY TYPE, 2021-2030 (USD MILLION)
TABLE 97 UTAH INDUSTRIAL IN PRE-ENGINEERED BUILDING MARKET, BY BUILDING SIZE, 2021-2030 (USD MILLION)
TABLE 98 UTAH MANUFACTURING IN PRE-ENGINEERED BUILDING MARKET, BY BUILDING SIZE, 2021-2030 (USD MILLION)
TABLE 99 UTAH COMMERCIAL IN PRE-ENGINEERED BUILDING MARKET, BY TYPE, 2021-2030 (USD MILLION)
TABLE 100 UTAH PRE-ENGINEERED BUILDING MARKET, BY BUILDING SIZE, 2021-2030 (USD MILLION)
TABLE 101 UTAH PRE-ENGINEERED BUILDING MARKET, BY CONSTRUCTION MATERIAL, 2021-2030 (USD MILLION)
TABLE 102 MONTANA PRE-ENGINEERED BUILDING MARKET, BY BUILDING TYPE, 2021-2030 (USD MILLION)
TABLE 103 MONTANA INDUSTRIAL IN PRE-ENGINEERED BUILDING MARKET, BY TYPE, 2021-2030 (USD MILLION)
TABLE 104 MONTANA INDUSTRIAL IN PRE-ENGINEERED BUILDING MARKET, BY BUILDING SIZE, 2021-2030 (USD MILLION)
TABLE 105 MONTANA MANUFACTURING IN PRE-ENGINEERED BUILDING MARKET, BY BUILDING SIZE, 2021-2030 (USD MILLION)
TABLE 106 MONTANA COMMERCIAL IN PRE-ENGINEERED BUILDING MARKET, BY TYPE, 2021-2030 (USD MILLION)
TABLE 107 MONTANA PRE-ENGINEERED BUILDING MARKET, BY BUILDING SIZE, 2021-2030 (USD MILLION)
TABLE 108 MONTANA PRE-ENGINEERED BUILDING MARKET, BY CONSTRUCTION MATERIAL, 2021-2030 (USD MILLION)
TABLE 109 WYOMING PRE-ENGINEERED BUILDING MARKET, BY BUILDING TYPE, 2021-2030 (USD MILLION)
TABLE 110 WYOMING INDUSTRIAL IN PRE-ENGINEERED BUILDING MARKET, BY TYPE, 2021-2030 (USD MILLION)
TABLE 111 WYOMING INDUSTRIAL IN PRE-ENGINEERED BUILDING MARKET, BY BUILDING SIZE, 2021-2030 (USD MILLION)
TABLE 112 WYOMING MANUFACTURING IN PRE-ENGINEERED BUILDING MARKET, BY BUILDING SIZE, 2021-2030 (USD MILLION)
TABLE 113 WYOMING COMMERCIAL IN PRE-ENGINEERED BUILDING MARKET, BY TYPE, 2021-2030 (USD MILLION)
TABLE 114 WYOMING PRE-ENGINEERED BUILDING MARKET, BY BUILDING SIZE, 2021-2030 (USD MILLION)
TABLE 115 WYOMING PRE-ENGINEERED BUILDING MARKET, BY CONSTRUCTION MATERIAL, 2021-2030 (USD MILLION)
TABLE 116 IDAHO PRE-ENGINEERED BUILDING MARKET, BY BUILDING TYPE, 2021-2030 (USD MILLION)
TABLE 117 IDAHO INDUSTRIAL IN PRE-ENGINEERED BUILDING MARKET, BY TYPE, 2021-2030 (USD MILLION)
TABLE 118 IDAHO INDUSTRIAL IN PRE-ENGINEERED BUILDING MARKET, BY BUILDING SIZE, 2021-2030 (USD MILLION)
TABLE 119 IDAHO MANUFACTURING IN PRE-ENGINEERED BUILDING MARKET, BY BUILDING SIZE, 2021-2030 (USD MILLION)
TABLE 120 IDAHO COMMERCIAL IN PRE-ENGINEERED BUILDING MARKET, BY TYPE, 2021-2030 (USD MILLION)
TABLE 121 IDAHO PRE-ENGINEERED BUILDING MARKET, BY BUILDING SIZE, 2021-2030 (USD MILLION)
TABLE 122 IDAHO PRE-ENGINEERED BUILDING MARKET, BY CONSTRUCTION MATERIAL, 2021-2030 (USD MILLION)
TABLE 123 NEW MEXICO PRE-ENGINEERED BUILDING MARKET, BY BUILDING TYPE, 2021-2030 (USD MILLION)
TABLE 124 NEW MEXICO INDUSTRIAL IN PRE-ENGINEERED BUILDING MARKET, BY TYPE, 2021-2030 (USD MILLION)
TABLE 125 NEW MEXICO INDUSTRIAL IN PRE-ENGINEERED BUILDING MARKET, BY BUILDING SIZE, 2021-2030 (USD MILLION)
TABLE 126 NEW MEXICO MANUFACTURING IN PRE-ENGINEERED BUILDING MARKET, BY BUILDING SIZE, 2021-2030 (USD MILLION)
TABLE 127 NEW MEXICO COMMERCIAL IN PRE-ENGINEERED BUILDING MARKET, BY TYPE, 2021-2030 (USD MILLION)
TABLE 128 NEW MEXICO PRE-ENGINEERED BUILDING MARKET, BY BUILDING SIZE, 2021-2030 (USD MILLION)
TABLE 129 NEW MEXICO PRE-ENGINEERED BUILDING MARKET, BY CONSTRUCTION MATERIAL, 2021-2030 (USD MILLION)
List of Figure
FIGURE 1 SOUTH EAST AND ROCKY MOUNTAINS PRE-ENGINEERED BUILDING MARKET: SEGMENTATION
FIGURE 2 SOUTH EAST AND ROCKY MOUNTAINS PRE-ENGINEERED BUILDING MARKET: DATA TRIANGULATION
FIGURE 3 SOUTH EAST AND ROCKY MOUNTAINS PRE-ENGINEERED BUILDING MARKET: DROC ANALYSIS
FIGURE 4 SOUTH EAST PRE-ENGINEERED BUILDING MARKET: REGIONAL VS STATE MARKET ANALYSIS
FIGURE 5 ROCKY MOUNTAINS PRE-ENGINEERED BUILDING MARKET: REGIONAL VS STATE MARKET ANALYSIS
FIGURE 6 SOUTH EAST AND ROCKY MOUNTAINS PRE-ENGINEERED BUILDING MARKET: COMPANY RESEARCH ANALYSIS
FIGURE 7 SOUTH EAST AND ROCKY MOUNTAINS PRE-ENGINEERED BUILDING MARKET: MULTIVARIATE MODELLING
FIGURE 8 SOUTH EAST AND ROCKY MOUNTAINS PRE-ENGINEERED BUILDING MARKET: INTERVIEW DEMOGRAPHICS
FIGURE 9 SOUTH EAST AND ROCKY MOUNTAINS PRE-ENGINEERED BUILDING MARKET: DBMR MARKET POSITION GRID
FIGURE 10 SOUTH EAST AND ROCKY MOUNTAINS PRE-ENGINEERED BUILDING MARKET: SEGMENTATION
FIGURE 11 INCREASINGLY BECOMING PIVOTAL FACTORS IN THE CONSTRUCTION INDUSTRY, COST-EFFECTIVENESS AND TIME EFFICIENCY ARE GAINING PROMINENCE IS EXPECTED TO DRIVE THE GROWTH OF THE SOUTH EAST PRE-ENGINEERED BUILDING MARKET IN THE FORECAST PERIOD FROM 2023 TO 2030
FIGURE 12 SWIFT CHANGES IN URBAN DEVELOPMENT AND INDUSTRIAL GROWTH ARE UNDERGOING A RAPID TRANSFORMATION IS EXPECTED TO DRIVE THE GROWTH OF THE ROCKY MOUNTAINS PRE-ENGINEERED BUILDING MARKET IN THE FORECAST PERIOD FROM 2023 TO 2030
FIGURE 13 THE INDUSTRIAL SEGMENT IS EXPECTED TO ACCOUNT FOR THE LARGEST SHARE OF THE SOUTH EAST PRE-ENGINEERED BUILDING MARKET IN 2023 AND 2030
FIGURE 14 THE INDUSTRIAL SEGMENT IS EXPECTED TO ACCOUNT FOR THE LARGEST SHARE OF THE ROCKY MOUNTAINS PRE-ENGINEERED BUILDING MARKET IN 2023 AND 2030
FIGURE 15 DRIVERS, RESTRAINTS, OPPORTUNITIES, AND CHALLENGES OF THE SOUTH EAST AND ROCKY MOUNTAINS PRE-ENGINEERED BUILDING MARKET
FIGURE 16 SOUTH EAST PRE-ENGINEERED BUILDING MARKET: BY BUILDING SIZE, 2022
FIGURE 17 ROCKY MOUNTAINS PRE-ENGINEERED BUILDING MARKET: BY BUILDING SIZE, 2022
FIGURE 18 SOUTH EAST PRE-ENGINEERED BUILDING MARKET: BY BUILDING TYPE, 2022
FIGURE 19 ROCKY MOUNTAINS PRE-ENGINEERED BUILDING MARKET: BY BUILDING TYPE, 2022
FIGURE 20 SOUTH EAST PRE-ENGINEERED BUILDING MARKET: BY CONSTRUCTION MATERIALS, 2022
FIGURE 21 ROCKY MOUNTAINS PRE-ENGINEERED BUILDING MARKET: BY CONSTRUCTION MATERIAL, 2022
FIGURE 22 SOUTH EAST PRE-ENGINEERED BUILDING MARKET: COMPANY SHARE 2022 (%)
FIGURE 23 ROCKY MOUNTAINS PRE-ENGINEERED BUILDING MARKET: COMPANY SHARE 2022 (%)
South East And Rocky Mountains Pre Engineered Building Market, Supply Chain Analysis and Ecosystem Framework
To support market growth and help clients navigate the impact of geopolitical shifts, DBMR has integrated in-depth supply chain analysis into its South East And Rocky Mountains Pre Engineered Building Market research reports. This addition empowers clients to respond effectively to global changes affecting their industries. The supply chain analysis section includes detailed insights such as South East And Rocky Mountains Pre Engineered Building Market consumption and production by country, price trend analysis, the impact of tariffs and geopolitical developments, and import and export trends by country and HSN code. It also highlights major suppliers with data on production capacity and company profiles, as well as key importers and exporters. In addition to research, DBMR offers specialized supply chain consulting services backed by over a decade of experience, providing solutions like supplier discovery, supplier risk assessment, price trend analysis, impact evaluation of inflation and trade route changes, and comprehensive market trend analysis.
Data collection and base year analysis are done using data collection modules with large sample sizes. The stage includes obtaining market information or related data through various sources and strategies. It includes examining and planning all the data acquired from the past in advance. It likewise envelops the examination of information inconsistencies seen across different information sources. The market data is analysed and estimated using market statistical and coherent models. Also, market share analysis and key trend analysis are the major success factors in the market report. To know more, please request an analyst call or drop down your inquiry.
The key research methodology used by DBMR research team is data triangulation which involves data mining, analysis of the impact of data variables on the market and primary (industry expert) validation. Data models include Vendor Positioning Grid, Market Time Line Analysis, Market Overview and Guide, Company Positioning Grid, Patent Analysis, Pricing Analysis, Company Market Share Analysis, Standards of Measurement, Global versus Regional and Vendor Share Analysis. To know more about the research methodology, drop in an inquiry to speak to our industry experts.
Data Bridge Market Research is a leader in advanced formative research. We take pride in servicing our existing and new customers with data and analysis that match and suits their goal. The report can be customized to include price trend analysis of target brands understanding the market for additional countries (ask for the list of countries), clinical trial results data, literature review, refurbished market and product base analysis. Market analysis of target competitors can be analyzed from technology-based analysis to market portfolio strategies. We can add as many competitors that you require data about in the format and data style you are looking for. Our team of analysts can also provide you data in crude raw excel files pivot tables (Fact book) or can assist you in creating presentations from the data sets available in the report.


