
Southeast Asia Liquid Gases Market Analysis and Size
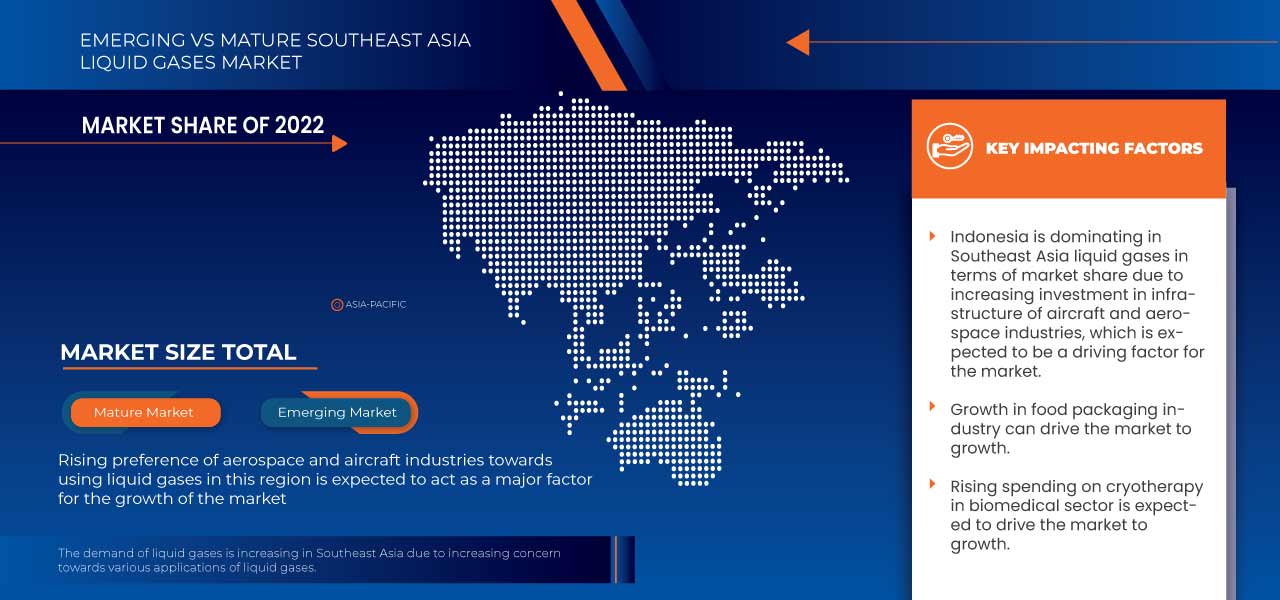
Southeast Asia liquid gases market is expected to grow significantly in the forecast period of 2023 to 2030. Data Bridge Market Research analyses that the market is growing with a CAGR of 7.1% in the forecast period of 2023 to 2030 and is expected to reach USD 5,042,237.33 thousand by 2030. The major factor driving the growth of the liquid gases market is the rising demand of fresh packaged products between the consumers, and growing awareness regarding the properties of the liquid gases products.
|
Report Metric |
Details |
|
Forecast Period |
2023 to 2030 |
|
Base Year |
2022 |
|
Historic Years |
2021 (Customizable to 2020 - 2015) |
|
Quantitative Units |
Revenue in USD Thousand |
|
Segments Covered |
By Type (Liquid Nitrogen, Liquid Oxygen, Liquid Argon). |
|
Countries Covered |
Cambodia, Myanmar, Malaysia, Thailand, Vietnam, Indonesia, Philippines, Singapore |
|
Market Players Covered |
Air Liquide, Bangkok Industrial Gas Co., Ltd., AMCS Corporation, Linde PLC, Air Products and Chemicals, Inc., MESSER, Asia Industrial Gases Pte. Ltd., NIPPON SHOKUBAI CO., LTD., SASOL, SABIC. |
Market Definition
Liquid gases are gases that have been turned into liquid by cooling or compressing it. It is done usually for storage and transport purposes. Liquid gases are widely used in various industries, which include food and beverages, aerospace and defense industry, chemical industry, welding and cutting, and medical. The driving factor for the growth of the Market is rise in demand for liquid gases in the food packaging industry.
Southeast Asia Liquid Gases Market Dynamics
Drivers
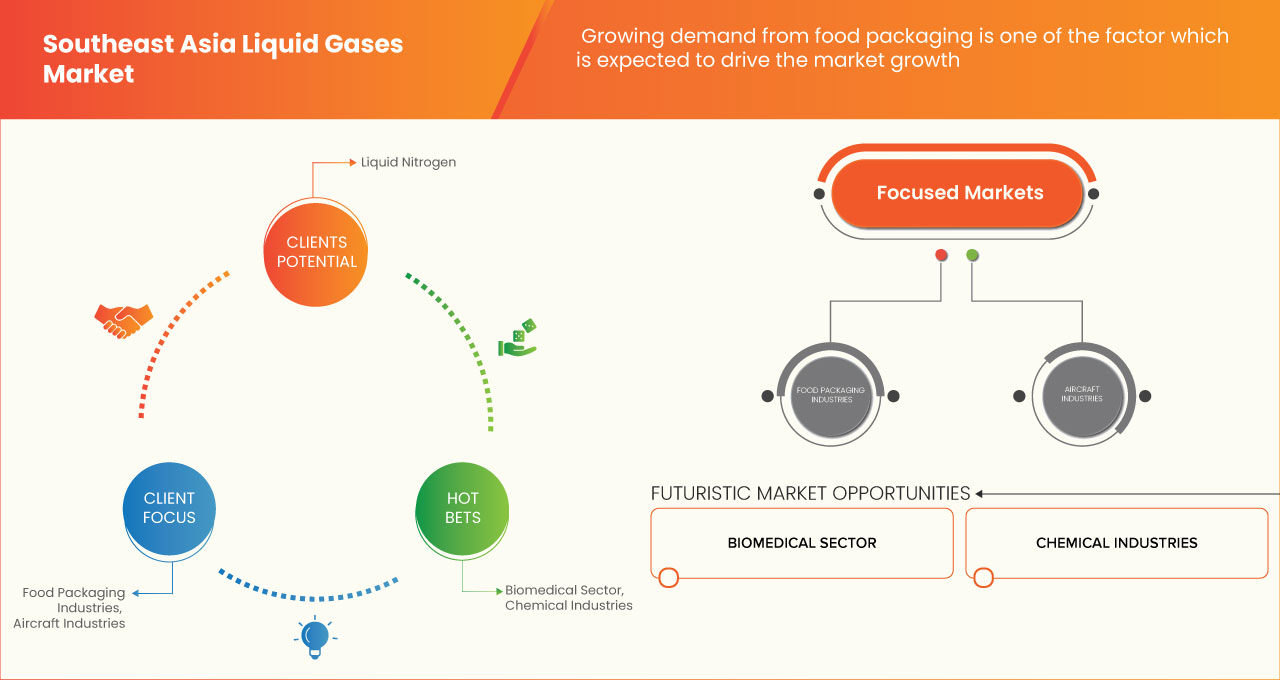
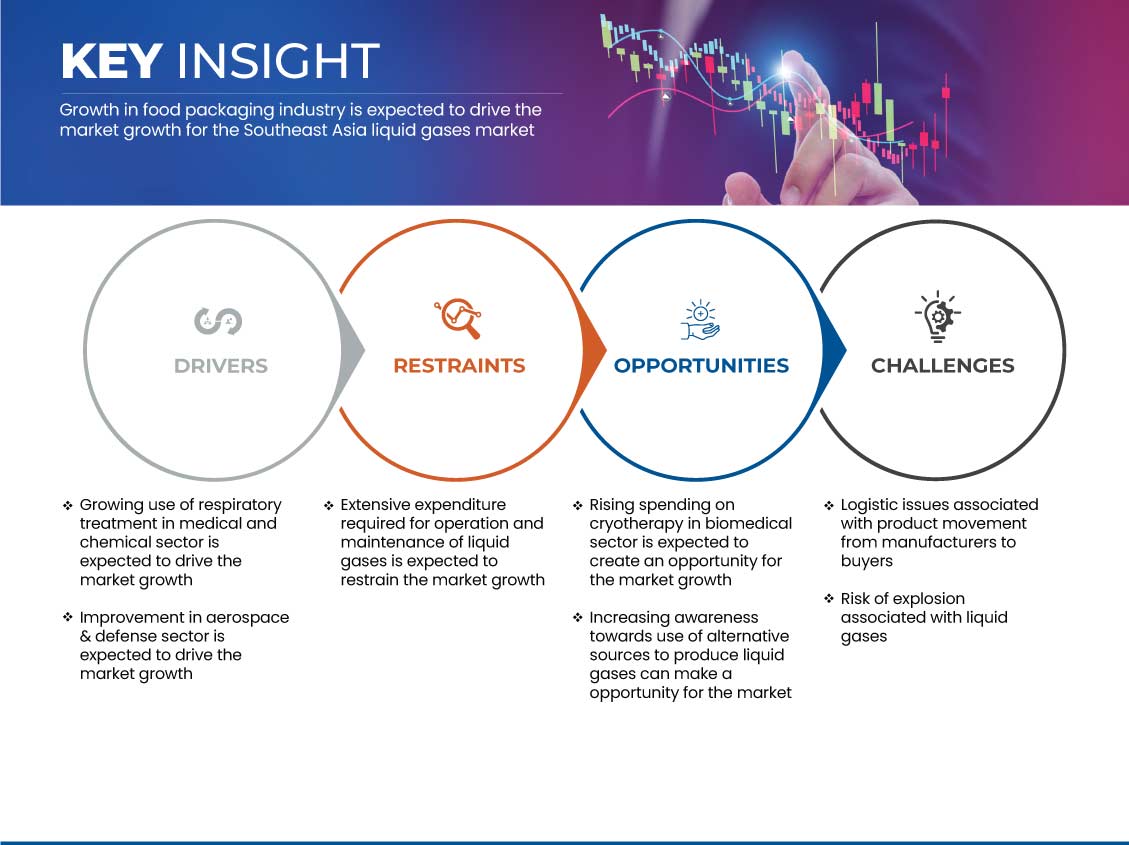
- Growth in the food packaging industry
Rising consumer demand for packaged products due to shifting eating habits and evolving lifestyles and a rise in per capita disposable income, and growing population aid in the product demand owing to high barrier properties, shelf life, and consumer safety has led to the growth in the food packaging industry. The surge in demand for packaged food is due to various reasons such as barrier and contamination protection, promoting sustainable packaging, and reducing safety issues by preventing food-borne diseases, and preserving food quality.
- Growing use of respiratory treatment in the medical sector
Oxygen is vital for respiration, transferring energy from glucose to cells. Every cell in our body requires oxygen. Oxygen is crucial for treating severe respiratory issues as it hampers oxygen supply to various body parts. Then oxygen therapy came into role play which is supplied through medical oxygen. Oxygen therapy is a treatment that delivers extra oxygen to the lungs when the level of oxygen in the blood is too low. Many diseases, especially lung diseases, decrease the amount of oxygen in the bloodstream. In such cases, people may benefit from being given extra oxygen. In a Liquid oxygen system, oxygen is stored as a very cold liquid. In liquid form, much more oxygen can be stored as a liquid than as a gas, so a given size of container can hold much more liquid oxygen. As the liquid oxygen is released, it turns into a gas, and the person can breathe it in. Hyperbaric oxygen therapy (HBOT) uses a special pressurized chamber to deliver 100%pure oxygen to your lungs. Increased air pressure inside the chamber helps your lungs absorb more oxygen. This extra oxygen can aid in healing the infections
- Improvement in the aerospace and defense sector
The aerospace and defence sector is rapidly adopting newer technologies to address the challenges of shrinking budgets, rising operational cost, infrastructure management, MRO (Maintenance, Repair and Overhaul) and a complex global supply chain.
Aerospace industry encompasses research and development, design and manufacturing that makes flight and space exploration possible. A continuous focus on safety is crucial for the aerospace industry. These include using inert gases such as Nitrogen and argon to create safe atmospheres for maintenance operations, extend life, and improve the performance of aircraft parts. High performance gas analyzers help aerospace manufacturers, airlines, and the military monitor and control the quality of their gases by continuously monitoring for trace oxygen in the inert gases
Opportunities
- Rising spending on cryotherapy in the biomedical sector
Cryotherapy is a treatment where your healthcare provider applies extreme cold to freeze and destroy abnormal tissue. Liquid Nitrogen is used to create this severe cold. Cryotherapy is used to treat a variety of skin conditions and cancers, including prostate and liver cancer. This treatment is also known as cryoablation. Cryotherapy uses cryogen, typically liquid Nitrogen, to cool the targeted tissue to subzero temperatures. This effect induces tissue damage in two mechanisms. The first mechanism is the induction of tissue ischemia by damaging blood vessels and capillaries within the target area, leading to ischemic tissue necrosis. The second mechanism involves damaging the cells more complexly by forming ice crystals and inducing osmotic cell injury and cellular membrane disruption. As it is a non-invasive technique, cryotheraphy can produce the best outcomes.
Restraint/Challenges
- Extensive expenditure is required for the operation and maintenance of liquid gases
Liquid gases are manufactured to fulfill the requirement of various sectors such as chemicals, food & vegetables, dairy, aerospace, gas industries, medical sectors, and others. Most liquid gases are used in insulation, illumination, cooling, and refrigerant, among others. Liquid gases such as nitrogen, oxygen, and argon are intended for application in a wide range. However, despite a wide preference and applications of liquid gases, few significant issues associated with security is present in liquid gases. To handle these issues, some extra measures are also present which must be taken while using liquid gases. These additional measures can restrain the growth of liquid gases in the Southeast Asia region's market because precautionary measures demand extensive expenditure.
- Logistic issues associated with product movement from manufacturers to buyers
Most of the market is in a supply chain crisis caused by the epidemic. Every market is facing significant struggles in logistics associated with product movement. Southeast Asia liquid gases market is no exception. The epidemic has caused an issue associated with global shipping. There is demand outstripping the supply. Thus sea freight prices are at an all-time high, and container capacity is extremely limited for supplying the liquid gases, especially for the liquid oxygen used in the medical sectors. Unfortunately, there is no quick answer, and high shipping charges, lengthier lead times, and capacity bottlenecks will remain a challenge for the Southeast Asia liquid gases market.
Recent Development
- In January 2023, Linde Plc has acquired the remaining portion of the nexAir, LLC as linde has held a minority interest in nex air since 2012. Now they have purchased the remaining 77.2%. portion of the nexAir. It helped the company to expand its business network and further strengthening presence in the southeastern U.S.
Southeast Asia Liquid Gases Market Scope
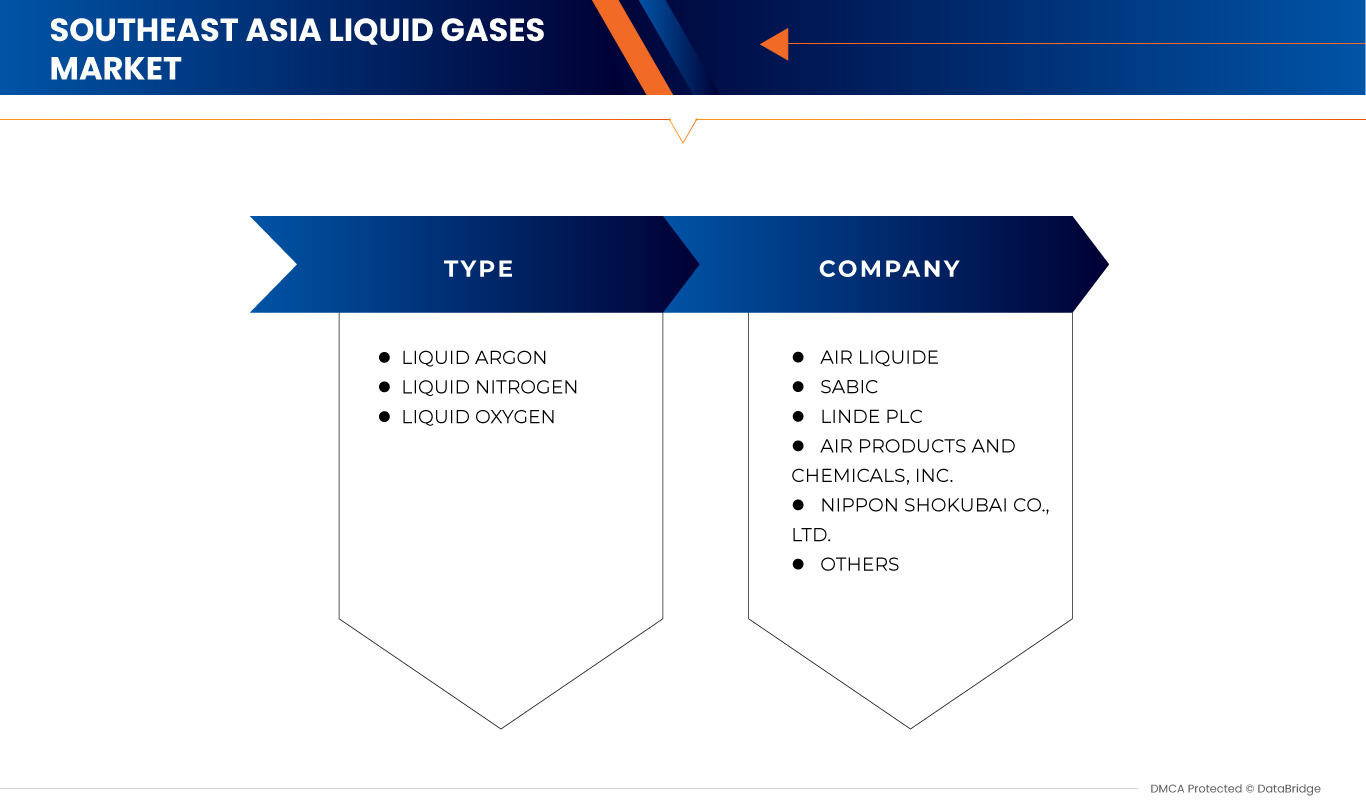
The Southeast Asia liquid gases market is categorized based on type.
Type
- Liquid Nitrogen
- Liquid Oxygen
- Liquid Argon
On the basis of type, the Southeast Asia liquid gases market is classified into three segments liquid nitrogen, liquid oxygen and liquid.
Southeast Asia Liquid Gases Market Regional Analysis/Insights
The Southeast Asia liquid gases market is segmented on the basis of type.
The countries in the Southeast Asia liquid gases market are the Cambodia, Myanmar, Malaysia, Thailand, Vietnam, Indonesia, Philippines, and Singapore.
Indonesia is expected to dominate the Southeast Asia liquid gases market due to growing investment in the medical and chemical industry.
The country section of the report also provides individual market-impacting factors and changes in market regulation that impact the current and future trends of the market. Data point downstream and upstream value chain analysis, technical trends porter's five forces analysis, and case studies are some of the pointers used to forecast the market scenario for individual countries. Also, the presence and availability of Southeast Asia brands and their challenges faced due to large or scarce competition from local and domestic brands, the impact of domestic tariffs, and trade routes are considered while providing forecast analysis of the country data.
Competitive Landscape and Southeast Asia Liquid Gases Market Share Analysis
The Southeast Asia liquid gases market competitive landscape provides details by competitors. Details included are company overview, company financials, revenue generated, market potential, investment in research and development, new market initiatives, production sites and facilities, company strengths and weaknesses, product launch, product trials pipelines, product approvals, patents, product width and breadth, application dominance, technology lifeline curve. The above data points provided are only related to the companies’ focus related to the Southeast Asia liquid gases market.
Some of the major players operating in the Southeast Asia liquid gases market are Air Liquide, Bangkok Industrial Gas Co., Ltd., AMCS Corporation, Linde plc, Air Products and Chemicals, Inc., MESSER, Asia Industrial Gases Pte. Ltd., NIPPON SHOKUBAI CO., LTD., SASOL, SABIC among others.
SKU-

- Interactive Data Analysis Dashboard
- Company Analysis Dashboard for high growth potential opportunities
- Research Analyst Access for customization & queries
- Competitor Analysis with Interactive dashboard
- Latest News, Updates & Trend analysis
- Harness the Power of Benchmark Analysis for Comprehensive Competitor Tracking
Table of Content
1 INTRODUCTION
1.1 OBJECTIVES OF THE STUDY
1.2 MARKET DEFINITION
1.3 OVERVIEW OF SOUTHEAST ASIA LIQUID GASES MARKET
1.4 LIMITATION
1.5 MARKETS COVERED
2 MARKET SEGMENTATION
2.1 MARKETS COVERED
2.2 GEOGRAPHICAL SCOPE
2.3 YEARS CONSIDERED FOR THE STUDY
2.4 CURRENCY AND PRICING
2.5 DBMR TRIPOD DATA VALIDATION MODEL
2.6 MATERIAL LIFE LINE CURVE
2.7 MULTIVARIATE MODELING
2.8 SOUTHEAST ASIA LIQUID GASES MARKET PRODUCT LIFE LINE CURVE
2.9 PRIMARY INTERVIEWS WITH KEY OPINION LEADERS
2.1 DBMR VENDOR POSITIONING GRID
2.11 DBMR MARKET CHALLENGE MATRIX
2.12 DBMR VENDOR SHARE ANALYSIS
2.13 SECONDARY SOURCES
2.14 ASSUMPTIONS
3 EXECUTIVE SUMMARY
4 PREMIUM INSIGHTS
4.1 PESTLE ANALYSIS
4.1.1 POLITICAL FACTORS
4.1.2 ECONOMIC FACTORS
4.1.3 SOCIAL FACTORS
4.1.4 TECHNOLOGICAL FACTORS
4.1.5 LEGAL FACTORS
4.1.6 ENVIRONMENTAL FACTORS
4.2 IMPORT EXPORT SCENARIO
4.3 PRODUCTION CONSUMPTION ANALYSIS
4.4 SUPPLY CHAIN ANALYSIS
4.4.1 OVERVIEW
4.4.2 LOGISTIC COST SCENARIO
4.4.3 IMPORTANCE OF LOGISTICS SERVICE PROVIDERS
5 MARKET OVERVIEW
5.1 DRIVERS
5.1.1 GROWTH IN THE FOOD PACKAGING INDUSTRY
5.1.2 GROWING USE OF RESPIRATORY TREATMENT IN THE MEDICAL SECTOR
5.1.3 IMPROVEMENT IN THE AEROSPACE AND DEFENSE SECTOR
5.2 RESTRAINT
5.2.1 EXTENSIVE EXPENDITURE IS REQUIRED FOR THE OPERATION AND MAINTENANCE OF LIQUID GASES
5.3 OPPORTUNITIES
5.3.1 RISING SPENDING ON CRYOTHERAPY IN THE BIOMEDICAL SECTOR
5.3.2 INCREASING AWARENESS TOWARDS THE USE OF ALTERNATIVE SOURCES TO PRODUCE LIQUID GASES
5.4 CHALLENGES
5.4.1 LOGISTIC ISSUES ASSOCIATED WITH PRODUCT MOVEMENT FROM MANUFACTURERS TO BUYERS
5.4.2 RISK OF EXPLOSION AND OTHER ISSUES ASSOCIATED WITH LIQUID GASES
6 SOUTHEAST ASIA LIQUID GASES MARKET, BY TYPE
6.1 OVERVIEW
6.2 LIQUID ARGON
6.2.1 LIQUID ARGON, BY FUNCTION
6.2.1.1 ILLUMINATION
6.2.1.2 INSULATION
6.2.1.3 COOLING
6.2.2 LIQUID ARGON, BY PURITY GRADE
6.2.2.1 HIGH PURITY GRADE
6.2.2.2 ULTRA-PURE GRADE
6.2.2.3 PURE GRADE
6.2.3 LIQUID ARGON, BY APPLICATION
6.2.3.1 WELDING AND CUTTING
6.2.3.2 SEMICONDUCTOR INDUSTRY
6.2.3.3 PHOTOVOLTAIC INDUSTRY
6.2.3.4 SMELTING
6.2.3.5 OTHERS
6.3 LIQUID NITROGEN
6.3.1 LIQUID NITROGEN, BY FUNCTION
6.3.1.1 REFRIGERANT
6.3.1.2 COOLANT
6.3.2 LIQUID NITROGEN, BY PRODUCTION TECHNOLOGY
6.3.2.1 CRYOGENIC DISTILLATION
6.3.2.2 PRESSURE SWING ADSORPTION
6.3.3 LIQUID NITROGEN, BY STORAGE
6.3.3.1 CRYOGENIC STORAGE TANKS
6.3.3.2 CYLINDERS
6.3.3.3 DEWARS
6.3.4 LIQUID NITROGEN, BY END USE
6.3.4.1 FOOD & BEVERAGES
6.3.4.1.1 PREPACKAGED MEALS
6.3.4.1.2 MEAT, POULTRY & SEAFOOD
6.3.4.1.3 FRUITS & VEGETABLES
6.3.4.1.4 ICE CREAMS
6.3.4.1.5 DAIRY
6.3.4.1.6 BAKED GOODS
6.3.4.1.7 OTHERS
6.3.4.2 CHEMICALS
6.3.4.3 HEALTHCARE
6.3.4.3.1 BIOLOGICAL SAMPLE PRESERVATION
6.3.4.3.2 TISSUE & BLOOD STORAGE
6.3.4.3.3 OTHERS
6.3.4.4 RUBBER & PLASTIC
6.3.4.5 BUILDING & CONSTRUCTION
6.3.4.5.1 COMMERCIAL
6.3.4.5.2 RESIDENTIAL
6.3.4.6 METAL MANUFACTURING
6.3.4.7 OTHERS
6.4 LIQUID OXYGEN
6.4.1 LIQUID OXYGEN, BY STORAGE TANK TYPE
6.4.1.1 VERTICAL TANK STORAGE TYPE
6.4.1.2 HORIZONTAL TANK STORAGE TYPE
6.4.2 LIQUID OXYGEN, BY APPLICATION
6.4.2.1 AEROSPACE
6.4.2.2 GAS INDUSTRIES
6.4.2.3 SUBMARINE
6.4.2.4 MEDICAL
6.4.2.5 OTHERS
7 SOUTHEAST ASIA LIQUID GASES MARKET, BY COUNTRY
7.1 INDONESIA
7.2 THAILAND
7.3 SINGAPORE
7.4 MALAYSIA
7.5 VIETNAM
7.6 PHILIPPINES
7.7 MYANMAR
7.8 CAMBODIA
8 COMPANY SHARE ANALYSIS: SOUTHEAST ASIA
8.1 ACQUISITION
8.2 AWARD
8.3 RECOGNISATION
8.4 PRODUCT LAUNCH
8.5 CONTRACT
8.6 INVESTMENT
8.7 JOINT VENTURE
8.8 SEMINAR
8.9 SUSTAINABLE OPTIMIZATION
9 SWOT ANALYSIS
10 COMPANY PROFILES
10.1 AIR LIQUIDE (2022)
10.1.1 COMPANY SNAPSHOT
10.1.2 REVENUE ANALYSIS
10.1.3 PRODUCT PORTFOLIO
10.1.4 SWOT
10.1.5 RECENT UPDATES
10.2 SABIC (2022)
10.2.1 COMPANY SNAPSHOT
10.2.2 REVENUE ANALYSIS
10.2.3 PRODUCT PORTFOLIO
10.2.4 SWOT
10.2.5 PRODUCTION CAPACITY OVERVIEW
10.2.6 RECENT UPDATES
10.3 LINDE PLC (2022)
10.3.1 COMPANY SNAPSHOT
10.3.2 REVENUE ANALYSIS
10.3.3 PRODUCT PORTFOLIO
10.3.4 SWOT
10.3.5 RECENT UPDATES
10.4 AIR PRODUCTS AND CHEMICALS , INC. (2022)
10.4.1 COMPANY SNAPSHOT
10.4.2 REVENUE ANALYSIS
10.4.3 PRODUCT PORTFOLIO
10.4.4 SWOT
10.4.5 RECENT UPDATE
10.5 NIPPON SHOKUBAI CO., LTD. (2022)
10.5.1 COMPANY SNAPSHOT
10.5.2 REVENUE ANALYSIS
10.5.3 PRODUCT PORTFOLIO
10.5.4 SWOT
10.5.5 RECENT UPDATES
10.6 AMCS CORPORATION
10.6.1 COMPANY SNAPSHOT
10.6.2 PRODUCT PORTFOLIO
10.6.3 SWOT
10.6.4 RECENT UPDATES
10.7 ASIA INDUSTRIAL GASES PTE.LTD.
10.7.1 COMPANY SNAPSHOT
10.7.2 PRODUCT PORTFOLIO
10.7.3 SWOT
10.7.4 RECENT UPDATES
10.8 BANGKOK INDUSTRIAL GAS CO., LTD.
10.8.1 COMPANY SNAPSHOT
10.8.2 PRODUCT PORTFOLIO
10.8.3 SWOT
10.8.4 RECENT UPDATE
10.9 MESSER
10.9.1 COMPANY SNAPSHOT
10.9.2 PRODUCT PORTFOLIO
10.9.3 SWOT
10.9.4 RECENT UPDATES
10.1 SASOL (2022)
10.10.1 COMPANY SNAPSHOT
10.10.2 REVENUE ANALYSIS
10.10.3 PRODUCT PORTFOLIO
10.10.4 SWOT
10.10.5 RECENT UPDATE
11 QUESTIONNAIRE
12 RELATED REPORT
List of Table
TABLE 1 SOUTHEAST ASIA LIQUID GASES MARKET, BY TYPE, 2021-2030 (USD THOUSAND)
TABLE 2 SOUTHEAST ASIA LIQUID GASES MARKET, BY TYPE, 2021-2030 (THOUSAND LITER)
TABLE 3 SOUTHEAST ASIA LIQUID ARGON IN LIQUID GASES MARKET, BY FUNCTION, 2021-2030 (USD THOUSAND)
TABLE 4 SOUTHEAST ASIA LIQUID ARGON IN LIQUID GASES MARKET, BY PURITY GRADE, 2021-2030 (USD THOUSAND)
TABLE 5 SOUTHEAST ASIA LIQUID ARGON IN LIQUID GASES MARKET, BY APPLICATION, 2021-2030 (USD THOUSAND)
TABLE 6 SOUTHEAST ASIA LIQUID NITROGEN IN LIQUID GASES MARKET, BY FUNCTION, 2021-2030 (USD THOUSAND)
TABLE 7 SOUTHEAST ASIA LIQUID NITROGEN IN LIQUID GASES MARKET, BY PRODUCTION TECHNOLOGY, 2021-2030 (USD THOUSAND)
TABLE 8 SOUTHEAST ASIA LIQUID NITROGEN IN LIQUID GASES MARKET, BY STORAGE, 2021-2030 (USD THOUSAND)
TABLE 9 SOUTHEAST ASIA LIQUID NITROGEN IN LIQUID GASES MARKET, BY END USE, 2021-2030 (USD THOUSAND)
TABLE 10 SOUTHEAST ASIA FOOD & BEVERAGES IN LIQUID GASES MARKET, BY TYPE, 2021-2030 (USD THOUSAND)
TABLE 11 SOUTHEAST ASIA HEALTHCARE IN LIQUID GASES MARKET, BY TYPE, 2021-2030 (USD THOUSAND)
TABLE 12 SOUTHEAST ASIA BUILDING & CONSTRUCTION IN LIQUID GASES MARKET, BY TYPE, 2021-2030 (USD THOUSAND)
TABLE 13 SOUTHEAST ASIA LIQUID OXYGEN IN LIQUID GASES MARKET, BY STORAGE TANK TYPE, 2021-2030 (USD THOUSAND)
TABLE 14 SOUTHEAST ASIA LIQUID OXYGEN IN LIQUID GASES MARKET, BY APPLICATION, 2021-2030 (USD THOUSAND)
TABLE 15 SOUTHEAST ASIA LIQUID GASES MARKET, BY COUNTRY, 2021-2030 (USD THOUSAND)
TABLE 16 SOUTHEAST ASIA LIQUID GASES MARKET, BY COUNTRY, 2021-2030 (THOUSAND LITER)
TABLE 17 INDONESIA LIQUID GASES MARKET, BY TYPE, 2021-2030 (USD THOUSAND)
TABLE 18 INDONESIA LIQUID GASES MARKET, BY TYPE, 2021-2030 (THOUSAND LITER)
TABLE 19 INDONESIA LIQUID ARGON IN LIQUID GASES MARKET, BY FUNCTION, 2021-2030 (USD THOUSAND)
TABLE 20 INDONESIA LIQUID ARGON IN LIQUID GASES MARKET, BY PURITY GRADE, 2021-2030 (USD THOUSAND)
TABLE 21 INDONESIA LIQUID ARGON IN LIQUID GASES MARKET, BY APPLICATION, 2021-2030 (USD THOUSAND)
TABLE 22 INDONESIA LIQUID NITROGEN IN LIQUID GASES MARKET, BY FUNCTION, 2021-2030 (USD THOUSAND)
TABLE 23 INDONESIA LIQUID NITROGEN IN LIQUID GASES MARKET, BY PRODUCTION TECHNOLOGY, 2021-2030 (USD THOUSAND)
TABLE 24 INDONESIA LIQUID NITROGEN IN LIQUID GASES MARKET, BY STORAGE, 2021-2030 (USD THOUSAND)
TABLE 25 INDONESIA LIQUID NITROGEN IN LIQUID GASES MARKET, BY END USE, 2021-2030 (USD THOUSAND)
TABLE 26 INDONESIA FOOD & BEVERAGES IN LIQUID GASES MARKET, BY TYPE, 2021-2030 (USD THOUSAND)
TABLE 27 INDONESIA HEALTHCARE IN LIQUID GASES MARKET, BY TYPE, 2021-2030 (USD THOUSAND)
TABLE 28 INDONESIA BUILDING & CONSTRUCTION IN LIQUID GASES MARKET, BY TYPE, 2021-2030 (USD THOUSAND)
TABLE 29 INDONESIA LIQUID OXYGEN IN LIQUID GASES MARKET, BY STORAGE TANK TYPE, 2021-2030 (USD THOUSAND)
TABLE 30 INDONESIA LIQUID OXYGEN IN LIQUID GASES MARKET, BY APPLICATION, 2021-2030 (USD THOUSAND)
TABLE 31 THAILAND LIQUID GASES MARKET, BY TYPE, 2021-2030 (USD THOUSAND)
TABLE 32 THAILAND LIQUID GASES MARKET, BY TYPE, 2021-2030 (THOUSAND LITER)
TABLE 33 THAILAND LIQUID GASES MARKET, BY TYPE, 2021-2030 (PRICE/LITER)
TABLE 34 THAILAND LIQUID ARGON IN LIQUID GASES MARKET, BY FUNCTION, 2021-2030 (USD THOUSAND)
TABLE 35 THAILAND LIQUID ARGON IN LIQUID GASES MARKET, BY PURITY GRADE, 2021-2030 (USD THOUSAND)
TABLE 36 THAILAND LIQUID ARGON IN LIQUID GASES MARKET, BY APPLICATION, 2021-2030 (USD THOUSAND)
TABLE 37 THAILAND LIQUID NITROGEN IN LIQUID GASES MARKET, BY FUNCTION, 2021-2030 (USD THOUSAND)
TABLE 38 THAILAND LIQUID NITROGEN IN LIQUID GASES MARKET, BY PRODUCTION TECHNOLOGY, 2021-2030 (USD THOUSAND)
TABLE 39 THAILAND LIQUID NITROGEN IN LIQUID GASES MARKET, BY STORAGE, 2021-2030 (USD THOUSAND)
TABLE 40 THAILAND LIQUID NITROGEN IN LIQUID GASES MARKET, BY END USE, 2021-2030 (USD THOUSAND)
TABLE 41 THAILAND FOOD & BEVERAGES IN LIQUID GASES MARKET, BY TYPE, 2021-2030 (USD THOUSAND)
TABLE 42 THAILAND HEALTHCARE IN LIQUID GASES MARKET, BY TYPE, 2021-2030 (USD THOUSAND)
TABLE 43 THAILAND BUILDING & CONSTRUCTION IN LIQUID GASES MARKET, BY TYPE, 2021-2030 (USD THOUSAND)
TABLE 44 THAILAND LIQUID OXYGEN IN LIQUID GASES MARKET, BY STORAGE TANK TYPE, 2021-2030 (USD THOUSAND)
TABLE 45 THAILAND LIQUID OXYGEN IN LIQUID GASES MARKET, BY APPLICATION, 2021-2030 (USD THOUSAND)
TABLE 46 SINGAPORE LIQUID GASES MARKET, BY TYPE, 2021-2030 (USD THOUSAND)
TABLE 47 SINGAPORE LIQUID GASES MARKET, BY TYPE, 2021-2030 (THOUSAND LITER)
TABLE 48 SINGAPORE LIQUID GASES MARKET, BY TYPE, 2021-2030 (PRICE/LITER)
TABLE 49 SINGAPORE LIQUID ARGON IN LIQUID GASES MARKET, BY FUNCTION, 2021-2030 (USD THOUSAND)
TABLE 50 SINGAPORE LIQUID ARGON IN LIQUID GASES MARKET, BY PURITY GRADE, 2021-2030 (USD THOUSAND)
TABLE 51 SINGAPORE LIQUID ARGON IN LIQUID GASES MARKET, BY APPLICATION, 2021-2030 (USD THOUSAND)
TABLE 52 SINGAPORE LIQUID NITROGEN IN LIQUID GASES MARKET, BY FUNCTION, 2021-2030 (USD THOUSAND)
TABLE 53 SINGAPORE LIQUID NITROGEN IN LIQUID GASES MARKET, BY PRODUCTION TECHNOLOGY, 2021-2030 (USD THOUSAND)
TABLE 54 SINGAPORE LIQUID NITROGEN IN LIQUID GASES MARKET, BY STORAGE, 2021-2030 (USD THOUSAND)
TABLE 55 SINGAPORE LIQUID NITROGEN IN LIQUID GASES MARKET, BY END USE, 2021-2030 (USD THOUSAND)
TABLE 56 SINGAPORE FOOD & BEVERAGES IN LIQUID GASES MARKET, BY TYPE, 2021-2030 (USD THOUSAND)
TABLE 57 SINGAPORE HEALTHCARE IN LIQUID GASES MARKET, BY TYPE, 2021-2030 (USD THOUSAND)
TABLE 58 SINGAPORE BUILDING & CONSTRUCTION IN LIQUID GASES MARKET, BY TYPE, 2021-2030 (USD THOUSAND)
TABLE 59 SINGAPORE LIQUID OXYGEN IN LIQUID GASES MARKET, BY STORAGE TANK TYPE, 2021-2030 (USD THOUSAND)
TABLE 60 SINGAPORE LIQUID OXYGEN IN LIQUID GASES MARKET, BY APPLICATION, 2021-2030 (USD THOUSAND)
TABLE 61 MALAYSIA LIQUID GASES MARKET, BY TYPE, 2021-2030 (USD THOUSAND)
TABLE 62 MALAYSIA LIQUID GASES MARKET, BY TYPE, 2021-2030 (THOUSAND LITER)
TABLE 63 MALAYSIA LIQUID GASES MARKET, BY TYPE, 2021-2030 (PRICE/LITER)
TABLE 64 MALAYSIA LIQUID ARGON IN LIQUID GASES MARKET, BY FUNCTION, 2021-2030 (USD THOUSAND)
TABLE 65 MALAYSIA LIQUID ARGON IN LIQUID GASES MARKET, BY PURITY GRADE, 2021-2030 (USD THOUSAND)
TABLE 66 MALAYSIA LIQUID ARGON IN LIQUID GASES MARKET, BY APPLICATION, 2021-2030 (USD THOUSAND)
TABLE 67 MALAYSIA LIQUID NITROGEN IN LIQUID GASES MARKET, BY FUNCTION, 2021-2030 (USD THOUSAND)
TABLE 68 MALAYSIA LIQUID NITROGEN IN LIQUID GASES MARKET, BY PRODUCTION TECHNOLOGY, 2021-2030 (USD THOUSAND)
TABLE 69 MALAYSIA LIQUID NITROGEN IN LIQUID GASES MARKET, BY STORAGE, 2021-2030 (USD THOUSAND)
TABLE 70 MALAYSIA LIQUID NITROGEN IN LIQUID GASES MARKET, BY END USE, 2021-2030 (USD THOUSAND)
TABLE 71 MALAYSIA FOOD & BEVERAGES IN LIQUID GASES MARKET, BY TYPE, 2021-2030 (USD THOUSAND)
TABLE 72 MALAYSIA HEALTHCARE IN LIQUID GASES MARKET, BY TYPE, 2021-2030 (USD THOUSAND)
TABLE 73 MALAYSIA BUILDING & CONSTRUCTION IN LIQUID GASES MARKET, BY TYPE, 2021-2030 (USD THOUSAND)
TABLE 74 MALAYSIA LIQUID OXYGEN IN LIQUID GASES MARKET, BY STORAGE TANK TYPE, 2021-2030 (USD THOUSAND)
TABLE 75 MALAYSIA LIQUID OXYGEN IN LIQUID GASES MARKET, BY APPLICATION, 2021-2030 (USD THOUSAND)
TABLE 76 VIETNAM LIQUID GASES MARKET, BY TYPE, 2021-2030 (USD THOUSAND)
TABLE 77 VIETNAM LIQUID GASES MARKET, BY TYPE, 2021-2030 (THOUSAND LITER)
TABLE 78 VIETNAM LIQUID ARGON IN LIQUID GASES MARKET, BY FUNCTION, 2021-2030 (USD THOUSAND)
TABLE 79 VIETNAM LIQUID ARGON IN LIQUID GASES MARKET, BY PURITY GRADE, 2021-2030 (USD THOUSAND)
TABLE 80 VIETNAM LIQUID ARGON IN LIQUID GASES MARKET, BY APPLICATION, 2021-2030 (USD THOUSAND)
TABLE 81 VIETNAM LIQUID NITROGEN IN LIQUID GASES MARKET, BY FUNCTION, 2021-2030 (USD THOUSAND)
TABLE 82 VIETNAM LIQUID NITROGEN IN LIQUID GASES MARKET, BY PRODUCTION TECHNOLOGY, 2021-2030 (USD THOUSAND)
TABLE 83 VIETNAM LIQUID NITROGEN IN LIQUID GASES MARKET, BY STORAGE, 2021-2030 (USD THOUSAND)
TABLE 84 VIETNAM LIQUID NITROGEN IN LIQUID GASES MARKET, BY END USE, 2021-2030 (USD THOUSAND)
TABLE 85 VIETNAM FOOD & BEVERAGES IN LIQUID GASES MARKET, BY TYPE, 2021-2030 (USD THOUSAND)
TABLE 86 VIETNAM HEALTHCARE IN LIQUID GASES MARKET, BY TYPE, 2021-2030 (USD THOUSAND)
TABLE 87 VIETNAM BUILDING & CONSTRUCTION IN LIQUID GASES MARKET, BY TYPE, 2021-2030 (USD THOUSAND)
TABLE 88 VIETNAM LIQUID OXYGEN IN LIQUID GASES MARKET, BY STORAGE TANK TYPE, 2021-2030 (USD THOUSAND)
TABLE 89 VIETNAM LIQUID OXYGEN IN LIQUID GASES MARKET, BY APPLICATION, 2021-2030 (USD THOUSAND)
TABLE 90 PHILIPPINES LIQUID GASES MARKET, BY TYPE, 2021-2030 (USD THOUSAND)
TABLE 91 PHILIPPINES LIQUID GASES MARKET, BY TYPE, 2021-2030 (THOUSAND LITER)
TABLE 92 PHILIPPINES LIQUID ARGON IN LIQUID GASES MARKET, BY FUNCTION, 2021-2030 (USD THOUSAND)
TABLE 93 PHILIPPINES LIQUID ARGON IN LIQUID GASES MARKET, BY PURITY GRADE, 2021-2030 (USD THOUSAND)
TABLE 94 PHILIPPINES LIQUID ARGON IN LIQUID GASES MARKET, BY APPLICATION, 2021-2030 (USD THOUSAND)
TABLE 95 PHILIPPINES LIQUID NITROGEN IN LIQUID GASES MARKET, BY FUNCTION, 2021-2030 (USD THOUSAND)
TABLE 96 PHILIPPINES LIQUID NITROGEN IN LIQUID GASES MARKET, BY PRODUCTION TECHNOLOGY, 2021-2030 (USD THOUSAND)
TABLE 97 PHILIPPINES LIQUID NITROGEN IN LIQUID GASES MARKET, BY STORAGE, 2021-2030 (USD THOUSAND)
TABLE 98 PHILIPPINES LIQUID NITROGEN IN LIQUID GASES MARKET, BY END USE, 2021-2030 (USD THOUSAND)
TABLE 99 PHILIPPINES FOOD & BEVERAGES IN LIQUID GASES MARKET, BY TYPE, 2021-2030 (USD THOUSAND)
TABLE 100 PHILIPPINES HEALTHCARE IN LIQUID GASES MARKET, BY TYPE, 2021-2030 (USD THOUSAND)
TABLE 101 PHILIPPINES BUILDING & CONSTRUCTION IN LIQUID GASES MARKET, BY TYPE, 2021-2030 (USD THOUSAND)
TABLE 102 PHILIPPINES LIQUID OXYGEN IN LIQUID GASES MARKET, BY STORAGE TANK TYPE, 2021-2030 (USD THOUSAND)
TABLE 103 PHILIPPINES LIQUID OXYGEN IN LIQUID GASES MARKET, BY APPLICATION, 2021-2030 (USD THOUSAND)
TABLE 104 MYANMAR LIQUID GASES MARKET, BY TYPE, 2021-2030 (USD THOUSAND)
TABLE 105 MYANMAR LIQUID GASES MARKET, BY TYPE, 2021-2030 (THOUSAND LITER)
TABLE 106 MYANMAR LIQUID ARGON IN LIQUID GASES MARKET, BY FUNCTION, 2021-2030 (USD THOUSAND)
TABLE 107 MYANMAR LIQUID ARGON IN LIQUID GASES MARKET, BY PURITY GRADE, 2021-2030 (USD THOUSAND)
TABLE 108 MYANMAR LIQUID ARGON IN LIQUID GASES MARKET, BY APPLICATION, 2021-2030 (USD THOUSAND)
TABLE 109 MYANMAR LIQUID NITROGEN IN LIQUID GASES MARKET, BY FUNCTION, 2021-2030 (USD THOUSAND)
TABLE 110 MYANMAR LIQUID NITROGEN IN LIQUID GASES MARKET, BY PRODUCTION TECHNOLOGY, 2021-2030 (USD THOUSAND)
TABLE 111 MYANMAR LIQUID NITROGEN IN LIQUID GASES MARKET, BY STORAGE, 2021-2030 (USD THOUSAND)
TABLE 112 MYANMAR LIQUID NITROGEN IN LIQUID GASES MARKET, BY END USE, 2021-2030 (USD THOUSAND)
TABLE 113 MYANMAR FOOD & BEVERAGES IN LIQUID GASES MARKET, BY TYPE, 2021-2030 (USD THOUSAND)
TABLE 114 MYANMAR HEALTHCARE IN LIQUID GASES MARKET, BY TYPE, 2021-2030 (USD THOUSAND)
TABLE 115 MYANMAR BUILDING & CONSTRUCTION IN LIQUID GASES MARKET, BY TYPE, 2021-2030 (USD THOUSAND)
TABLE 116 MYANMAR LIQUID OXYGEN IN LIQUID GASES MARKET, BY STORAGE TANK TYPE, 2021-2030 (USD THOUSAND)
TABLE 117 MYANMAR LIQUID OXYGEN IN LIQUID GASES MARKET, BY APPLICATION, 2021-2030 (USD THOUSAND)
TABLE 118 CAMBODIA LIQUID GASES MARKET, BY TYPE, 2021-2030 (USD THOUSAND)
TABLE 119 CAMBODIA LIQUID GASES MARKET, BY TYPE, 2021-2030 (THOUSAND LITER)
TABLE 120 CAMBODIA LIQUID ARGON IN LIQUID GASES MARKET, BY FUNCTION, 2021-2030 (USD THOUSAND)
TABLE 121 CAMBODIA LIQUID ARGON IN LIQUID GASES MARKET, BY PURITY GRADE, 2021-2030 (USD THOUSAND)
TABLE 122 CAMBODIA LIQUID ARGON IN LIQUID GASES MARKET, BY APPLICATION, 2021-2030 (USD THOUSAND)
TABLE 123 CAMBODIA LIQUID NITROGEN IN LIQUID GASES MARKET, BY FUNCTION, 2021-2030 (USD THOUSAND)
TABLE 124 CAMBODIA LIQUID NITROGEN IN LIQUID GASES MARKET, BY PRODUCTION TECHNOLOGY, 2021-2030 (USD THOUSAND)
TABLE 125 CAMBODIA LIQUID NITROGEN IN LIQUID GASES MARKET, BY STORAGE, 2021-2030 (USD THOUSAND)
TABLE 126 CAMBODIA LIQUID NITROGEN IN LIQUID GASES MARKET, BY END USE, 2021-2030 (USD THOUSAND)
TABLE 127 CAMBODIA FOOD & BEVERAGES IN LIQUID GASES MARKET, BY TYPE, 2021-2030 (USD THOUSAND)
TABLE 128 CAMBODIA HEALTHCARE IN LIQUID GASES MARKET, BY TYPE, 2021-2030 (USD THOUSAND)
TABLE 129 CAMBODIA BUILDING & CONSTRUCTION IN LIQUID GASES MARKET, BY TYPE, 2021-2030 (USD THOUSAND)
TABLE 130 CAMBODIA LIQUID OXYGEN IN LIQUID GASES MARKET, BY STORAGE TANK TYPE, 2021-2030 (USD THOUSAND)
TABLE 131 CAMBODIA LIQUID OXYGEN IN LIQUID GASES MARKET, BY APPLICATION, 2021-2030 (USD THOUSAND)
List of Figure
FIGURE 1 SOUTHEAST ASIA LIQUID GASES MARKET : SEGMENTATION
FIGURE 2 SOUTHEAST ASIA LIQUID GASES MARKET : DATA TRIANGULATION
FIGURE 3 SOUTHEAST ASIA LIQUID GASES MARKET : DROC ANALYSIS
FIGURE 4 SOUTHEAST ASIA LIQUID GASES MARKET : REGIONAL VS COUNTRY MARKET ANALYSIS
FIGURE 5 SOUTHEAST ASIA LIQUID GASES MARKET : COMPANY RESEARCH ANALYSIS
FIGURE 6 SOUTHEAST ASIA LIQUID GASES MARKET : THE MATERIAL LIFE LINE CURVE
FIGURE 7 SOUTHEAST ASIA LIQUID GASES MARKET : MULTIVARIATE MODELLING
FIGURE 8 PRODUCT LIFE LINE CURVE
FIGURE 9 SOUTHEAST ASIA LIQUID GASES MARKET : INTERVIEW DEMOGRAPHICS
FIGURE 10 SOUTHEAST ASIA LIQUID GASES MARKET: DBMR VENDOR POSITIONING GRID
FIGURE 11 SOUTHEAST ASIA LIQUID GASES MARKET : THE MARKET CHALLENGE MATRIX
FIGURE 12 SOUTHEAST ASIA LIQUID GASES MARKET : VENDOR SHARE ANALYSIS
FIGURE 13 SOUTHEAST ASIA LIQUID GASES MARKET : SEGMENTATION
FIGURE 14 INCREASING INVESTMENTS IN FOOD INDUSTRY AND MEDICAL SECTOR ARE EXPECTED TO DRIVE SOUTHEAST ASIA LIQUID GASES MARKET GROWTH IN THE FORECAST PERIOD
FIGURE 15 LIQUID ARGON SEGMENT IS EXPECTED TO ACCOUNT FOR THE LARGEST SHARE OF THE SOUTHEAST ASIA LIQUID GASES MARKET IN 2023 & 2030
FIGURE 16 IMPORT EXPORT SCENARIO (USD THOUSAND)
FIGURE 17 DRIVERS, RESTRAINTS, OPPORTUNITIES AND CHALLENGES OF SOUTHEAST ASIA LIQUID GASES MARKET
FIGURE 18 SOUTHEAST ASIA LIQUID GASES MARKET: BY TYPE, 2022
FIGURE 19 SOUTHEAST ASIA LIQUID GASES MARKET : SNAPSHOT (2022)
FIGURE 20 SOUTHEAST ASIA LIQUID GASES MARKET : BY COUNTRY (2022)
FIGURE 21 SOUTHEAST ASIA LIQUID GASES MARKET : BY COUNTRY (2023 & 2030)
FIGURE 22 SOUTHEAST ASIA LIQUID GASES MARKET : BY COUNTRY (2022 & 2030)
FIGURE 23 SOUTHEAST ASIA LIQUID GASES MARKET : BY TYPE (2023-2030)
FIGURE 24 SOUTHEAST ASIA LIQUID GASES MARKET: COMPANY SHARE 2022 (%)
Southeast Asia Liquid Gases Market, Supply Chain Analysis and Ecosystem Framework
To support market growth and help clients navigate the impact of geopolitical shifts, DBMR has integrated in-depth supply chain analysis into its Southeast Asia Liquid Gases Market research reports. This addition empowers clients to respond effectively to global changes affecting their industries. The supply chain analysis section includes detailed insights such as Southeast Asia Liquid Gases Market consumption and production by country, price trend analysis, the impact of tariffs and geopolitical developments, and import and export trends by country and HSN code. It also highlights major suppliers with data on production capacity and company profiles, as well as key importers and exporters. In addition to research, DBMR offers specialized supply chain consulting services backed by over a decade of experience, providing solutions like supplier discovery, supplier risk assessment, price trend analysis, impact evaluation of inflation and trade route changes, and comprehensive market trend analysis.
Data collection and base year analysis are done using data collection modules with large sample sizes. The stage includes obtaining market information or related data through various sources and strategies. It includes examining and planning all the data acquired from the past in advance. It likewise envelops the examination of information inconsistencies seen across different information sources. The market data is analysed and estimated using market statistical and coherent models. Also, market share analysis and key trend analysis are the major success factors in the market report. To know more, please request an analyst call or drop down your inquiry.
The key research methodology used by DBMR research team is data triangulation which involves data mining, analysis of the impact of data variables on the market and primary (industry expert) validation. Data models include Vendor Positioning Grid, Market Time Line Analysis, Market Overview and Guide, Company Positioning Grid, Patent Analysis, Pricing Analysis, Company Market Share Analysis, Standards of Measurement, Global versus Regional and Vendor Share Analysis. To know more about the research methodology, drop in an inquiry to speak to our industry experts.
Data Bridge Market Research is a leader in advanced formative research. We take pride in servicing our existing and new customers with data and analysis that match and suits their goal. The report can be customized to include price trend analysis of target brands understanding the market for additional countries (ask for the list of countries), clinical trial results data, literature review, refurbished market and product base analysis. Market analysis of target competitors can be analyzed from technology-based analysis to market portfolio strategies. We can add as many competitors that you require data about in the format and data style you are looking for. Our team of analysts can also provide you data in crude raw excel files pivot tables (Fact book) or can assist you in creating presentations from the data sets available in the report.


