
Uk Restaurant Pos Market
Market Size in USD Billion
 USD
1.16 Billion
USD
1.95 Billion
2025
2033
USD
1.16 Billion
USD
1.95 Billion
2025
2033
| 2026 - 2033 | |
| USD 1.16 Billion | |
| USD 1.95 Billion | |
| % | |
|
U.K. Restaurant POS Market Overview
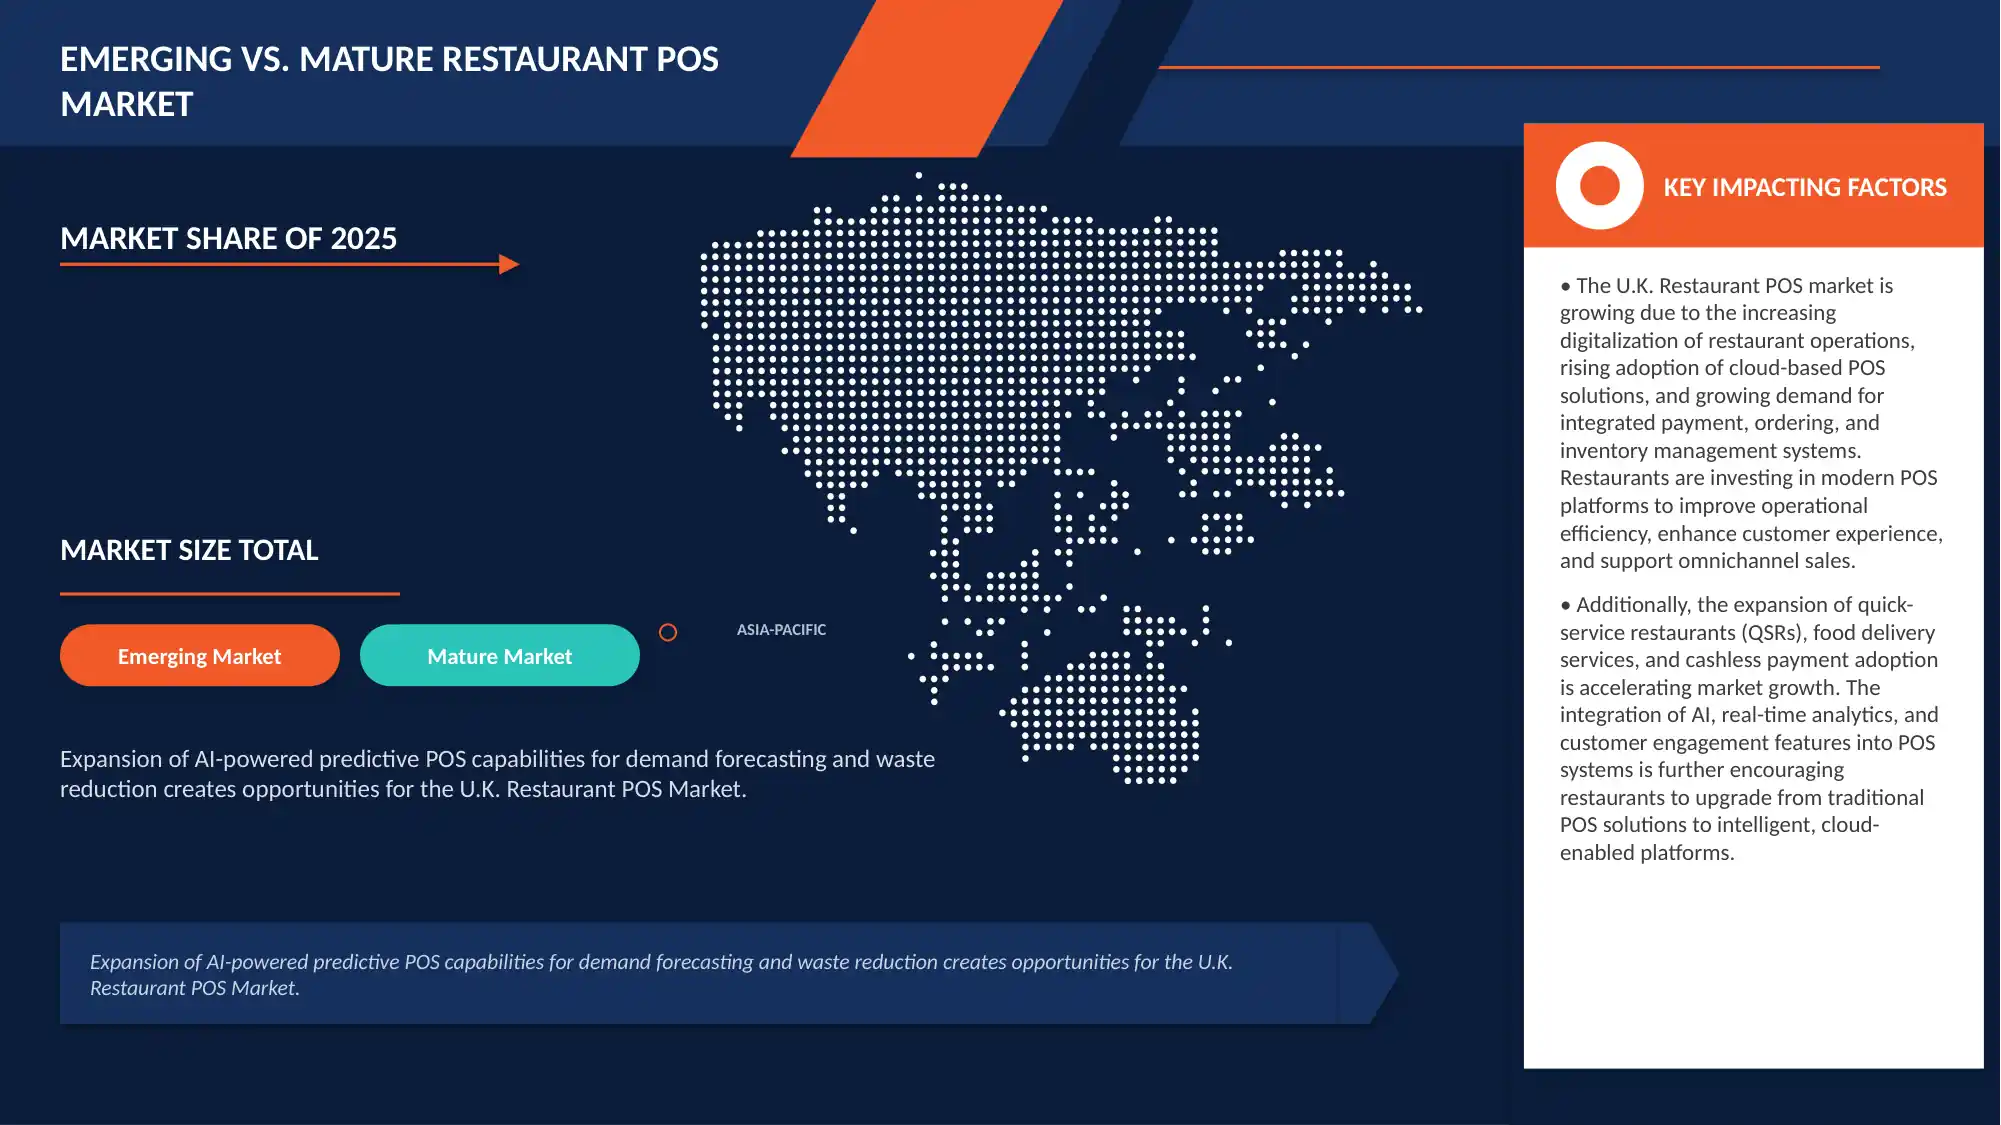
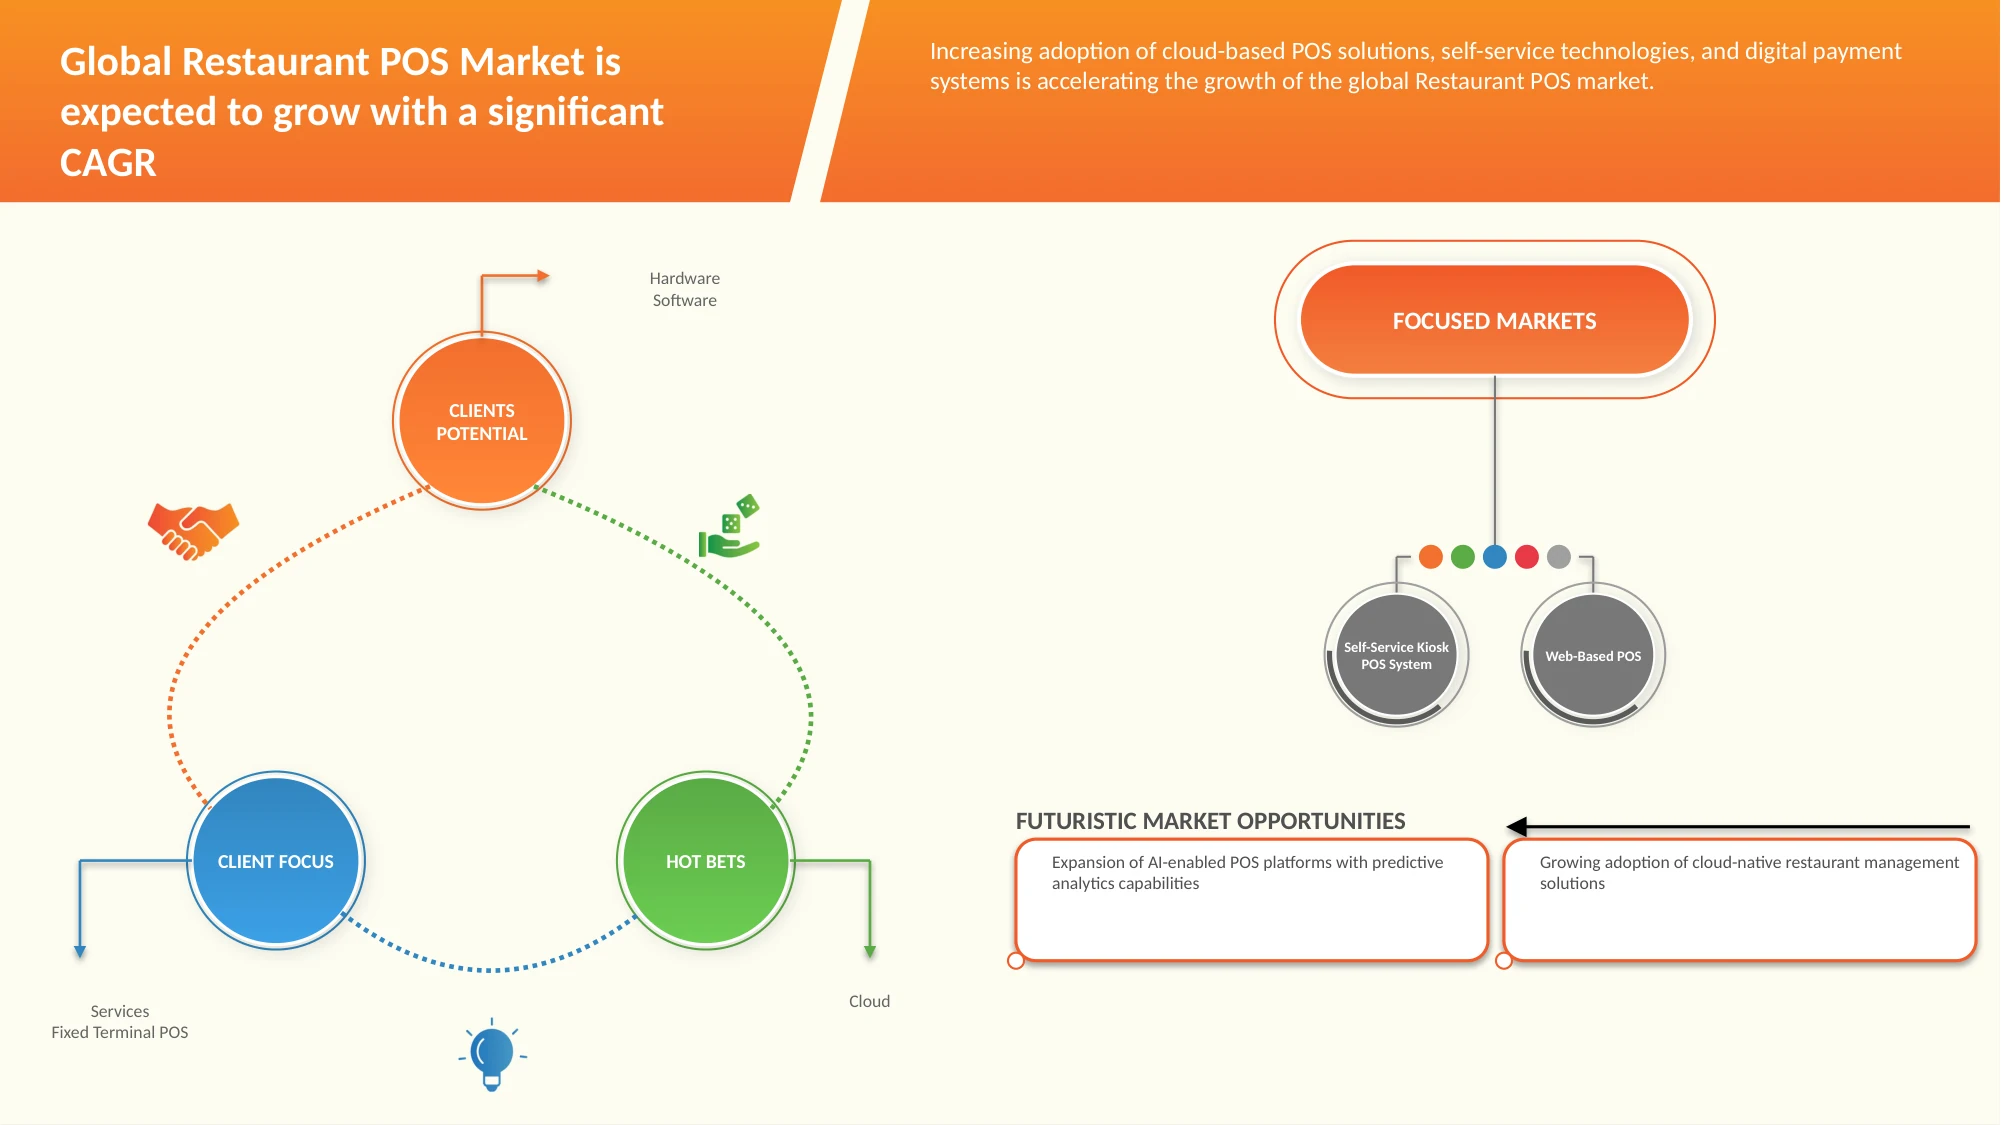
The U.K. Restaurant POS market was valued at USD 1.16 billion in 2025 and is projected to reach USD 1.95 billion by 2033, growing at a CAGR of 6.78% from 2026 to 2033. The market is experiencing consistent growth driven by rapid digitalization of the foodservice industry, increasing adoption of cloud-based and AI-powered POS solutions, and the expanding role of integrated platforms in managing orders, payments, inventory, and customer engagement across diverse restaurant formats.
The U.K. foodservice sector, which supports approximately 195,000 restaurant establishments with an 83% POS penetration rate, is undergoing a significant technology transition as operators shift from legacy fixed terminal systems to flexible, subscription-based cloud POS platforms. Rising consumer expectations for contactless payments, digital ordering, and seamless delivery integration, combined with growing operational pressures around labour management, food waste reduction, and data-driven decision-making, are accelerating investment in next-generation restaurant technology across QSRs, FSRs, cloud kitchens, and hospitality groups.
Key Market Trends & Insights
- The hardware segment led the U.K. restaurant POS market with the largest revenue share of 43.40% in 2025, driven by widespread adoption of cloud-based subscription platforms, integrated order management, and real-time analytics solutions across independent and chain restaurants.
- The cloud deployment mode dominated the market with a 52.48% share in 2025, supported by increasing SaaS adoption, lower total cost of ownership, and the ability to manage multi-location operations remotely.
- The QSR (Quick Service Restaurants) segment accounted for the largest restaurant type share of 23.10% in 2025, underpinned by high transaction volumes, self-service kiosk deployment, and deep digital ordering integration.
- Independent restaurants remained the leading end-user segment with a 41.84% revenue share in 2025, reflecting the large number of single-outlet foodservice establishments across the U.K. and the broad availability of affordable POS solutions.
- The subscription revenue model accounted for 54.38% of the market in 2025, reinforcing the industry-wide shift toward recurring SaaS deployments that offer flexibility, automatic upgrades, and lower upfront capital requirements.
- The mobile POS (MPOS) System segment is the fastest-growing POS system type, projected to register the highest CAGR of 7.43 from 2026 to 2033, driven by cloud migration trends, integration flexibility, and growing adoption among SMEs.
- Software is the fastest-growing offering segment, growing with a CAGR of 8.24%, supported by rapid growth in online food delivery, heavy reliance on digital ordering platforms, and the delivery-centric operational model that depends on seamless cloud POS integration.
Market Size & Forecast
- Market Value (2025): USD 1.16 Billion
- Expected Market Value (2033): USD 1.95 Billion
- Forecast CAGR (2026–2033): 6.78%
Report Scope and U.K. Restaurant POS Market Segmentation
|
Attributes |
U.K. Restaurant POS Key Market Insights |
|
Segments Covered |
|
|
Key Market Players |
· Zonal Retail Data Systems Ltd. (U.K.) · Epos Now Ltd. (U.K.) · iCRTouch Ltd. (U.K.) · Tevalis Ltd. (U.K.) · PosAppt Ltd. (U.K.) · TISSL Ltd. (U.K.) · NFS Hospitality (U.K.) · The Access Group (U.K.) · Kobas Ltd. (U.K.) · Syrve (Cyprus) · Toast, Inc. (U.S.) · TouchBistro Inc. (Canada) · Lightspeed Commerce Inc. (Canada) · Block (Square) (U.S.) · PAR Technology Corporation (U.S.) · NCR Voyix Corporation (U.S.) · Oracle Corporation (U.S.) · Clover Network LLC (U.S.) · SumUp Payments Limited (U.K.) · Revel Systems Inc. (U.S.) |
|
Market Opportunities |
· Expansion of AI-Powered Predictive POS Capabilities for Demand Forecasting and Waste Reduction · Expansion Opportunity in Underserved Independent Restaurants and Regional Foodservice Operators Through Affordable Modular Cloud POS Solutions |
|
Value Added Data Infosets |
In addition to the market insights such as market value, growth rate, market segments, geographical coverage, market players, and market scenario, the market report curated by the Data Bridge Market Research team includes in-depth expert analysis, import/export analysis, pricing analysis, production consumption analysis, and pestle analysis. |
U.K. Restaurant POS Market Trends
Trend: Expansion of AI-Powered Predictive POS Capabilities for Demand Forecasting and Waste Reduction
The expansion of AI-powered predictive POS capabilities for demand forecasting and waste reduction represents a strong opportunity in the U.K. restaurant POS market because restaurant operators are under growing pressure to improve profitability without compromising service quality. Food inflation, labour shortages, menu complexity, and volatile customer demand are making it harder for restaurants to plan purchasing, prep volumes, staffing, and stock usage accurately through manual methods alone. This is creating space for POS platforms to evolve beyond billing and payment processing into more intelligent operating systems that can predict demand, recommend order quantities, flag anomalies, and help managers make faster day-to-day decisions. Company announcements from hospitality technology providers show that AI-led forecasting is increasingly being built into restaurant scheduling, purchasing, and inventory tools to help operators reduce over-ordering, control food waste, and align labour with actual demand patterns. For multi-site chains as well as growing independent groups, these capabilities can turn POS data into practical recommendations on what to stock, how much to prep, and where margins are being lost. As a result, AI-powered predictive POS is emerging as a meaningful growth opportunity in the U.K. market, not only as a productivity tool but also as a way to improve cost control, sustainability, and outlet-level profitability.
For instances,
- In June 2025, ReLondon published a case study on Go Mezza, a small London takeaway chain, showing that after adopting AI-driven ordering software and better inventory forecasting, the business saved almost USD 1,270 per month, on food purchasing while also cutting waste. This shows clear opportunity for POS platforms that combine sales data with predictive ordering and inventory planning.
- In April 2026, Square and MarketMan launched an advanced inventory management integration for restaurants, adding tools such as ingredient-level inventory tracking, recipe costing, waste monitoring, and purchasing workflows. The launch matters because it shows restaurant POS vendors are actively expanding from payment and billing into predictive stock management and food-cost control, creating a wider opportunity to offer AI-led forecasting and waste-reduction capabilities to restaurant operators.
In conclusion, AI-powered predictive POS capabilities represent a strong opportunity in the U.K. restaurant POS market as operators increasingly look for smarter ways to manage demand, reduce food waste, and improve profitability. By combining restaurant sales data with forecasting, inventory planning, and operational insights, AI-enabled POS platforms can help restaurants make better purchasing and staffing decisions while reducing inefficiencies. As restaurants place greater emphasis on margin protection and waste control, predictive POS tools are likely to become an increasingly important area of innovation and market expansion.
U.K. Restaurant POS Market Dynamics
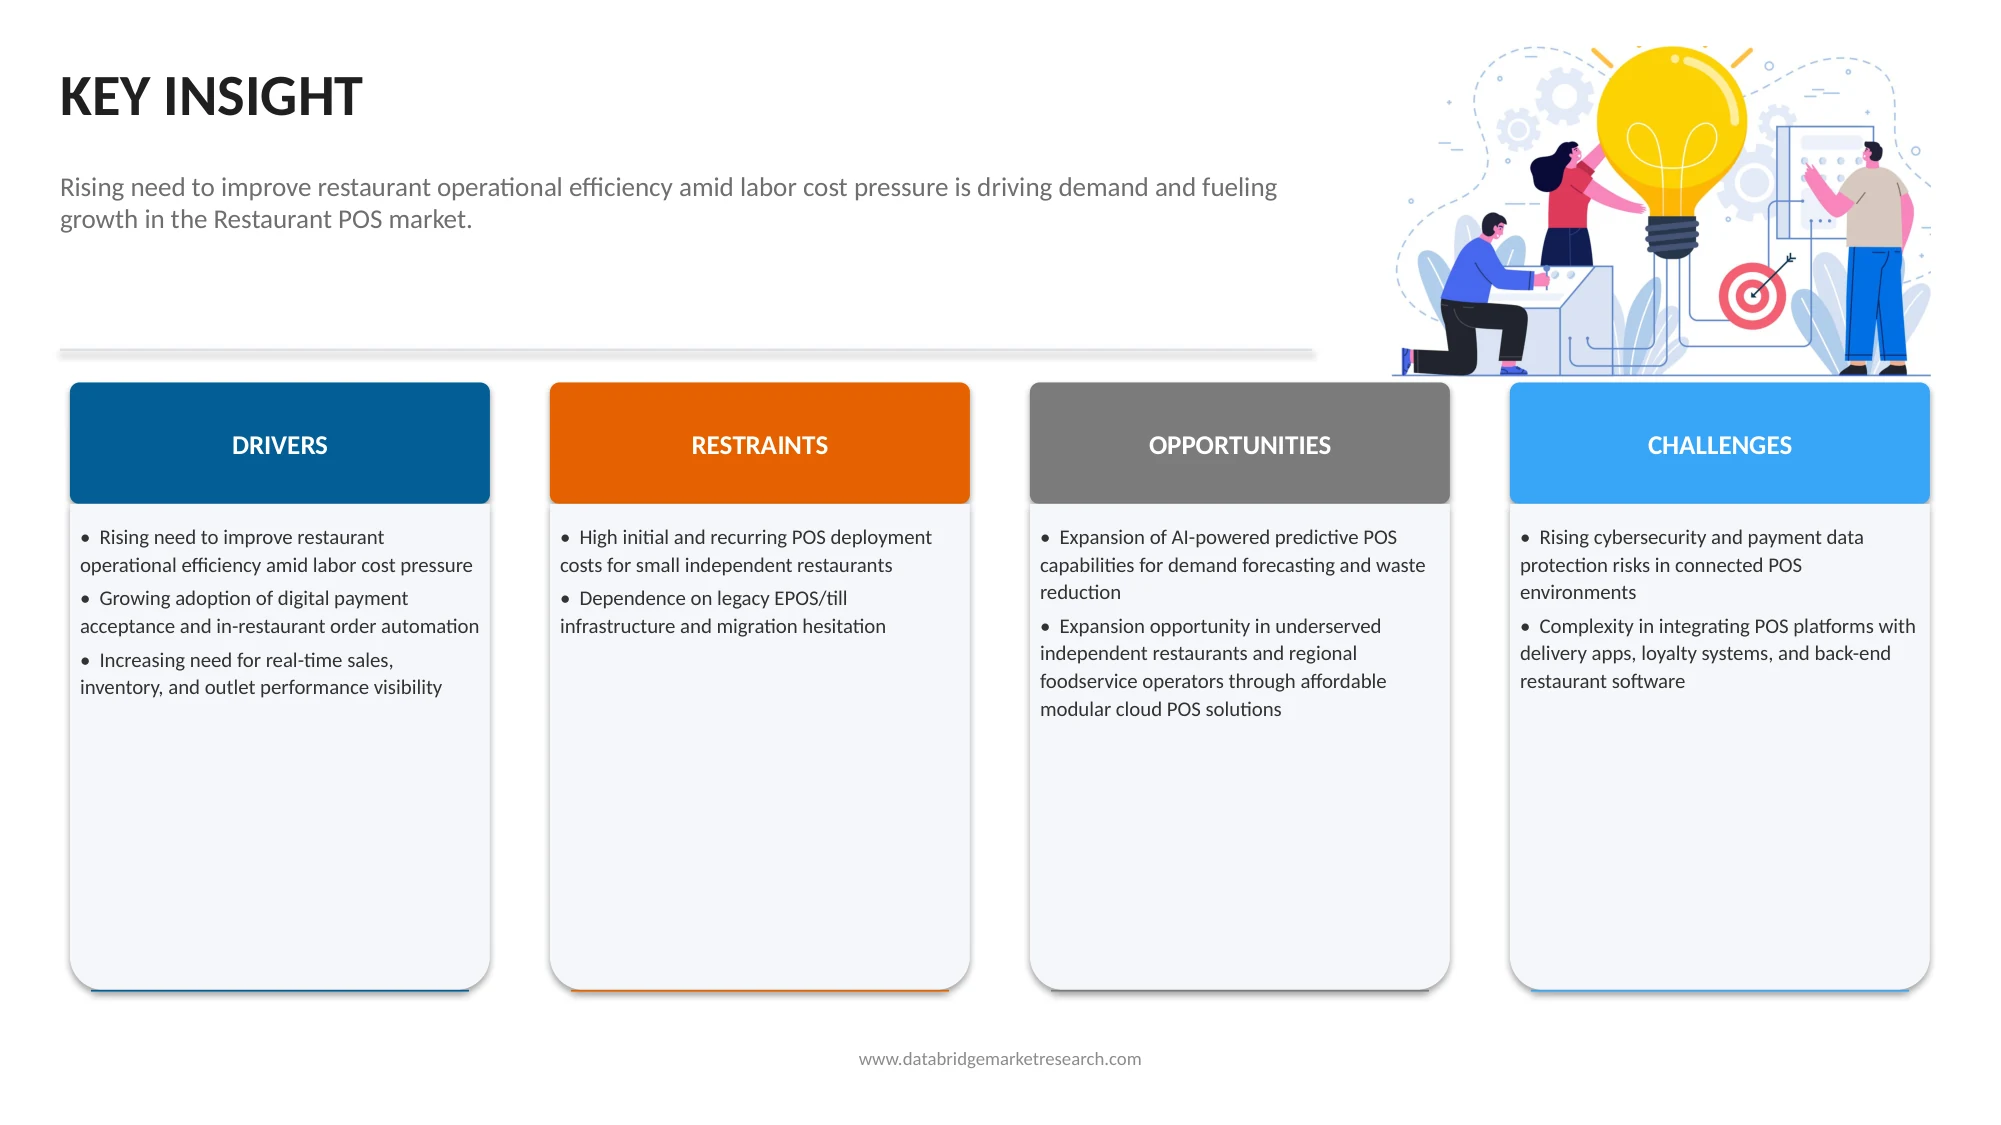
Key Market Driver: Rising Need to Improve Restaurant Operational Efficiency Amid Labour Cost Pressure
The rising need to improve restaurant operational efficiency amid labour cost pressure is becoming a key driver for the U.K. restaurant POS market, as restaurant operators are being forced to do more with tighter budgets and leaner teams. In the U.K., hospitality businesses have been facing sustained increases in wage bills, employer National Insurance contributions, food inflation, and other day-to-day operating costs, all of which are putting pressure on margins and staffing decisions. Industry bodies such as UKHospitality have highlighted job losses and rising employment costs across the sector, while government-backed hospitality support programmes have also focused on helping pubs and restaurants cut avoidable operating expenses through smarter use of data and digital tools. In this environment, POS systems are increasingly valued not just as billing software, but as operational tools that can help restaurants speed up order processing, reduce manual work, improve table and kitchen coordination, monitor stock more accurately, and provide real-time sales visibility. For restaurant operators trying to maintain service quality while controlling labour and overhead costs, POS adoption is therefore becoming a practical way to improve efficiency, reduce wastage, and support more cost-effective day-to-day operations.
For instances,
- In December 2024, UKHospitality said changes to employer National Insurance would raise the cost of employment per person by 10% in hospitality, with the sector facing a USD 4.32 billion annual tax hit in 2025. Such cost pressure pushes restaurants to adopt POS systems that reduce manual work, improve staff productivity, and help manage operations with fewer labour hours.
- In January 2025, UKHospitality said hospitality businesses would face an extra USD 1.27 billion in costs because 774,000 more workers would become liable for employer National Insurance from April 2025. With payroll costs rising so sharply, restaurants are under greater pressure to use POS tools for faster billing, order automation, and tighter labour and sales management.
In conclusion, rising labour-related cost pressure is pushing U.K. restaurants to adopt POS systems not only as payment tools but as operational efficiency enablers. With higher wage bills, National Insurance costs, and tighter staffing conditions, restaurants are increasingly using POS platforms to reduce manual work, speed up service, improve staff productivity, and manage daily operations more efficiently. As labour cost pressure continues across the hospitality sector, the role of restaurant POS in supporting leaner and more cost-effective operations is expected to strengthen further.
Key Restraint/Challenge: High Initial and Recurring POS Deployment Costs For Small Independent Restaurants
The high initial and recurring POS deployment costs for small independent restaurants remain a meaningful restraint in the U.K. restaurant POS market because many operators are trying to modernize at a time when margins are already under pressure from food inflation, wage costs, energy bills, and higher business overheads. For small restaurants, the cost of adopting a POS system is rarely limited to one software fee. It can include hardware such as terminals, handhelds, kitchen display screens, card readers, printers, and tablets, along with monthly subscription charges, payment processing fees, installation, staff training, and add-on modules for inventory, online ordering, or table management. Company pricing pages show that even before customization, restaurant POS packages can involve monthly software charges and separate hardware spending, while each card transaction also adds a recurring fee. This becomes a bigger issue for independent operators that run on tight cash flow and may not have the scale to spread those costs across multiple outlets. As a result, many small U.K. restaurants delay upgrades, choose basic systems with limited functionality, or continue using older tills for longer, which slows the pace of full POS adoption despite the clear operational benefits of modern restaurant technology.
For instances,
- In March 2021, Epos Now explained that a restaurant POS system in the U.K. can cost USD 32–153 per month for software and about USD 483 upfront for starter hardware. For a small independent restaurant, these recurring and upfront costs can make POS adoption difficult.
In conclusion, high upfront hardware investment, monthly software fees, transaction charges, and paid add-on modules remain a key restraint for POS adoption among small independent restaurants in the U.K. Although modern POS systems offer clear operational benefits, many smaller operators continue to face affordability challenges when evaluating full-featured deployments. As a result, cost remains an important barrier that can delay upgrades, limit adoption of advanced functions, or push smaller restaurants toward basic systems instead of more integrated POS platforms.
Key Market Opportunity: Expansion Opportunity in Underserved Independent Restaurants and Regional Foodservice Operators Through Affordable Modular Cloud POS Solutions
The expansion opportunity in underserved independent restaurants and regional foodservice operators through affordable modular cloud POS solutions is becoming increasingly relevant in the U.K. restaurant POS market as a large share of the hospitality base still consists of smaller operators that need practical technology, but cannot always justify large, all-at-once system investments. Independent restaurants, takeaways, cafés, and regional foodservice businesses often have different priorities from larger chains: they need solutions that are affordable, easy to install, simple for staff to learn, and flexible enough to add features gradually as the business grows. This creates a strong opportunity for cloud POS providers offering modular systems that start with core billing and payments, then expand into handheld ordering, delivery integrations, loyalty, kitchen display, reporting, or inventory management only when needed. Company launches and U.K.-focused POS product pages increasingly highlight lower-cost entry plans, bundled onboarding, remote management, and scalable add-ons designed specifically for growing hospitality businesses rather than only enterprise chains. For operators outside large national groups, modular cloud POS reduces the need for heavy upfront investment while still giving access to digital payments, reporting, and multi-channel order management. As a result, the U.K. market offers meaningful room for POS vendors to grow by targeting smaller, underserved restaurant businesses with flexible, step-by-step digital solutions.
For instances,
- In April 2025, EPOS Direct launched a Cloud POS solution for small restaurants and hospitality startups in the U.K. with a freemium model, positioning it specifically as a way to avoid the burden of high upfront costs. This is a clear sign that vendors see opportunity in smaller independent restaurants that want cloud POS, inventory tracking, and reporting tools but need a low-cost entry point before scaling into paid modules.
- In July 2025, Clover published a U.K. case study on Magic Monkey Restaurant, showing how the business replaced paper-based front-of-house and back-office processes with an integrated cloud POS and tableside payments setup. The case highlights how smaller hospitality operators are moving toward modular, connected POS systems that improve day-to-day operations without requiring a large enterprise-style rollout, creating growth opportunities for vendors targeting underserved independent restaurants with scalable cloud solutions.
In conclusion, underserved independent restaurants and regional foodservice operators represent a meaningful growth opportunity for the U.K. restaurant POS market, particularly through affordable and modular cloud-based solutions. Smaller operators often need flexible systems that can start with essential billing and payment functions and expand gradually into reporting, loyalty, ordering, and inventory tools as the business grows. This creates strong market potential for POS vendors that can offer low-barrier, scalable, and easy-to-adopt solutions tailored to the operational realities of independent hospitality businesses.
U.K. Restaurant POS Market Scope
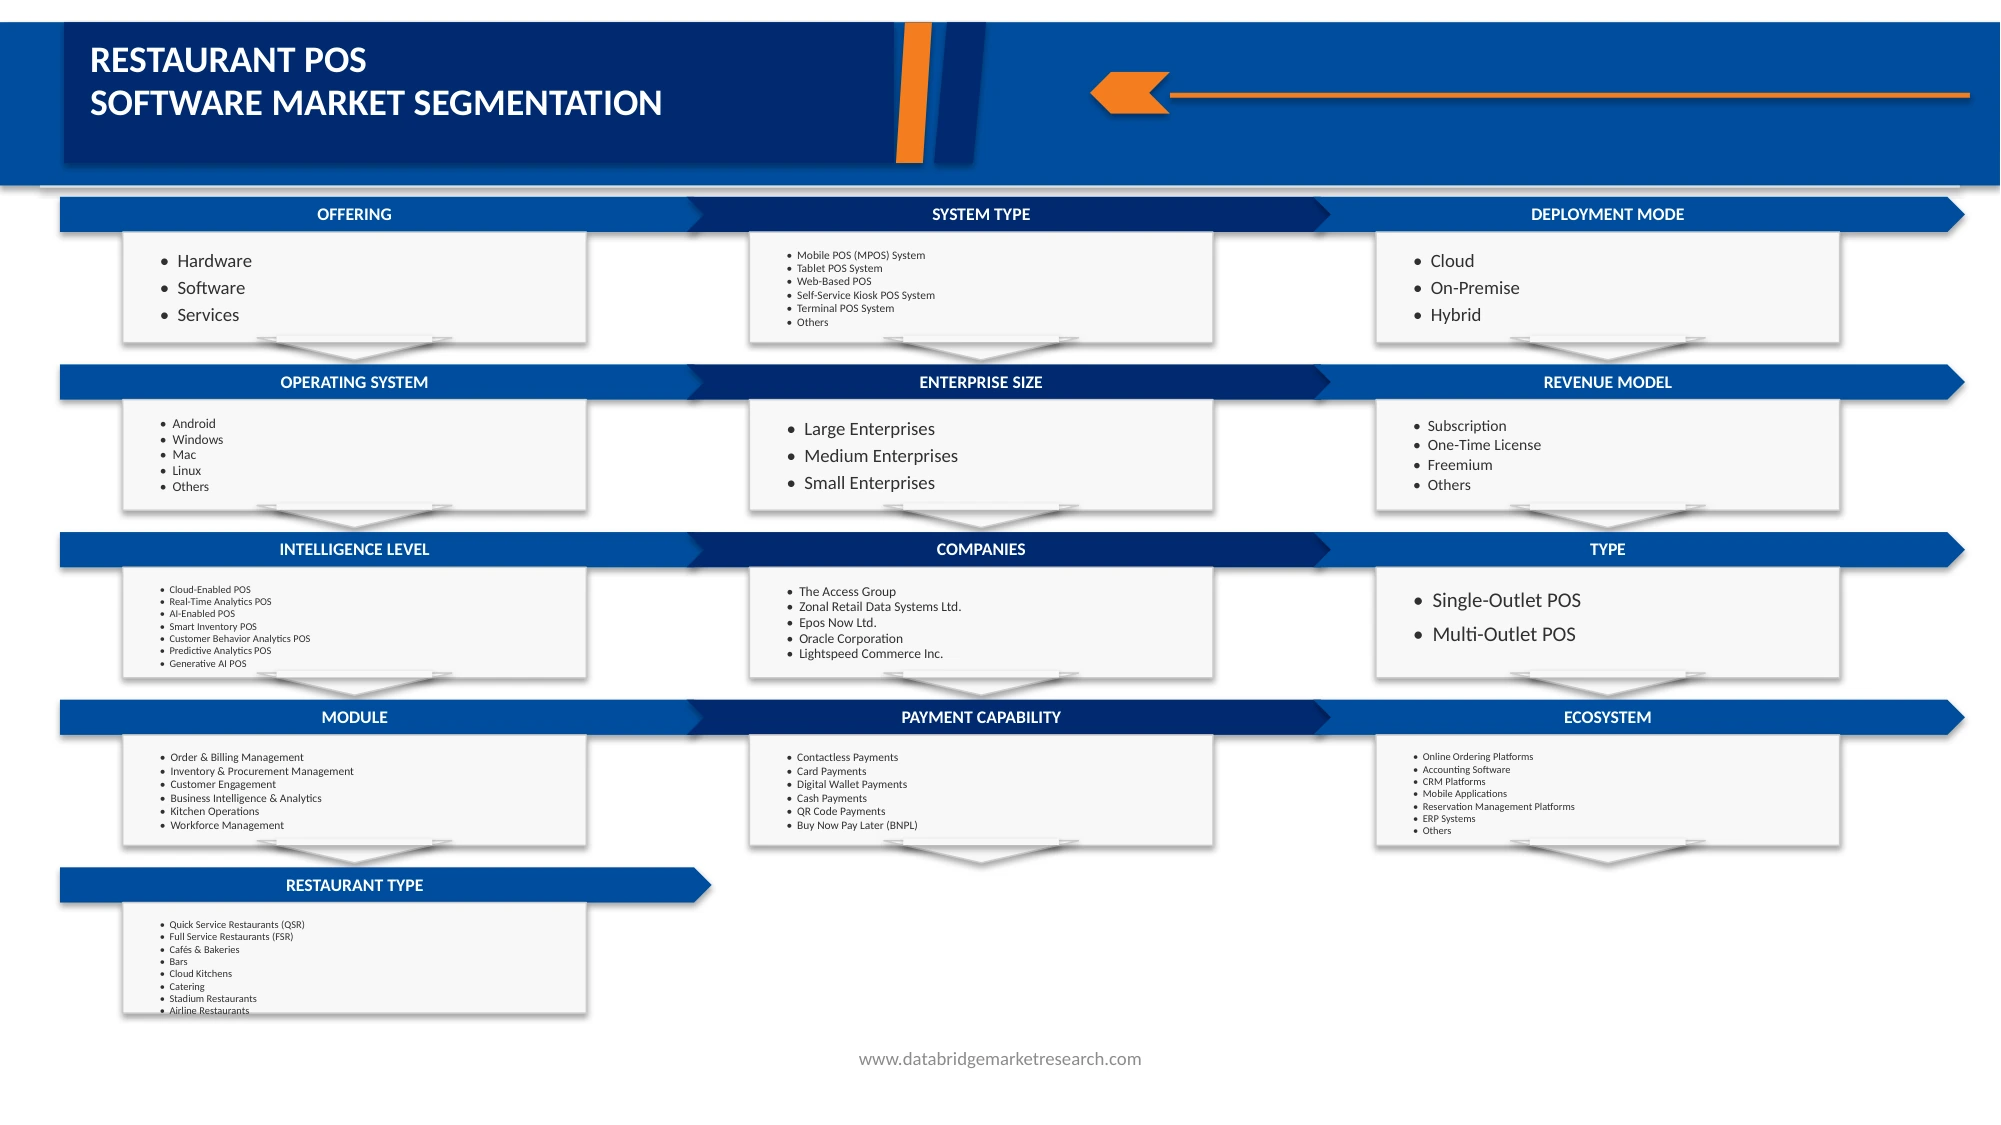
The U.K. restaurant POS market is segmented on the basis of offering, POS system type, deployment mode, enterprise size, operating system, revenue model, intelligence level, outlet type, functional module, payment capability, integration ecosystem, restaurant type, and end user.
- By Offering
On the basis of offering, the U.K. restaurant POS market is segmented into hardware, software, and services. The hardware segment dominated the market with a 43.40% share in 2025, driven by the widespread adoption of cloud-based subscription platforms, integrated payment processing modules, order management systems, and real-time analytics tools across independent restaurants, QSRs, and hospitality groups.
The software segment is projected to register the fastest growth from 2026 to 2033, growing with a CAGR of 8.24%, driven by widespread adoption of cloud-based subscription platforms, integrated order management, and real-time analytics solutions across independent and chain restaurants.
- By POS System Type
On the basis of POS system type, the U.K. restaurant POS market is segmented into fixed terminal POS, mobile POS (MPOS) system, tablet POS system, web-based POS, self-service kiosk POS system, terminal POS system, and others. The fixed terminal POS segment dominated the market with a 30.46% share in 2025, owing to its large installed base across established restaurant chains, full-service dining operators, and QSRs that rely on high-throughput, counter-based transaction processing and stable hardware infrastructure.
The mobile POS (MPOS) system segment is projected to register the fastest CAGR from 2026 to 2033, growing with a CAGR of 7.43%, driven by accelerating cloud migration across the U.K. foodservice sector, growing demand for browser-accessible, device-agnostic systems, and the seamless integration capabilities offered by web-based platforms with delivery, accounting, and CRM software ecosystems.
- By Deployment Mode
On the basis of deployment mode, the U.K. restaurant POS market is segmented into cloud, on premises, and hybrid. The cloud segment dominated the market with a 52.48% share in 2025, supported by the broad adoption of SaaS-based POS platforms among independent restaurants, mid-market chains, and cloud kitchens that require scalable, remotely managed, and cost-effective operational technology. High contactless payment adoption and HMRC's digital compliance requirements have further incentivized cloud deployment across the sector.
The cloud segment is expected to witness the fastest CAGR from 2026 to 2033, growing with a CAGR of 7.15%, driven by continued expansion of subscription-based POS solutions, integration with food delivery and online ordering platforms, and increasing operator preference for automatic software updates, real-time analytics, and multi-location management capabilities delivered through cloud infrastructure.
- By Enterprise Size
On the basis of enterprise size, the U.K. restaurant POS market is segmented into large chain restaurants, medium chain restaurants, and small restaurants. The large chain restaurants segment dominated the market with a 45.66% share in 2025, reflecting the large number of single-outlet foodservice establishments across the U.K. that adopt entry-level and cloud-based POS systems to manage transactions, payments, and basic operations at affordable price points.
The small restaurants segment is expected to witness the fastest CAGR from 2026 to 2033, growing with a CAGR of 7.38%, driven by accelerating deployment of AI-powered analytics, multi-location POS management, and self-service kiosk systems, and the increasing emphasis on precision engineering, regulatory compliance, and performance optimization across enterprise foodservice networks.
- By Operating System
On the basis of operating system, the U.K. restaurant POS market is segmented into Android, Windows, Mac, Linux, and others. The Android segment dominated the market with a 39.84% share in 2025, driven by its strong presence in tablet and mobile POS deployments, low hardware costs, and widespread availability of Android-based POS applications across SME restaurant operators and cloud kitchen platforms that prioritize affordability and flexibility.
The Android segment is also expected to witness the fastest CAGR from 2026 to 2033, growing with a CAGR of 7.29% driven by continued growth in mobile and tablet POS adoption, expanding availability of enterprise-grade Android POS hardware, and increasing integration of Android-based systems with contactless payment terminals and delivery management platforms across independent and mid-market restaurant operators.
- By Revenue Model
On the basis of revenue model, the U.K. restaurant POS market is segmented into subscription, one time license, freemium, and others. The Subscription segment dominated the market with a 54.38% share in 2025, reflecting the industry-wide shift toward recurring SaaS-based POS licensing that offers operators lower upfront investment, predictable operational costs, and continuous access to software updates, new features, and cloud-based analytics capabilities. Monthly subscription models account for the largest sub-segment share at 58.76%, preferred for their payment flexibility across SME operators.
The Subscription segment is expected to witness the fastest CAGR from 2026 to 2033, growing with a CAGR of 7.04% driven by increasing adoption of cloud-native POS platforms, expanding subscription offerings from technology providers targeting the independent restaurant and cloud kitchen segments, and the alignment of recurring revenue models with operator preferences for low-risk, scalable technology investment.
- By Intelligence Level
On the basis of intelligence level, the U.K. restaurant POS market is segmented into traditional POS, cloud-enabled POS, real-time analytics POS, AI-enabled POS, smart inventory POS, customer behavior analytics POS, predictive analytics POS, generative AI POS, and others. The Traditional POS segment dominated the market with a 29.16% share in 2025, reflecting the still-significant installed base of legacy systems across independent restaurants, established chains, and hospitality operators that have not yet completed technology modernization.
The Predictive Analytics POS segment is expected to witness the fastest CAGR from 2026 to 2033, growing with a CAGR of 8.06% driven by its relatively smaller current installed base and strong future growth potential as AI and machine learning capabilities become more accessible through cloud platforms. Growing operator demand for demand forecasting, dynamic pricing, and inventory optimization is accelerating adoption of predictive analytics modules within restaurant POS ecosystems.
- By Outlet Type
On the basis of outlet type, the U.K. restaurant POS market is segmented into single-outlet POS and multi-outlet POS. The Single-Outlet POS segment dominated the market with a 63.42% share in 2025, reflecting the dominance of independent restaurant operators across the U.K. foodservice sector that operate individual locations requiring standalone, affordable POS systems with essential transaction, payment, and order management capabilities.
The Multi-Outlet POS segment is expected to witness the fastest CAGR from 2026 to 2033, growing with a CAGR of 7.23%, driven by expanding restaurant chains, franchise operators, and hospitality groups that require centralized POS management, unified analytics, and multi-location configuration capabilities. Higher technology investment levels and the increasing adoption of enterprise-grade cloud POS platforms are reinforcing the growth trajectory of the multi-outlet segment.
- By Functional Module
On the basis of functional module, the U.K. restaurant POS market is segmented into order & billing management, inventory & procurement management, customer engagement, business intelligence & analytics, kitchen operations, and workforce management. The Order & Billing Management segment dominated the market with a 28.84% share in 2025, reflecting its role as the core functional requirement of every restaurant POS system, with widespread adoption across table-side ordering, menu management, and split billing applications supported by tablet and mobile POS deployments.
The Business Intelligence & Analytics segment is expected to witness the fastest CAGR from 2026 to 2033, growing with a CAGR of 7.70% driven by increasing operator reliance on data-driven decision-making, growing investment in sales analytics and operational efficiency monitoring, and the proliferation of real-time dashboard and reporting tools embedded within cloud-based POS platforms across independent and chain restaurant operators.
- By Payment Capability
On the basis of payment capability, the U.K. restaurant POS market is segmented into contactless payments, card payments, digital wallet payments, cash payments, QR code payments, and buy now pay later (BNPL). The Contactless Payments segment dominated the market with a 31.76% share in 2025, underpinned by the U.K.'s position as one of the world's leading contactless payment adoption markets, where tap-to-pay transactions account for a significant majority of in-store card spending and NFC-enabled terminals are near-universally deployed across restaurant formats.
The Contactless Payments segment is also expected to witness the fastest CAGR from 2026 to 2033, growing with a CAGR of 7.19%, driven by continued growth in tap-to-pay transaction volumes, expanding adoption of wearable payment devices, and increasing operator investment in NFC-enabled POS hardware that supports both consumer contactless cards and digital wallet platforms across QSRs, cafés, and casual dining establishments.
- By Integration Ecosystem
On the basis of integration ecosystem, the U.K. restaurant POS market is segmented into food delivery platforms, online ordering platforms, accounting software, CRM platforms, mobile applications, reservation management platforms, ERP systems, and others. The Food Delivery Platforms segment dominated the market with a 24.64% share in 2025, reflecting the critical role of Deliveroo, Just Eat, and Uber Eats integrations in enabling restaurants to consolidate third-party delivery orders directly into the POS workflow, reducing manual reconciliation and improving kitchen coordination across high-volume foodservice operators.
The Online Ordering Platforms segment is expected to witness the fastest CAGR from 2026 to 2033, growing with a CAGR of 7.38%, driven by rapid expansion of direct digital ordering channels among independent restaurants and chains seeking to reduce third-party commission costs, increase customer data ownership, and deliver personalized ordering experiences through branded web and app-based platforms integrated with cloud POS systems.
- By Restaurant Type
On the basis of restaurant type, the U.K. restaurant POS market is segmented into QSR (quick service restaurants), FSR (full service restaurants), cafés & bakeries, bars, cloud kitchens, catering, stadium restaurants, airline restaurants, and others. The QSR (Quick Service Restaurants) segment dominated the market with a 23.10% share in 2025, driven by high transaction volumes, extensive deployment of self-service kiosk POS systems, digital menu boards, and deep integration with delivery and mobile ordering platforms across major fast food chains and takeaway operators.
The Cafés & Bakeries segment is expected to witness the fastest CAGR from 2026 to 2033, growing with a CAGR of 7.59%, driven by rapid expansion of delivery-only foodservice operations, heavy reliance on digital ordering and cloud POS platforms for order aggregation and kitchen management, and the capital-light business model that makes cloud kitchen operators among the most technology-forward segment of the U.K. restaurant market.
- By End User
On the basis of end user, the U.K. restaurant POS market is segmented into independent restaurants, restaurant chains & franchises, hotels & hospitality groups, cloud kitchens, catering & event service providers, and institutional foodservice operators. The Independent Restaurants segment dominated the market with a 41.84% share in 2025, reflecting the large number of single-operator foodservice establishments across the U.K. that adopt affordable, entry-level and cloud-based POS solutions for payment processing, order management, and basic operational reporting. Budget constraints and lower technology spending relative to chain operators limit individual system values but sustain the segment's volume-driven market leadership.
The Cloud Kitchens segment is expected to witness the fastest CAGR from 2026 to 2033, growing with a CAGR of 7.47%, driven by online food delivery expansion, heavy digital ordering platform integration, and the delivery-centric operational model that depends on seamless cloud POS functionality for order aggregation, kitchen display management, and real-time performance tracking across virtual restaurant brands.
U.K. Restaurant POS Market Share
The U.K. restaurant POS industry is primarily led by well-established companies, including:
- Zonal Retail Data Systems Ltd. (U.K.)
- Epos Now Ltd. (U.K.)
- iCRTouch Ltd. (U.K.)
- Tevalis Ltd. (U.K.)
- PosAppt Ltd. (U.K.)
- TISSL Ltd. (U.K.)
- NFS Hospitality (U.K.)
- The Access Group (U.K.)
- Kobas Ltd. (U.K.)
- Syrve (Cyprus)
- Toast, Inc. (U.S.)
- TouchBistro Inc. (Canada)
- Lightspeed Commerce Inc. (Canada)
- Block (Square) (U.S.)
- PAR Technology Corporation (U.S.)
- NCR Voyix Corporation (U.S.)
- Oracle Corporation (U.S.)
- Clover Network LLC (U.S.)
- SumUp Payments Limited (U.K.)
- Revel Systems Inc. (U.S.)
Latest Developments in U.K. Restaurant POS Market
- In April 2026, Toast launched its Toast Go 3 handheld point-of-sale (POS) device in the United Kingdom, Ireland, Canada, and Australia, building on Toast’s years of innovation that powers billions of orders and helps restaurant and retail operators deliver consistent, high-quality guest experiences across increasingly complex operating environments.
- In May 2026, Lightspeed Commerce Inc., announced the appointment of Bhawna Singh as Chief Technology Officer, alongside a new wave of product innovations designed to help merchants streamline operations, drive revenue growth and deliver more seamless customer experiences across channels. The announcements come as retailers and hospitality operators face mounting pressure to operate more efficiently while delivering differentiated customer experiences.
- In April 2026, Block, Inc. (NYSE: XYZ) today announced a comprehensive global partnership with Uber Technologies, Inc. (NYSE: UBER) that expands restaurant operations capabilities across multiple markets and payment flexibility in the U.S. This partnership demonstrates Block’s ecosystem approach to serving both sides of the counter, bringing Square’s native Uber Eats integration to international markets, while introducing Cash App Pay to Uber and Uber Eats in the U.S.
- In December 2021, Square, Inc. announced the change of its name to Block. Block is the name for the company as a corporate entity. The Square name has become synonymous with the company’s Seller business, which provides an integrated ecosystem of commerce solutions, business software, and banking services for sellers, and this move allows the Seller business to own the Square brand it was built for.
- In April 2026, PAR Technology Corporation announced the launch of PAR Intelligence, the agentic AI layer designed to help multi-unit operators make every store their most profitable store. Unlike a point solution or a standalone AI tool, PAR Intelligence is a platform-wide agentic layer woven through the PAR product ecosystem. PAR Intelligence sees the opportunity, makes the call, and delivers the outcome
SKU-

- Interactive Data Analysis Dashboard
- Company Analysis Dashboard for high growth potential opportunities
- Research Analyst Access for customization & queries
- Competitor Analysis with Interactive dashboard
- Latest News, Updates & Trend analysis
- Harness the Power of Benchmark Analysis for Comprehensive Competitor Tracking
Table of Content
1 INTRODUCTION
1.1 OBJECTIVES OF THE STUDY
1.2 MARKET DEFINITION
1.3 OVERVIEW OF U.K. RESTAURANT POS MARKET
1.4 LIMITATIONS
1.5 MARKETS COVERED
2 MARKET SEGMENTATION
2.1 MARKETS COVERED
2.2 GEOGRAPHICAL SCOPE
2.3 YEARS CONSIDERED FOR THE STUDY
2.4 DBMR TRIPOD DATA VALIDATION MODEL
2.5 PRIMARY INTERVIEWS WITH KEY OPINION LEADERS
2.6 DBMR MARKET POSITION GRID
2.7 VENDOR SHARE ANALYSIS
2.8 MULTIVARIATE MODELING
2.9 ENTERPRISE SIZE TIMELINE CURVE
2.1 U.K. RESTAURANT POS MARKET END USER COVERAGE GRID
2.11 SECONDARY SOURCES
2.12 ASSUMPTIONS
3 EXECUTIVE SUMMARY
4 PREMIUM INSIGHTS
4.1 PORTER’S FIVE FORCES ANALYSIS
4.1.1 INTRODUCTION
4.1.2 INTENSITY OF COMPETITIVE RIVALRY (HIGH)
4.1.3 BARGAINING POWER OF BUYERS – HIGH
4.1.4 THREAT OF NEW ENTRANTS – MODERATE
4.1.5 THREAT OF SUBSTITUTE PRODUCTS – MODERATE
4.1.6 BARGAINING POWER OF SUPPLIERS – MODERATE
4.1.7 CONCLUSION
4.2 PATENT ANALYSIS
4.2.1 PATENT LANDSCAPE OVERVIEW
4.2.2 PATENT FILING TREND ANALYSIS
4.2.3 GEOGRAPHIC PATENT DISTRIBUTION
4.2.4 LEADING PATENT APPLICANTS
4.2.5 TECHNOLOGY CLASSIFICATION ANALYSIS
4.2.6 EMERGING INNOVATION THEMES
4.2.6.1 CLOUD-NATIVE RESTAURANT MANAGEMENT
4.2.6.2 CONTACTLESS AND MOBILE PAYMENTS
4.2.6.3 ARTIFICIAL INTELLIGENCE AND PREDICTIVE ANALYTICS
4.2.6.4 OMNICHANNEL COMMERCE INTEGRATION
4.2.6.5 CUSTOMER EXPERIENCE PERSONALIZATION
4.2.7 STRATEGIC IMPLICATIONS FOR THE U.K. RESTAURANT POS MARKET
4.3 VALUE CHAIN ANALYSIS
4.3.1 SOFTWARE PLATFORM DEVELOPMENT & CORE POS FUNCTIONALITY (25%–30%)
4.3.2 HARDWARE, PAYMENTS & TRANSACTION ENABLEMENT (20%–25%)
4.3.3 INTEGRATIONS, DIGITAL ORDERING & DATA CONNECTIVITY (20%–25%)
4.3.4 IMPLEMENTATION, TRAINING, SUPPORT & END-USER OPERATIONS (25%–35%)
4.3.5 CONCLUSION
4.4 STRATEGIC OUTLOOK AND FUTURE OPPORTUNITIES
4.4.1 STRATEGIC OUTLOOK
4.4.2 FUTURE OPPORTUNITIES
4.5 IMPACT OF WAR ON SUPPLY CHAIN, GEOGRAPHIC FOOTPRINT & STRUCTURAL SHIFTS AND ADAPTIVE STRATEGIES
4.5.1 SUPPLY CHAIN RESILIENCE
4.5.2 STRATEGIC DECISIONS
4.5.2.1 DIVERSIFICATION OF HARDWARE SUPPLIERS ACROSS REGIONS
4.5.2.2 MULTI-PROCESSOR DEPLOYMENT FOR DEVICE RELIABILITY
4.5.2.3 EDGE NETWORK INFRASTRUCTURE TO ENSURE PAYMENT CONTINUITY
4.5.2.4 REDUNDANT INTERNET PROVIDERS FOR UNINTERRUPTED TRANSACTIONS
4.5.2.5 STRATEGIC PARTNERSHIPS WITH U.K. IT LOGISTICS
4.5.2.6 ALTERNATIVE HARDWARE SOURCING DURING SHOCKS
4.5.3 ENERGY & LABORATORY OPERATIONAL COST RISK
4.5.4 STRATEGIC DECISIONS
4.5.4.1 RISING POWER COSTS IMPACTING LARGE CHAIN RESTAURANT INSTALLS
4.5.4.2 INCREASED OPERATING COSTS FOR PAYMENT PROCESSING
4.5.4.3 LONG-TERM DEVICE LEASE CONTRACTS TO CONTROL COSTS
4.5.4.4 OPTIMIZING SOFTWARE FOR PERFORMANCE
4.5.4.5 MIGRATION TO ENERGY-EFFICIENT POS HARDWARE
4.5.4.6 USE OF RENEWABLE ENERGY AT MAJOR SITES
4.5.5 GEOGRAPHIC FOOTPRINT REASSESSMENT
4.5.6 STRATEGIC DECISIONS
4.5.6.1 EXPANSION OF FIELD SERVICES TO REMOTE LOCATIONS ACROSS U.K.
4.5.6.2 DIVERSIFICATION OF DEPLOYMENT PARTNERS
4.5.6.3 RELOCATION OF SUPPORT OPERATIONS TO STABLE REGIONS IN U.K.
4.5.6.4 GROWTH OF MOBILE POS IN RURAL VS URBAN AREAS
4.5.6.5 DECENTRALIZED SERVICE PROVIDERS FOR MULTI-LOCATION CHAINS
4.5.7 SCENARIO PLANNING & RISK MANAGEMENT
4.5.8 STRATEGIC DECISIONS
4.5.8.1 SCALING SUPPORT TEAMS FOR CRISIS RESPONSE
4.5.8.2 BACKUP DATA CENTERS FOR PAYMENT DATA
4.5.8.3 PARTNERING WITH FINANCIAL INSTITUTIONS FOR FRAUD MITIGATION
4.5.8.4 MULTI-HOSTING FOR CLOUD POS SERVICES
4.5.8.5 ENHANCING CYBERSECURITY FOR PAYMENT NETWORKS
4.5.9 CASH & FINANCIAL PROTECTION
4.5.10 STRATEGIC DECISIONS
4.5.10.1 DIVERSIFYING PAYMENT INTEGRATION PARTNERS
4.5.10.2 CYBER INSURANCE FOR TRANSACTION RISKS
4.5.10.3 FINANCIAL HEDGING AGAINST FOREIGN COMPONENT COSTS
4.5.10.4 DYNAMIC PRICING STRATEGIES FOR RESTAURANT SUBSCRIPTIONS
4.5.10.5 CREDIT LINES FOR SMES USING POS FINANCE
4.5.11 CYBERSECURITY & DATA PROTECTION
4.5.12 STRATEGIC DECISIONS
4.5.12.1 ENCRYPTED PAYMENT FLOWS FOR RESTAURANTS
4.5.12.2 DATA RESIDENCY AND COMPLIANCE SOLUTIONS
4.5.12.3 IMPLEMENTING E2E ENCRYPTION STANDARDS
4.5.12.4 GDPR-CONFORMANT CUSTOMER DATA MANAGEMENT
4.5.12.5 SUPPLY CHAIN CYBERSECURITY STANDARDS
4.5.13 NEW BUSINESS & EMERGING REVENUE OPPORTUNITIES & FUTURE OUTLOOK
4.6 NEW BUSINESS AND EMERGING BUSINESS REVENUE OPPORTUNITIES & FUTURE OUTLOOK
4.6.1 NEW BUSINESS REVENUE OPPORTUNITIES
4.6.2 CONCLUSION
4.7 PENETRATION AND GROWTH PROSPECT MAPPING
4.7.1 OVERVIEW
4.7.2 OVERALL MARKET DYNAMICS:
4.8 DYNAMICS IN UK MARKET
4.8.1 REGULATORY COMPLIANCE REQUIREMENTS
4.8.2 DIGITAL TRANSFORMATION INITIATIVES
4.8.3 DATA SECURITY AND PRIVACY CONCERNS
4.8.4 TECHNOLOGY TRENDS
4.8.5 CHANGING CUSTOMER EXPECTATIONS
4.9 MARKET DRIVERS AND DEMAND CATALYSTS
4.9.1 PROCESS AUTOMATION
4.9.2 FINANCE DIGITALIZATION
4.9.3 CLOUD ADOPTION
4.9.4 REAL-TIME FINANCIAL MANAGEMENT
4.9.5 OPERATIONAL EFFICIENCY
4.9.6 REGULATORY COMPLIANCE
4.9.7 EVOLVING CUSTOMER NEEDS
4.1 PRICING ANALYSIS
4.10.1 INTRODUCTION TO PRICING DYNAMICS IN THE UK RESTAURANT POS MARKET
4.10.2 HISTORICAL EVOLUTION OF PRICING STRUCTURES
4.10.3 EVOLUTION OF SOFTWARE PRICING
4.10.4 HARDWARE PRICING ANALYSIS
4.10.5 SERVICES PRICING AND COMMERCIAL CONSIDERATIONS
4.10.6 KEY FACTORS INFLUENCING PRICING ACROSS THE VALUE CHAIN
4.10.7 IMPACT OF CLOUD ADOPTION ON PRICING MODELS
4.10.8 INFLUENCE OF DIGITAL TRANSFORMATION TRENDS
4.10.9 COMPETITIVE DYNAMICS AND VENDOR PRICING STRATEGIES
4.10.10 PATENT AND INTELLECTUAL PROPERTY CONSIDERATIONS
4.10.11 TOTAL COST OF OWNERSHIP CONSIDERATIONS
4.10.12 FUTURE PRICING OUTLOOK
4.10.13 STRATEGIC IMPLICATIONS FOR MARKET PARTICIPANTS
4.11 AI-DRIVEN EXPANSION OPPORTUNITIES
4.11.1 PREDICTIVE ANALYTICS
4.11.2 INTELLIGENT AUTOMATION
4.11.2.1 YUM! BRANDS AI AND AUTOMATION INVESTMENTS
4.11.3 FRAUD DETECTION
4.11.3.1 DECISION SUPPORT
4.11.3.2 CONVERSATIONAL AI
4.11.3.3 PRODUCT INNOVATION
4.11.3.4 AI ADOPTION OUTLOOK
4.11.4 LOYALTY AND CUSTOMER ECOSYSTEMS
4.11.4.1 CUSTOMER-CENTRIC ECOSYSTEMS
4.11.4.2 LOYALTY PROGRAMS
4.11.4.3 PERSONALIZATION AND ANALYTICS
4.11.4.4 CUSTOMER ENGAGEMENT
4.11.4.5 REVENUE ENHANCEMENT
4.11.4.6 ECOSYSTEM PARTNERSHIPS
4.11.4.7 CUSTOMER EXPERIENCE
4.11.5 DIGITAL PAYMENTS AND MARKET DYNAMICS
4.11.5.1 MARKET GROWTH OUTLOOK
4.11.5.2 PAYPAL AND ALTERNATIVE PLATFORMS
4.11.5.3 DIGITAL WALLETS
4.11.5.4 OPEN BANKING
4.11.5.5 EMBEDDED FINANCE
4.11.5.6 REAL-TIME PAYMENTS
4.11.5.7 BNPL TRENDS
4.11.5.8 COMPETITIVE DYNAMICS
4.11.6 STRATEGIC OUTLOOK AND OPPORTUNITIES
4.11.6.1 GROWTH PROSPECTS
4.11.6.2 HIGH-GROWTH SEGMENTS
4.11.6.3 EMERGING TECHNOLOGIES
4.11.6.4 INVESTMENT HOTSPOTS
4.11.6.5 PARTNERSHIP OPPORTUNITIES
4.11.6.6 COMPETITIVE POSITIONING
4.11.6.7 STRATEGIC PRIORITIES
4.11.6.8 FUTURE ROADMAP
4.12 COMPANY EVALUATION QUADRANT
4.12.1 OVERVIEW
4.12.2 HOSPITALITY POS VENDOR COMPARISON
4.12.3 COMPANY COMPARATIVE ANALYSIS
4.12.4 MARKET INSIGHTS AND KEY FINDINGS
4.12.5 CONCLUSION
5 TARIFF & ITS ANALYSIS
5.1 OVERVIEW OF RELEVANT TARIFFS
5.2 TRADE POLICIES INFLUENCING THE MARKET
5.3 COST IMPACT ON STAKEHOLDERS
5.4 SUPPLY CHAIN DISRUPTIONS
5.5 STRATEGIC RESPONSE BY POS MANUFACTURERS
6 REGULATORY STANDARDS
6.1 INTRODUCTION
6.2 REGULATORY FRAMEWORKS
6.3 CERTIFIED STANDARDS
6.4 SAFETY AND COMPLIANCE STANDARDS
6.4.1 DATA HANDLING & STORAGE
6.4.2 CYBERSECURITY & OPERATIONAL RESILIENCE
6.4.3 HAZARD IDENTIFICATION
6.5 CONCLUSION
7 MARKET OVERVIEW
7.1 DRIVERS
7.1.1 RISING NEED TO IMPROVE RESTAURANT OPERATIONAL EFFICIENCY AMID LABOUR COST PRESSURE
7.1.2 GROWING ADOPTION OF DIGITAL PAYMENT ACCEPTANCE AND IN-RESTAURANT ORDER AUTOMATION
7.1.3 INCREASING NEED FOR REAL-TIME SALES, INVENTORY, AND OUTLET PERFORMANCE VISIBILITY
7.2 RESTRAINTS
7.2.1 HIGH INITIAL AND RECURRING POS DEPLOYMENT COSTS FOR SMALL INDEPENDENT RESTAURANTS
7.2.2 DEPENDENCE ON LEGACY EPOS/TILL INFRASTRUCTURE AND MIGRATION HESITATION
7.3 OPPORTUNITIES
7.3.1 EXPANSION OF AI-POWERED PREDICTIVE POS CAPABILITIES FOR DEMAND FORECASTING AND WASTE REDUCTION
7.3.2 EXPANSION OPPORTUNITY IN UNDERSERVED INDEPENDENT RESTAURANTS AND REGIONAL FOODSERVICE OPERATORS THROUGH AFFORDABLE MODULAR CLOUD POS SOLUTIONS
7.4 CHALLENGES
7.4.1 RISING CYBERSECURITY AND PAYMENT DATA PROTECTION RISKS IN CONNECTED POS ENVIRONMENTS
7.4.2 COMPLEXITY IN INTEGRATING POS PLATFORMS WITH DELIVERY APPS, LOYALTY SYSTEMS, AND BACK-END RESTAURANT SOFTWARE
8 U.K. RESTAURANT POS MARKET, BY OFFERING
8.1 OVERVIEW
8.2 HARDWARE
8.3 SOFTWARE
8.4 SERVICES
8.5 U.K. HARDWARE IN RESTAURANT POS MARKET, BY TYPE , 2018-2033 (USD THOUSAND)
8.5.1 PAYMENT TERMINALS
8.5.2 TABLET
8.5.3 KITCHEN DISPLAY SYSTEMS (KDS)
8.5.4 RECEIPT PRINTERS
8.5.5 PC MONITOR
8.5.6 NETWORKING EQUIPMENT
8.5.7 CASH DRAWERS
8.5.8 BARCODE SCANNERS
8.5.9 MOBILE PHONE
8.5.10 OTHERS
8.6 U.K. PAYMENT TERMINALS IN RESTAURANT POS MARKET, BY TYPE, 2018-2033 (USD THOUSAND)
8.6.1 NFC/CONTACTLESS READERS
8.6.2 CREDIT/DEBIT CARD READERS
8.7 U.K. RECEIPT PRINTERS IN RESTAURANT POS MARKET, BY TYPE, 2018-2033 (USD THOUSAND)
8.7.1 THERMAL PRINTERS
8.7.2 IMPACT/DOT MATRIX PRINTERS
8.8 U.K. CASH DRAWERS IN RESTAURANT POS MARKET, BY TYPE, 2018-2033 (USD THOUSAND)
8.8.1 AUTOMATIC
8.8.2 MANUAL
8.9 U.K. BARCODE SCANNERS IN RESTAURANT POS MARKET, BY TYPE, 2018-2033 (USD THOUSAND)
8.9.1 1D/2D HANDHELD SCANNERS
8.9.2 BUILT-IN SCANNER MODULES
8.1 U.K. SOFTWARE IN RESTAURANT POS MARKET, BY TYPE , 2018-2033 (USD THOUSAND)
8.10.1 PAYMENT PROCESSING & CHECKOUT
8.10.2 ORDER MANAGEMENT
8.10.3 REPORTING & ANALYTICS
8.10.4 INVENTORY & PURCHASING
8.10.5 ORDERING & DELIVERY ORCHESTRATION
8.10.6 CRM
8.10.7 WORKFORCE & LABOR MANAGEMENT
8.10.8 INTEGRATIONS & API
8.10.9 MULTI-LOCATION MANAGEMENT
8.10.10 REGULATORY COMPLIANCE MODULES
8.10.11 OTHERS
8.11 U.K. SERVICES IN RESTAURANT POS MARKET, BY TYPE, 2018-2033 (USD THOUSAND)
8.11.1 PROFESSIONAL SERVICES
8.11.2 MANAGED SERVICES
8.12 U.K. PROFESSIONAL SERVICES IN RESTAURANT POS MARKET, BY TYPE, 2018-2033 (USD THOUSAND)
8.12.1 IMPLEMENTATION AND INTEGRATION
8.12.2 TRAINING & SUPPORT
8.12.3 CONSULTING
9 U.K. RESTAURANT POS MARKET, BY POS SYSTEM TYPE
9.1 OVERVIEW
9.2 U.K. RESTAURANT POS MARKET, BY POS SYSTEM TYPE, 2018-2033 (USD THOUSAND)
9.2.1 FIXED TERMINAL POS
9.2.2 MOBILE POS (MPOS) SYSTEM
9.2.3 TABLET POS SYSTEM
9.2.4 WEB-BASED POS
9.2.5 SELF-SERVICE KIOSK POS SYSTEM
9.2.6 TERMINAL POS SYSTEM
9.2.7 OTHERS
10 U.K. RESTAURANT POS MARKET, BY DEPLOYMENT MODE
10.1 OVERVIEW
10.2 U.K. RESTAURANT POS MARKET, BY DEPLOYMENT MODE, 2018-2033 (USD THOUSAND)
10.2.1 CLOUD
10.2.2 ON PREMISE
10.2.3 HYBRID
10.3 U.K. CLOUD IN RESTAURANT POS MARKET, BY TYPE, 2018-2033 (USD THOUSAND)
10.3.1 PUBLIC
10.3.2 HYBRID
10.3.3 PRIVATE
11 U.K. RESTAURANT POS MARKET, BY ENTERPRISE SIZE
11.1 OVERVIEW
11.2 U.K. RESTAURANT POS MARKET, BY ENTERPRISE SIZE, 2018-2033 (USD THOUSAND)
11.2.1 LARGE CHAIN RESTAURANTS
11.2.2 MEDIUM CHAIN RESTAURANTS
11.2.3 SMALL RESTAURANTS
12 U.K. RESTAURANT POS MARKET, BY OPERATING SYSTEM
12.1 OVERVIEW
12.2 U.K. RESTAURANT POS MARKET, BY OPERATING SYSTEM, 2018-2033 (USD THOUSAND)
12.2.1 ANDROID
12.2.2 WINDOWS
12.2.3 MAC
12.2.4 LINUX
12.2.5 OTHERS
13 U.K. RESTAURANT POS MARKET, BY REVENUE MODEL
13.1 OVERVIEW
13.2 U.K. RESTAURANT POS MARKET, BY REVENUE MODEL, 2018-2033 (USD THOUSAND)
13.2.1 SUBSCRIPTION
13.2.2 ONE TIME LICENSE
13.2.3 FREEMIUM
13.2.4 OTHERS
13.3 U.K. SUBSCRIPTION IN RESTAURANT POS MARKET, BY TYPE, 2018-2033 (USD THOUSAND)
13.3.1 MONTHLY
13.3.2 YEARLY
13.3.3 QUARTERLY
14 U.K. RESTAURANT POS MARKET, BY INTELLIGENCE LEVEL
14.1 OVERVIEW
14.2 TRADITIONAL POS
14.3 CLOUD-ENABLED POS
14.4 REAL-TIME ANALYTICS POS
14.5 AI-ENABLED POS
14.6 SMART INVENTORY POS
14.7 CUSTOMER BEHAVIOR ANALYTICS POS
14.8 PREDICTIVE ANALYTICS POS
14.9 GENERATIVE AI POS
14.1 OTHERS
15 U.K. RESTAURANT POS MARKET, BY OUTLET TYPE
15.1 OVERVIEW
15.2 U.K. RESTAURANT POS MARKET, BY OUTLET TYPE, 2018-2033 (USD THOUSAND)
15.2.1 SINGLE-OUTLET POS
15.2.2 MULTI-OUTLET POS
16 U.K. RESTAURANT POS MARKET, BY FUNCTIONAL MODULE
16.1 OVERVIEW
16.2 U.K. RESTAURANT POS MARKET, BY FUNCTIONAL MODULE, 2018-2033 (USD THOUSAND)
16.2.1 ORDER & BILLING MANAGEMENT
16.2.2 INVENTORY & PROCUREMENT MANAGEMENT
16.2.3 CUSTOMER ENGAGEMENT
16.2.4 BUSINESS INTELLIGENCE & ANALYTICS
16.2.5 KITCHEN OPERATIONS
16.2.6 WORKFORCE MANAGEMENT
16.3 U.K. ORDER & BILLING MANAGEMENT IN RESTAURANT POS MARKET, BY TYPE, 2018-2033 (USD THOUSAND)
16.3.1 TABLE-SIDE ORDERING
16.3.2 MENU MANAGEMENT
16.3.3 SPLIT BILLING
16.4 U.K. INVENTORY & PROCUREMENT MANAGEMENT IN RESTAURANT POS MARKET, BY TYPE, 2018-2033 (USD THOUSAND)
16.4.1 INVENTORY TRACKING
16.4.2 INGREDIENT MANAGEMENT
16.4.3 SUPPLIER MANAGEMENT
16.5 U.K. CUSTOMER ENGAGEMENT IN RESTAURANT POS MARKET, BY TYPE, 2018-2033 (USD THOUSAND)
16.5.1 LOYALTY PROGRAMS
16.5.2 CUSTOMER ANALYTICS
16.5.3 PROMOTIONS & DISCOUNTS
16.6 U.K. BUSINESS INTELLIGENCE & ANALYTICS IN RESTAURANT POS MARKET, BY TYPE, 2018-2033 (USD THOUSAND)
16.6.1 SALES ANALYTICS
16.6.2 OPERATIONAL ANALYTICS
16.7 U.K. KITCHEN OPERATIONS IN RESTAURANT POS MARKET, BY TYPE, 2018-2033 (USD THOUSAND)
16.7.1 KITCHEN DISPLAY SYSTEMS
16.7.2 ORDER ROUTING
16.8 U.K. WORKFORCE MANAGEMENT IN RESTAURANT POS MARKET, BY TYPE, 2018-2033 (USD THOUSAND)
16.8.1 SCHEDULING
16.8.2 ATTENDANCE TRACKING
17 U.K. RESTAURANT POS MARKET, BY PAYMENT CAPABILITY
17.1 OVERVIEW
17.2 U.K. RESTAURANT POS MARKET, BY PAYMENT CAPABILITY, 2018-2033 (USD THOUSAND)
17.2.1 CONTACTLESS PAYMENTS
17.2.2 CARD PAYMENTS
17.2.3 DIGITAL WALLET PAYMENTS
17.2.4 CASH PAYMENTS
17.2.5 QR CODE PAYMENTS
17.2.6 BUY NOW PAY LATER (BNPL)
18 U.K. RESTAURANT POS MARKET, BY INTEGRATION ECOSYSTEM
18.1 OVERVIEW
18.2 U.K. RESTAURANT POS MARKET, BY INTEGRATION ECOSYSTEM, 2018-2033 (USD THOUSAND)
18.2.1 FOOD DELIVERY PLATFORMS
18.2.2 ONLINE ORDERING PLATFORMS
18.2.3 ACCOUNTING SOFTWARE
18.2.4 CRM PLATFORMS
18.2.5 MOBILE APPLICATIONS
18.2.6 RESERVATION MANAGEMENT PLATFORMS
18.2.7 ERP SYSTEMS
18.2.8 OTHERS
19 U.K. RESTAURANT POS MARKET, BY RESTAURANT TYPE
19.1 OVERVIEW
19.2 U.K. RESTAURANT POS MARKET, BY RESTAURANT TYPE, 2018-2033 (USD THOUSAND)
19.2.1 QSR (QUICK SERVICE RESTAURANTS)
19.2.2 FSR (FULL SERVICE RESTAURANTS)
19.2.3 CAFÉS & BAKERIES
19.2.4 BARS
19.2.5 CLOUD KITCHENS
19.2.6 CATERING
19.2.7 STADIUM RESTAURANTS
19.2.8 AIRLINE RESTAURANTS
19.2.9 OTHERS
19.3 U.K. QSR (QUICK SERVICE RESTAURANTS) IN RESTAURANT POS MARKET, BY CATEGORY, 2018-2033 (USD THOUSAND)
19.3.1 FAST FOOD CHAINS
19.3.2 TAKEAWAY RESTAURANTS
19.3.3 FOOD TRUCKS
19.3.4 OTHERS
19.4 U.K. QSR (QUICK SERVICE RESTAURANTS) IN RESTAURANT POS MARKET, BY POS SYSTEM TYPE, 2018-2033 (USD THOUSAND)
19.4.1 FIXED TERMINAL POS
19.4.2 MOBILE POS (MPOS) SYSTEM
19.4.3 TABLET POS SYSTEM
19.4.4 TERMINAL POS SYSTEM
19.4.5 WEB-BASED POS
19.4.6 SELF-SERVICE KIOSK POS SYSTEM
19.4.7 OTHERS
19.5 U.K. FSR (FULL SERVICE RESTAURANTS) IN RESTAURANT POS MARKET, BY CATEGORY, 2018-2033 (USD THOUSAND)
19.5.1 CASUAL DINING
19.5.2 FINE DINING
19.6 U.K. FSR (FULL SERVICE RESTAURANTS) IN RESTAURANT POS MARKET, BY POS SYSTEM TYPE, 2018-2033 (USD THOUSAND)
19.6.1 FIXED TERMINAL POS
19.6.2 MOBILE POS (MPOS) SYSTEM
19.6.3 TABLET POS SYSTEM
19.6.4 TERMINAL POS SYSTEM
19.6.5 WEB-BASED POS
19.6.6 SELF-SERVICE KIOSK POS SYSTEM
19.6.7 OTHERS
19.7 U.K. CAFÉS & BAKERIES IN RESTAURANT POS MARKET, BY POS SYSTEM TYPE, 2018-2033 (USD THOUSAND)
19.7.1 FIXED TERMINAL POS
19.7.2 MOBILE POS (MPOS) SYSTEM
19.7.3 TABLET POS SYSTEM
19.7.4 TERMINAL POS SYSTEM
19.7.5 WEB-BASED POS
19.7.6 SELF-SERVICE KIOSK POS SYSTEM
19.7.7 OTHERS
19.8 U.K. BARS IN RESTAURANT POS MARKET, BY POS SYSTEM TYPE, 2018-2033 (USD THOUSAND)
19.8.1 FIXED TERMINAL POS
19.8.2 MOBILE POS (MPOS) SYSTEM
19.8.3 TABLET POS SYSTEM
19.8.4 TERMINAL POS SYSTEM
19.8.5 WEB-BASED POS
19.8.6 SELF-SERVICE KIOSK POS SYSTEM
19.8.7 OTHERS
19.9 U.K. CLOUD KITCHENS IN RESTAURANT POS MARKET, BY POS SYSTEM TYPE, 2018-2033 (USD THOUSAND)
19.9.1 WEB-BASED POS
19.9.2 MOBILE POS (MPOS) SYSTEM
19.9.3 TABLET POS SYSTEM
19.9.4 FIXED TERMINAL POS
19.9.5 TERMINAL POS SYSTEM
19.9.6 SELF-SERVICE KIOSK POS SYSTEM
19.9.7 OTHERS
19.1 U.K. CATERING IN RESTAURANT POS MARKET, BY POS SYSTEM TYPE, 2018-2033 (USD THOUSAND)
19.10.1 MOBILE POS (MPOS) SYSTEM
19.10.2 TABLET POS SYSTEM
19.10.3 FIXED TERMINAL POS
19.10.4 WEB-BASED POS
19.10.5 TERMINAL POS SYSTEM
19.10.6 SELF-SERVICE KIOSK POS SYSTEM
19.10.7 OTHERS
19.11 U.K. STADIUM RESTAURANTS IN RESTAURANT POS MARKET, BY POS SYSTEM TYPE, 2018-2033 (USD THOUSAND)
19.11.1 MOBILE POS (MPOS) SYSTEM
19.11.2 SELF-SERVICE KIOSK POS SYSTEM
19.11.3 FIXED TERMINAL POS
19.11.4 TABLET POS SYSTEM
19.11.5 WEB-BASED POS
19.11.6 TERMINAL POS SYSTEM
19.11.7 OTHERS
19.12 U.K. AIRLINE RESTAURANTS IN RESTAURANT POS MARKET, BY POS SYSTEM TYPE, 2018-2033 (USD THOUSAND)
19.12.1 MOBILE POS (MPOS) SYSTEM
19.12.2 TABLET POS SYSTEM
19.12.3 WEB-BASED POS
19.12.4 FIXED TERMINAL POS
19.12.5 TERMINAL POS SYSTEM
19.12.6 SELF-SERVICE KIOSK POS SYSTEM
19.12.7 OTHERS
19.13 U.K. OTHERS IN RESTAURANT POS MARKET, BY POS SYSTEM TYPE, 2018-2033 (USD THOUSAND)
19.13.1 MOBILE POS (MPOS) SYSTEM
19.13.2 TABLET POS SYSTEM
19.13.3 WEB-BASED POS
19.13.4 FIXED TERMINAL POS
19.13.5 TERMINAL POS SYSTEM
19.13.6 SELF-SERVICE KIOSK POS SYSTEM
19.13.7 OTHERS
20 U.K. RESTAURANT POS MARKET, BY END USER
20.1 OVERVIEW
20.2 U.K. RESTAURANT POS MARKET, BY END USER, 2018-2033 (USD THOUSAND)
20.2.1 INDEPENDENT RESTAURANTS
20.2.2 RESTAURANT CHAINS & FRANCHISES
20.2.3 HOTELS & HOSPITALITY GROUPS
20.2.4 CLOUD KITCHENS
20.2.5 CATERING & EVENT SERVICE PROVIDERS
20.2.6 INSTITUTIONAL FOODSERVICE OPERATORS
21 U.K. RESTAURANT POS MARKET, COMPANY LANDSCAPE
21.1 COMPANY SHARE ANALYSIS: U.K.
22 SWOT ANALYSIS
23 GLOBAL COMPANY PROFILE
23.1 BLOCK, INC.(SQUARE)
23.1.1 COMPANY SNAPSHOT
23.1.2 REVENUE ANALYSIS
23.1.3 PRODUCT PORTFOLIO
23.1.4 RECENT DEVELOPMENT
23.2 CLOVER NETWORK, LLC
23.2.1 COMPANY SNAPSHOT
23.2.2 PRODUCT PORTFOLIO
23.2.3 RECENT UPDATES
23.3 LIGHTSPEED
23.3.1 COMPANY SNAPSHOT
23.3.2 REVENUE ANALYSIS
23.3.3 PRODUCT PORTFOLIO
23.3.4 RECENT DEVELOPMENT
23.4 NCR VOYIX CORPORATION
23.4.1 COMPANY SNAPSHOT
23.4.2 REVENUE ANALYSIS
23.4.3 PRODUCT PORTFOLIO
23.4.4 RECENT UPDATES
23.5 ORACLE CORPORATION
23.5.1 COMPANY SNAPSHOT
23.5.2 REVENUE ANALYSIS
23.5.3 PRODUCT PORTFOLIO
23.5.4 RECENT UPDATES
23.6 PAR TECH
23.6.1 COMPANY SNAPSHOT
23.6.2 REVENUE ANALYSIS
23.6.3 PRODUCT PORTFOLIO
23.6.4 RECENT DEVELOPMENT
23.7 REVEL SYSTEMS, INC
23.7.1 COMPANY SNAPSHOT
23.7.2 PRODUCT PORTFOLIO
23.7.3 RECENT UPDATES
23.8 SUMUP PAYMENTS LIMITED
23.8.1 COMPANY SNAPSHOT
23.8.2 PRODUCT PORTFOLIO
23.8.3 RECENT UPDATES
23.9 TOAST, INC.
23.9.1 COMPANY SNAPSHOT
23.9.2 REVENUE ANALYSIS
23.9.3 PRODUCT PORTFOLIO
23.9.4 RECENT DEVELOPMENT
23.1 TOUCHBISTRO
23.10.1 COMPANY SNAPSHOT
23.10.2 PRODUCT PORTFOLIO
23.10.3 RECENT DEVELOPMENT
24 U.K COMPANY PROFILE
24.1 EPOS NOW LTD.
24.1.1 COMPANY SNAPSHOT
24.1.2 PRODUCT PORTFOLIO
24.1.3 RECENT UPDATES
24.2 ICRTOUCH LTD.
24.2.1 COMPANY SNAPSHOT
24.2.2 PRODUCT PORTFOLIO
24.2.3 RECENT UPDATES
24.3 KOBAS
24.3.1 COMPANY SNAPSHOT
24.3.2 PRODUCT PORTFOLIO
24.3.3 RECENT DEVELOPMENT
24.4 NFS HOSPITALITY
24.4.1 COMPANY SNAPSHOT
24.4.2 PRODUCT PORTFOLIO
24.4.3 RECENT DEVELOPMENT
24.5 POSAPT LTD.
24.5.1 COMPANY SNAPSHOT
24.5.2 PRODUCT PORTFOLIO
24.5.3 RECENT UPDATES
24.6 SYRVE
24.6.1 COMPANY SNAPSHOT
24.6.2 PRODUCT PORTFOLIO
24.6.3 RECENT DEVELOPMENT
24.7 TEVALIS LTD
24.7.1 COMPANY SNAPSHOT
24.7.2 PRODUCT PORTFOLIO
24.7.3 RECENT UPDATES
24.8 THE ACCESS GROUP
24.8.1 COMPANY SNAPSHOT
24.8.2 PRODUCT PORTFOLIO
24.8.3 RECENT DEVELOPMENT
24.9 TISSL LTD
24.9.1 COMPANY SNAPSHOT
24.9.2 PRODUCT PORTFOLIO
24.9.3 RECENT DEVELOPMENT
24.1 ZONAL RETAIL DATA SYSTEMS LTD.
24.10.1 COMPANY SNAPSHOT
24.10.2 PRODUCT PORTFOLIO
24.10.3 RECENT UPDATES
25 QUESTIONNAIRE
26 RELATED REPORTS
List of Table
TABLE 1 ANNUAL PATENT PUBLICATIONS (2017– MAY 2026)
TABLE 2 PENETRATION AND GROWTH PROSPECT MAPPING BY OFFERING
TABLE 3 PENETRATION AND GROWTH PROSPECT BY ENTERPRISE SIZE
TABLE 4 PENETRATION AND GROWTH PROSPECT BY RESTAURANT TYPE
TABLE 5 STRATEGIC OPPORTUNITY PRIORITIZATION (2026–2033)
TABLE 6 HOSPITALITY POS VENDOR COMPARISON
TABLE 7 COMPANY COMPARATIVE ANALYSIS
TABLE 8 STRATEGIC RESPONSES ADOPTED BY POS MANUFACTURERS
TABLE 9 U.K. IN RESTAURANT POS MARKET, BY OFFERING, 2018-2033 (USD THOUSAND)
TABLE 10 U.K. HARDWARE IN RESTAURANT POS MARKET, BY TYPE , 2018-2033 (USD THOUSAND)
TABLE 11 U.K. PAYMENT TERMINALS IN RESTAURANT POS MARKET, BY TYPE, 2018-2033 (USD THOUSAND)
TABLE 12 U.K. RECEIPT PRINTERS IN RESTAURANT POS MARKET, BY TYPE, 2018-2033 (USD THOUSAND)
TABLE 13 U.K. CASH DRAWERS IN RESTAURANT POS MARKET, BY TYPE, 2018-2033 (USD THOUSAND)
TABLE 14 U.K. BARCODE SCANNERS IN RESTAURANT POS MARKET, BY TYPE, 2018-2033 (USD THOUSAND)
TABLE 15 U.K. SOFTWARE IN RESTAURANT POS MARKET, BY TYPE , 2018-2033 (USD THOUSAND)
TABLE 16 U.K. SERVICES IN RESTAURANT POS MARKET, BY TYPE, 2018-2033 (USD THOUSAND)
TABLE 17 U.K. PROFESSIONAL SERVICES IN RESTAURANT POS MARKET, BY TYPE, 2018-2033 (USD THOUSAND)
TABLE 18 U.K. RESTAURANT POS MARKET, BY POS SYSTEM TYPE, 2018-2033 (USD THOUSAND)
TABLE 19 U.K. RESTAURANT POS MARKET, BY DEPLOYMENT MODE, 2018-2033 (USD THOUSAND)
TABLE 20 U.K. CLOUD IN RESTAURANT POS MARKET, BY TYPE, 2018-2033 (USD THOUSAND)
TABLE 21 U.K. RESTAURANT POS MARKET, BY ENTERPRISE SIZE, 2018-2033 (USD THOUSAND)
TABLE 22 U.K. RESTAURANT POS MARKET, BY OPERATING SYSTEM, 2018-2033 (USD THOUSAND)
TABLE 23 U.K. RESTAURANT POS MARKET, BY REVENUE MODEL, 2018-2033 (USD THOUSAND)
TABLE 24 U.K. SUBSCRIPTION IN RESTAURANT POS MARKET, BY TYPE, 2018-2033 (USD THOUSAND)
TABLE 25 U.K. RESTAURANT POS MARKET, BY INTELLIGENCE LEVEL, 2018-2033 (USD THOUSAND)
TABLE 26 U.K. RESTAURANT POS MARKET, BY OUTLET TYPE, 2018-2033 (USD THOUSAND)
TABLE 27 U.K. RESTAURANT POS MARKET, BY FUNCTIONAL MODULE, 2018-2033 (USD THOUSAND)
TABLE 28 U.K. ORDER & BILLING MANAGEMENT IN RESTAURANT POS MARKET, BY TYPE, 2018-2033 (USD THOUSAND)
TABLE 29 U.K. INVENTORY & PROCUREMENT MANAGEMENT IN RESTAURANT POS MARKET, BY TYPE, 2018-2033 (USD THOUSAND)
TABLE 30 U.K. CUSTOMER ENGAGEMENT IN RESTAURANT POS MARKET, BY TYPE, 2018-2033 (USD THOUSAND)
TABLE 31 U.K. BUSINESS INTELLIGENCE & ANALYTICS IN RESTAURANT POS MARKET, BY TYPE, 2018-2033 (USD THOUSAND)
TABLE 32 U.K. KITCHEN OPERATIONS IN RESTAURANT POS MARKET, BY TYPE, 2018-2033 (USD THOUSAND)
TABLE 33 U.K. WORKFORCE MANAGEMENT IN RESTAURANT POS MARKET, BY TYPE, 2018-2033 (USD THOUSAND)
TABLE 34 U.K. RESTAURANT POS MARKET, BY PAYMENT CAPABILITY, 2018-2033 (USD THOUSAND)
TABLE 35 U.K. RESTAURANT POS MARKET, BY INTEGRATION ECOSYSTEM, 2018-2033 (USD THOUSAND)
TABLE 36 U.K. RESTAURANT POS MARKET, BY RESTAURANT TYPE, 2018-2033 (USD THOUSAND)
TABLE 37 U.K. QSR (QUICK SERVICE RESTAURANTS) IN RESTAURANT POS MARKET, BY CATEGORY, 2018-2033 (USD THOUSAND)
TABLE 38 U.K. QSR (QUICK SERVICE RESTAURANTS) IN RESTAURANT POS MARKET, BY POS SYSTEM TYPE, 2018-2033 (USD THOUSAND)
TABLE 39 U.K. FSR (FULL SERVICE RESTAURANTS) IN RESTAURANT POS MARKET, BY CATEGORY, 2018-2033 (USD THOUSAND)
TABLE 40 U.K. FSR (FULL SERVICE RESTAURANTS) IN RESTAURANT POS MARKET, BY POS SYSTEM TYPE, 2018-2033 (USD THOUSAND)
TABLE 41 U.K. CAFÉS & BAKERIES IN RESTAURANT POS MARKET, BY POS SYSTEM TYPE, 2018-2033 (USD THOUSAND)
TABLE 42 U.K. BARS IN RESTAURANT POS MARKET, BY POS SYSTEM TYPE, 2018-2033 (USD THOUSAND)
TABLE 43 U.K. CLOUD KITCHENS IN RESTAURANT POS MARKET, BY POS SYSTEM TYPE, 2018-2033 (USD THOUSAND)
TABLE 44 U.K. CATERING IN RESTAURANT POS MARKET, BY POS SYSTEM TYPE, 2018-2033 (USD THOUSAND)
TABLE 45 U.K. STADIUM RESTAURANTS IN RESTAURANT POS MARKET, BY POS SYSTEM TYPE, 2018-2033 (USD THOUSAND)
TABLE 46 U.K. AIRLINE RESTAURANTS IN RESTAURANT POS MARKET, BY POS SYSTEM TYPE, 2018-2033 (USD THOUSAND)
TABLE 47 U.K. OTHERS IN RESTAURANT POS MARKET, BY POS SYSTEM TYPE, 2018-2033 (USD THOUSAND)
TABLE 48 U.K. RESTAURANT POS MARKET, BY END USER, 2018-2033 (USD THOUSAND)
List of Figure
FIGURE 1 U.K. RESTAURANT POS MARKET: SEGMENTATION
FIGURE 2 U.K. RESTAURANT POS MARKET: DATA TRIANGULATION
FIGURE 3 U.K. RESTAURANT POS MARKET: DRIVERS, RESTRAINTS, OPPORTUNITIES, AND CHALLENGES ANALYSIS
FIGURE 4 U.K. RESTAURANT POS MARKET: GLOBAL VS REGIONAL MARKET ANALYSIS
FIGURE 5 U.K. RESTAURANT POS MARKET: COMPANY RESEARCH ANALYSIS
FIGURE 6 U.K. RESTAURANT POS MARKET: INTERVIEW DEMOGRAPHICS
FIGURE 7 U.K. RESTAURANT POS MARKET: DBMR MARKET POSITION GRID
FIGURE 8 U.K. RESTAURANT POS MARKET: VENDOR SHARE ANALYSIS
FIGURE 9 U.K. RESTAURANT POS MARKET: MULTIVARIATE MODELING
FIGURE 10 U.K. RESTAURANT POS MARKET: ENTERPRISE SIZE TIMELINE CURVE
FIGURE 11 U.K. RESTAURANT POS MARKET: END USER COVERAGE GRID
FIGURE 12 U.K. RESTAURANT POS MARKET: SEGMENTATION
FIGURE 13 THREE SEGMENTS COMPRISE THE U.K. RESTAURANT POS MARKET, BY OFFERING (2025)
FIGURE 14 U.K. RESTAURANT POS MARKET: EXECUTIVE SUMMARY
FIGURE 15 STRATEGIC DECISIONS
FIGURE 16 RISING NEED TO IMPROVE RESTAURANT OPERATIONAL EFFICIENCY AMID LABOUR COST PRESSURE IS EXPECTED TO DRIVE THE U.K. RESTAURANT POS MARKET DURING THE FORECAST PERIOD OF 2026 TO 2033
FIGURE 17 OFFERING SEGMENT IS EXPECTED TO ACCOUNT FOR THE LARGEST SHARE OF THE U.K. RESTAURANT POS MARKET IN 2026 & 2033
FIGURE 18 ANNUAL PATENTS (2017– MAY 2026)
FIGURE 19 TOTAL PATENTS (%)/COUNTRIES
FIGURE 20 TOP PATENT HOLDERS
FIGURE 21 PATENT DISTRIBUTION BY IPC CLASSIFICATION
FIGURE 22 VALUE CHAIN ANALYSIS
FIGURE 23 DROC ANALYSIS
FIGURE 24 U.K. RESTAURANT POS MARKET, BY OFFERING, 2025
FIGURE 25 U.K. RESTAURANT POS MARKET, BY POS SYSTEM TYPE, 2025
FIGURE 26 U.K. RESTAURANT POS MARKET, BY DEPLOYMENT MODE, 2025
FIGURE 27 U.K. RESTAURANT POS MARKET, BY ENTERPRISE SIZE, 2025
FIGURE 28 U.K. RESTAURANT POS MARKET, BY OPERATING SYSTEM, 2025
FIGURE 29 U.K. RESTAURANT POS MARKET, BY REVENUE MODEL, 2025
FIGURE 30 U.K. RESTAURANT POS MARKET, BY INTELLIGENCE LEVEL, 2025
FIGURE 31 U.K. RESTAURANT POS MARKET, BY OUTLET TYPE, 2025
FIGURE 32 U.K. RESTAURANT POS MARKET, BY FUNCTIONAL MODULE, 2025
FIGURE 33 U.K. RESTAURANT POS MARKET, BY PAYMENT CAPABILITY, 2025
FIGURE 34 U.K. RESTAURANT POS MARKET, BY INTEGRATION ECOSYSTEM, 2025
FIGURE 35 U.K. RESTAURANT POS MARKET, BY RESTAURANT TYPE, 2025
FIGURE 36 U.K. RESTAURANT POS MARKET, BY END USER, 2025
FIGURE 37 U.K. RESTAURANT POS MARKET: COMPANY SHARE 2025 (%)
Data collection and base year analysis are done using data collection modules with large sample sizes. The stage includes obtaining market information or related data through various sources and strategies. It includes examining and planning all the data acquired from the past in advance. It likewise envelops the examination of information inconsistencies seen across different information sources. The market data is analysed and estimated using market statistical and coherent models. Also, market share analysis and key trend analysis are the major success factors in the market report. To know more, please request an analyst call or drop down your inquiry.
The key research methodology used by DBMR research team is data triangulation which involves data mining, analysis of the impact of data variables on the market and primary (industry expert) validation. Data models include Vendor Positioning Grid, Market Time Line Analysis, Market Overview and Guide, Company Positioning Grid, Patent Analysis, Pricing Analysis, Company Market Share Analysis, Standards of Measurement, Global versus Regional and Vendor Share Analysis. To know more about the research methodology, drop in an inquiry to speak to our industry experts.
Data Bridge Market Research is a leader in advanced formative research. We take pride in servicing our existing and new customers with data and analysis that match and suits their goal. The report can be customized to include price trend analysis of target brands understanding the market for additional countries (ask for the list of countries), clinical trial results data, literature review, refurbished market and product base analysis. Market analysis of target competitors can be analyzed from technology-based analysis to market portfolio strategies. We can add as many competitors that you require data about in the format and data style you are looking for. Our team of analysts can also provide you data in crude raw excel files pivot tables (Fact book) or can assist you in creating presentations from the data sets available in the report.


