
Us And Brazil Bottled Water Market
Market Size in USD Billion
 USD
73.44 Billion
USD
115.26 Billion
2024
2032
USD
73.44 Billion
USD
115.26 Billion
2024
2032
| 2025 - 2032 | |
| USD 73.44 Billion | |
| USD 115.26 Billion | |
| % | |
U.S. and Brazil Bottled Water Market Analysis
The U.S and Brazil bottled water market is experiencing robust growth, driven by rising concerns over tap water safety and inadequate public water supply. As the U.S. and Brazil bottled water industry continues to expand, the surge in regulatory pressure related to plastic waste and pollution has increased. Growing demand for functional and premium water are creating opportunities for the market. Market dynamics are also influenced by high production costs and water source limitations. Overall, the market is expected to continue expanding, with a focus on innovation and sustainability to meet evolving industrial demands.
U.S. and Brazil Bottled Water Market Size
U.S. and Brazil bottled water market size was valued at USD 73.44 billion in 2024 and is projected to reach USD 115.26 billion by 2032, growing with a CAGR of 5.9% during the forecast period of 2025 to 2032.
U.S. and Brazil Bottled Water Market Trends
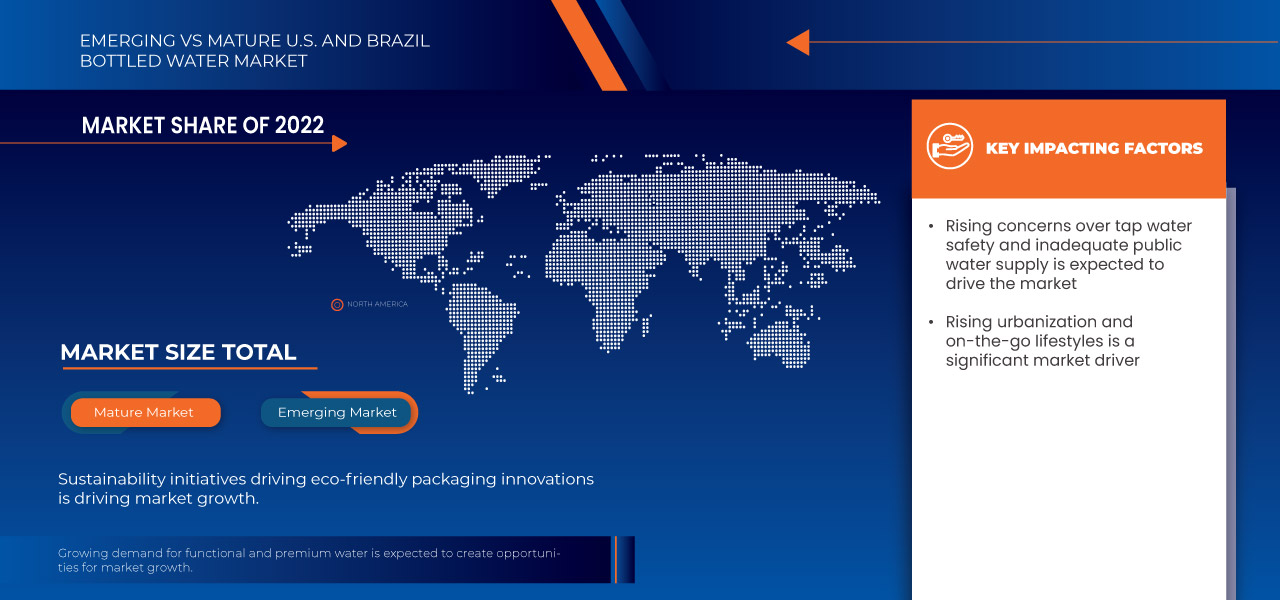
“Rising Urbanization and On-The-Go Lifestyles”
The rising urbanization and on-the-go lifestyles of consumers significantly influence the bottled water market in the U.S. and Brazil. As more people move to cities, there’s an increasing need for convenient, accessible, and portable hydration options. Urban areas often see busy schedules and high-paced lifestyles, where people are constantly on the move, whether commuting, working, or engaging in recreational activities. This shift has led to a greater reliance on bottled water as a quick and convenient solution for staying hydrated throughout the day.
In the U.S., fast-paced urban living, coupled with an emphasis on health and wellness, has made bottled water a staple. People are more health-conscious, preferring purified water over sugary drinks, leading to higher bottled water consumption. Additionally, with the rise of convenience stores, vending machines, and takeaway options, bottled water is now more accessible than ever for people on the go.
Similarly, in Brazil, urbanization has fueled the demand for bottled water. As cities grow and lifestyles become busier, Brazilians increasingly seek portable hydration options. In major cities like São Paulo and Rio de Janeiro, the convenience of bottled water allows consumers to stay hydrated while navigating their hectic daily routines.
Both markets are witnessing a shift in consumer behavior, with the growing demand for easy, healthy, and portable hydration solutions. Companies are responding with a variety of bottled water offerings, from premium to eco-friendly options, to cater to the needs of urban dwellers living busy, on-the-go lifestyles. This trend continues to drive the growth of the bottled water market.
For instance,
- In May 2023, an article published by Informa Markets highlighted the growing demand for bottled water in the U.S., driven by urbanization, busy lifestyles, and increased health consciousness. Consumers are turning to bottled water as a convenient, portable, and healthier hydration option, fueling its widespread availability in convenience stores and vending machines
- In August 2024, according to a story published by Wired, the growing shift towards biodegradable alternatives to disposable plastics is discussed, focusing on innovative solutions such as seaweed-based packaging. These sustainable materials offer an eco-friendly replacement for traditional plastics, aiming to reduce environmental impact and promote a greener future for packaging
The bottled water market in the U.S. is growing due to concerns over tap water safety and inadequate public water supply. Aging infrastructure, contamination, and water shortages drive demand for bottled water as a safer, more convenient alternative. Health-conscious lifestyles and portability further boost market growth.
Report Scope and Market Segmentation
|
Attributes |
U.S. and Brazil Bottled Water Ingredients Key Market Insights |
|
Segments Covered |
|
|
Countries Covered |
U.S. and Brazil |
|
Key Market Players |
The Coca‑Cola Company (U.S.), Danone (France), Nestlé (Switzerland), Pepsico (U.S.), Fiji Water Company LLC. (U.S.), CG Roxane, LLC (U.S.), Mountain Valley Spring Water (U.S.), Tata Consumer Products Limited (India), VICHY CATALAN CORPORATION (Spain), Voss of Norway AS (U.S.) |
|
Market Opportunities |
|
|
Value Added Data Infosets |
In addition to the insights on market scenarios such as market value, growth rate, segmentation, geographical coverage, and major players, the market reports curated by the Data Bridge Market Research also include in-depth expert analysis, pricing analysis, brand share analysis, consumer survey, demography analysis, supply chain analysis, value chain analysis, raw material/consumables overview, vendor selection criteria, PESTLE Analysis, Porter Analysis, and regulatory framework. |
U.S. and Brazil Bottled Water Market Definition
Bottled water is packaged drinking water sourced from springs, wells, or purified systems. It comes in various types, including still, sparkling, and flavored options. Consumers choose bottled water for convenience, hydration, and perceived health benefits. The market is growing due to increasing health awareness and demand for safe drinking water. Companies focus on sustainability, using eco-friendly packaging and recycling initiatives. Regulations ensure quality and safety, maintaining consumer trust in bottled water brands.
U.S. and Brazil Bottled Water Market Dynamics
Drivers
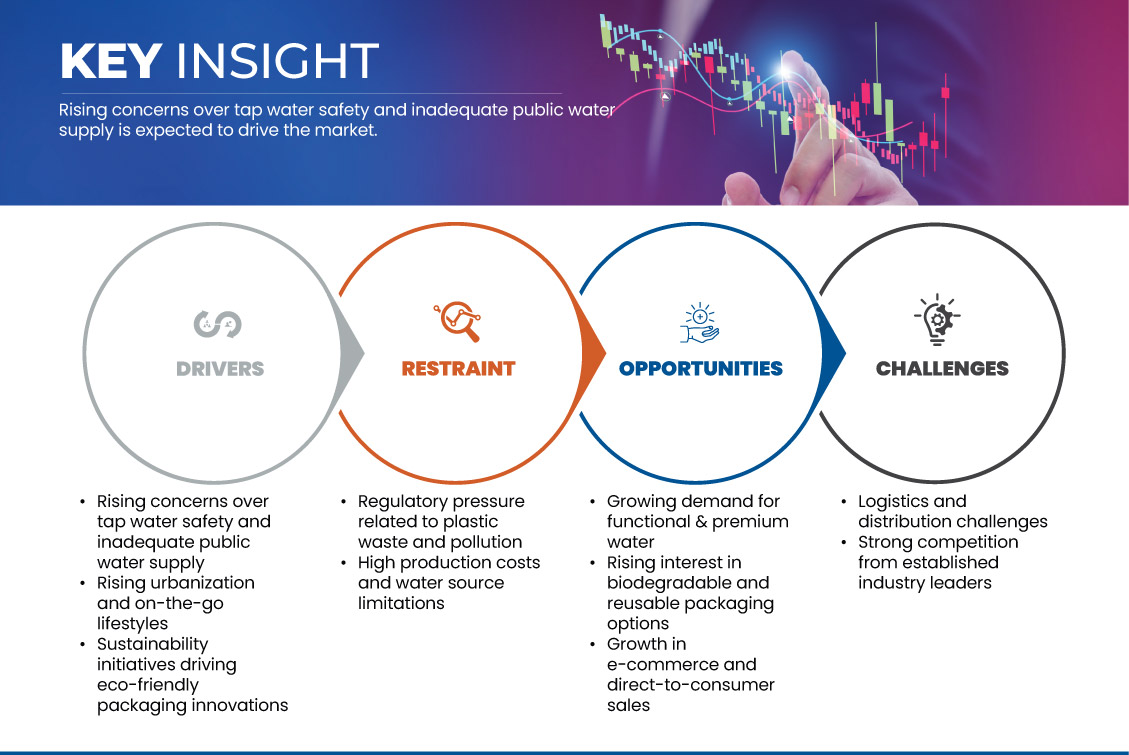
- Rising concerns over tap water safety and inadequate public water supply
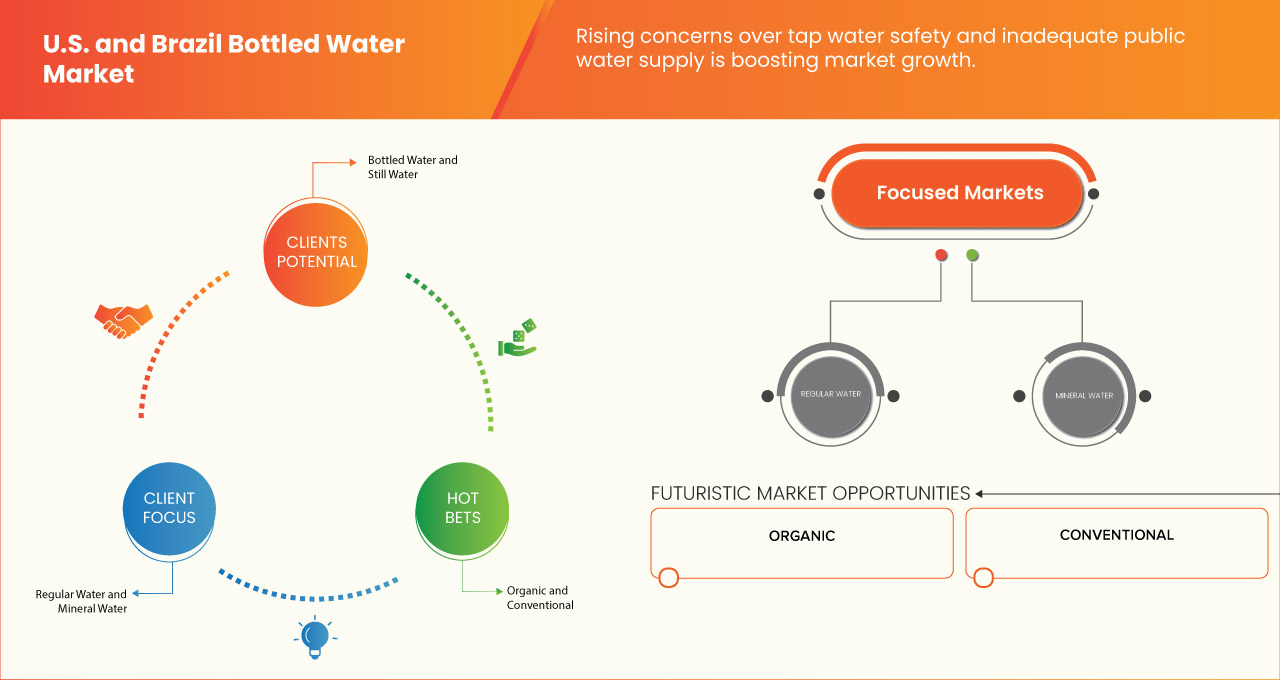
The bottled water market in both the U.S. and Brazil is experiencing a surge in demand, largely due to rising concerns over tap water safety and the inadequacy of public water supply systems. In the U.S., issues like aging infrastructure, contamination, and environmental pollutants have led many to question the reliability of tap water. A significant portion of the population has turned to bottled water as a safer, more convenient alternative. This shift is seen not only in urban areas but also in rural regions where access to clean and reliable water sources is more limited.
Similarly, Brazil faces its challenges with water safety. Inadequate water treatment facilities and the contamination of water sources in some areas have heightened the need for bottled water. In many urban and rural areas, there are frequent water shortages or supply disruptions that further fuel concerns about the quality of available tap water. As a result, bottled water has become a trusted and preferred choice.
This rising demand is further driven by the growing awareness of the importance of hydration and health-conscious lifestyles, which emphasize clean and purified drinking water. Additionally, the convenience and portability of bottled water have made it a staple for consumers on the go.
In both markets, while some efforts are being made to improve public water systems, the concerns over water safety continue to fuel the growth of the bottled water industry. Companies are responding with innovations in water filtration, packaging, and eco-friendly practices to cater to the ever-increasing demand.
For instance,
- In 2023, a survey published by Aquasana revealed that 70% of Americans are concerned about the quality of unfiltered tap water, a significant increase from 34% in 2021. Many consumers, particularly in urban and rural areas, have turned to bottled water for safer and more reliable hydration options
- In May 2020, a news article published by Business Wire revealed that 25% of Americans never drink tap water due to concerns about its taste, smell, and safety. This highlights the growing preference for bottled water as a reliable and safer hydration option, driven by increasing concerns over tap water quality
- In October 2023, according to an article published by IWA Publishing on water quality in southern Brazil found that 30% of water samples from rural areas were unsatisfactory or unfit for consumption. This highlight significant challenges in water safety, especially in rural regions, where access to clean and safe water remains a major concern
The bottled water market in the U.S. and Brazil is growing due to concerns over tap water safety and inadequate public water supply. Aging infrastructure, contamination, and water shortages drive demand for bottled water as a safer, more convenient alternative. Health-conscious lifestyles and portability further boost market growth.
- Sustainability initiatives driving eco-friendly packaging innovations
Sustainability initiatives are playing a significant role in shaping the bottled water market in both the U.S. and Brazil, particularly in the area of eco-friendly packaging. As consumers become more environmentally conscious, there is an increasing demand for sustainable packaging solutions that reduce plastic waste and carbon footprints. This growing awareness is pushing bottled water companies to innovate and adopt greener packaging options.
In the U.S., many companies are shifting toward using recycled materials, such as rPET (recycled polyethylene terephthalate), in their bottles. This helps reduce the reliance on virgin plastic and lowers the overall environmental impact. Additionally, some brands are exploring alternatives like biodegradable and compostable packaging to minimize waste and promote circular economy practices. The rise of eco-friendly packaging has become a key selling point, with consumers increasingly choosing brands that align with their values of sustainability.
Similarly, in Brazil, where environmental issues like deforestation and plastic pollution are pressing concerns, the demand for sustainable bottled water packaging is on the rise. Companies are increasingly opting for lighter bottles, which use less plastic and are also turning to recyclable materials. Many Brazilian consumers are now more conscious of their environmental impact, pushing businesses to adopt greener practices and appeal to eco-conscious buyers.
For instance,
- In August 2024, a study published by WIRED discussed the growing environmental impact of disposable plastics, including bottled water packaging. The study emphasizes innovative solutions for reducing single-use plastic waste, aligning with trends in consumer demand for more sustainable alternatives to packaging
- In September 2022, an article published by PMMI Media Group highlighted Fiji Water's transition to 100% rPET bottles for its 300- and 500-mL sizes in the U.S., aiming to reduce plastic waste and lower carbon emissions. This shift reflects a growing industry trend toward using recycled materials in packaging to promote sustainability
- In June 2023, according to a blog published by ALPLA, Coca-Cola India launched its first 100% recycled PET bottle for its Kinley packaged drinking water brand, with support from ALPLA. This move marks a significant milestone in sustainable packaging, aligning with the growing trend of using recycled materials to reduce plastic waste
Sustainability initiatives are driving eco-friendly packaging innovations in the U.S. and Brazil's bottled water markets. Companies are adopting recycled materials, biodegradable packaging, and lighter bottles to reduce plastic waste and environmental impact. Consumers' growing environmental awareness is pushing brands to embrace greener practices, fueling the demand for sustainable packaging.
Opportunities
- Growing demand for functional and premium water
The growing demand for functional and premium water presents a significant opportunity for the bottled water market in both the U.S. and Brazil. As consumers become more health conscious and aware of the benefits of hydration, they are increasingly seeking beverages that not only quench thirst but also provide added health benefits. This trend is especially evident in premium and functional water segments, where water is enhanced with additional nutrients, minerals, or functional ingredients like electrolytes, vitamins, and antioxidants.
In the U.S. market, the demand for functional water is driven by a growing interest in health and wellness, with consumers looking for products that support active lifestyles, boost immunity, improve skin health, or provide detoxifying benefits. Water infused with electrolytes for hydration, vitamins for immunity, and plant-based ingredients like aloe vera or coconut water is seeing a rise in popularity. Furthermore, premium water options such as spring water, alkaline water, and artisanal water are gaining traction, with consumers willing to pay more for perceived higher quality, better taste, and additional health benefits.
Similarly, in Brazil, where consumers are becoming more focused on wellness and self-care, the demand for functional bottled water is growing. With an increasing middle class and more disposable income, Brazilian consumers are exploring premium products and are more willing to invest in water products that promise health benefits. The rise of coconut water and other natural, nutrient-rich waters has already paved the way for functional water’s success in Brazil.
For instance,
- In October 2024, according to an article published by GlobeNewswire, A 2024 survey by the International Bottled Water Association reveals that 88% of Americans consume bottled water, with 87% having a positive view of it. Bottled water is now America's top beverage, surpassing soda for the eighth consecutive year. Environmental awareness is growing, with 44% recognizing recyclable plastic as less impactful.
- In October 2022, according to an article published by the International Bottled Water Association, A 2022 survey by the International Bottled Water Association shows that 88% of Americans have a positive opinion of bottled water. Bottled water remains the top beverage, outpacing soda. The survey also highlights the importance of recyclability, with 90% agreeing on the need for recycling all packaging materials.
U.S. and Brazil present an opportunity for brands to innovate and cater to a more discerning consumer base that values added functionality in their hydration options. Brands that capitalize on the market by offering high-quality, functional, and premium water products are well-positioned to capture the growing demand in both the U.S. and Brazil.
- Rising interest in biodegradable and reusable packaging options
The rising interest in biodegradable and reusable packaging options presents a significant opportunity for the U.S. and Brazilian bottled water markets. As consumers become increasingly concerned about environmental sustainability, both nations are witnessing a shift towards eco-friendly packaging solutions in the beverage industry. Bottled water companies in both the U.S. and Brazil can leverage this growing demand by investing in sustainable packaging alternatives, such as biodegradable plastics, glass bottles, and reusable containers.
In the U.S., where environmental awareness is high, consumer demand for sustainable practices has led to a rise in eco-conscious brands. Bottled water companies can capitalize on this trend by offering packaging that is not only recyclable but also made from renewable materials that break down quickly in the environment. Implementing packaging innovations like plant-based plastics, compostable materials, or reusable containers would align with consumers’ preferences and improve brand loyalty. The U.S. market, with its strong infrastructure for recycling and a growing number of eco-conscious consumers, presents an ideal setting for these innovations.
In Brazil, environmental concerns are also gaining traction, with growing awareness of plastic waste and the impact of unsustainable packaging practices. The Brazilian government has introduced initiatives to reduce plastic pollution, creating an incentive for businesses to adopt biodegradable or reusable packaging solutions. Furthermore, the significant bottled water consumption in Brazil provides an opportunity to influence consumer habits toward more sustainable practices, especially in urban centers where awareness is increasing.
For instance,
According to an article published by Seaside Sustainability, The U.S. is addressing plastic pollution through state and city-level bans on single-use plastics, with major impacts on reducing waste in natural spaces. While not federally mandated, these efforts are driving progress, especially in national parks and public lands. By 2032, significant reductions in ocean plastic are expected.
- In July 2024, according to an article published by Reuters., The Biden administration announced plans to phase out single-use plastics in federal operations by 2035, beginning with food service, events, and packaging by 2027. This move, alongside global treaty negotiations on plastic pollution, reflects a significant step toward reducing plastic waste, leveraging the U.S. government's purchasing power to drive change.
- In August 2023, according to an article published by USA TODAY, Researchers at Michigan State University developed a new biodegradable plastic alternative made from a bio-based polymer blend. This material is compostable in both home and industrial settings, improving upon existing bioplastics like PLA. The aim is to reduce plastic waste, though challenges in widespread adoption remain.
U.S and Brazilian markets present opportunities for bottled water companies to diversify their product lines with eco-friendly options, demonstrating commitment to sustainability and meeting regulatory requirements. Investing in biodegradable and reusable packaging could become a competitive differentiator and attract environmentally conscious consumers in the U.S. and Brazil, boosting market share and brand reputation.
Restraints/Challenges
- High production costs and water source limitations
High production costs and water source limitations are significant challenges affecting the bottled water market in both the U.S. and Brazil. The cost of producing bottled water has been steadily increasing due to factors like raw material prices, labor costs, and energy expenses. In particular, the cost of plastic packaging, a key component of bottled water, continues to rise, driven by environmental regulations and the shift towards more sustainable materials. This increase in production costs impacts the overall price of bottled water, making it less affordable for some consumers.
In addition to production costs, water source limitations are another major concern. Both countries face pressures on their water resources due to environmental factors and increasing demand. In the U.S., many states are experiencing water shortages, especially in areas like California, where drought conditions and limited freshwater resources affect the availability of water for bottling. The growing competition for water resources between industries, agriculture, and residential use further complicates the situation.
Similarly, in Brazil, access to clean and sustainable water sources is becoming more restricted, particularly in regions facing deforestation and climate change impacts. With increasing demand for bottled water, there is growing concern over the sustainability of water extraction practices, especially in areas already experiencing water stress. Water scarcity issues not only impact the cost of production but also raise questions about the long-term viability of the bottled water market in both countries.
These challenges push companies to seek innovative solutions, such as water recycling and sustainable sourcing practices, to reduce production costs and ensure a steady supply of water while meeting environmental and consumer demands.
For instance,
- In November 2024, according to a blog published by FinModelsLab, the cost of raw materials, packaging, and energy in the production of bottled water has been steadily increasing. Factors such as the rising price of plastic packaging, water purification, and machinery expenses contribute to higher production costs, which, in turn, affect the affordability of bottled water for consumers.
- In September 2024, according to an article by AP News, severe drought conditions in Brazil's Amazon region caused historic low water levels in key rivers, including the Negro River. This water scarcity impacted local communities and increased the cost of bottled water, raising concerns about sustainable water extraction practices.
High production costs and water source limitations challenge the bottled water market in the U.S. and Brazil. Rising raw material and packaging costs, along with water scarcity, impact production affordability and sustainability. Companies are exploring solutions like water recycling and sustainable sourcing to address these issues and meet consumer demand.
- Logistics and distribution challenges
Logistics and distribution challenges in the US and Brazil's bottled water market significantly impact delivery efficiency and cost-effectiveness. In the US, long distances, transportation delays, and rising fuel costs create bottlenecks. In Brazil, poor infrastructure, remote areas, and regulatory hurdles complicate distribution. Both markets require improved infrastructure, technology, and sustainable practices to overcome these challenges and ensure timely, cost-effective product delivery to consumers.
In the US, one of the primary challenges is the vast geographic area and the need for a highly developed distribution network. The market demands fast and reliable delivery, but bottlenecks such as transportation delays, insufficient warehousing capacity, and rising fuel costs create logistical headaches. Distribution centers are often located in areas far from manufacturing plants, leading to longer lead times and higher costs. Additionally, the complexity of managing inventory across multiple retail channels, including e-commerce and traditional stores, adds another layer of difficulty. There is also the increasing demand for sustainable packaging and more eco-friendly transportation methods, which presents its own set of operational hurdles.
In Brazil, logistics challenges are equally, if not more, pronounced due to the country's vast size, difficult terrain, and limited infrastructure in certain regions. Rural and remote areas often experience unreliable road networks, which delays deliveries and increases costs. Furthermore, Brazil's complex regulatory environment can cause delays at customs for imports, which adds to the supply chain's inefficiency. While urban centers such as São Paulo and Rio de Janeiro may benefit from a more developed logistics infrastructure, the rest of the country lacks similar access. This creates disparities in the availability of bottled water across various regions. The country's reliance on freight transportation, which can be unpredictable due to weather and road conditions, further complicates distribution efforts.
For instance,
- In December 2024, according to an article published by Mecalux, S.A., supply chain managers encounter logistics challenges like reducing costs, accurately forecasting demand, adopting sustainable practices, navigating international trade disruptions, and integrating new technologies. These issues impact every facet of logistics, from storage and shipment management to customer service, requiring constant adaptation to maintain efficiency and meet evolving market demands
The logistics and distribution challenges significantly hinder the efficient and cost-effective delivery of bottled water. In the US, long distances, transportation delays, and rising fuel costs create inefficiencies. In Brazil, poor infrastructure, remote regions, and regulatory complexities further complicate the supply chain. These obstacles impact product availability and increase costs, creating challenges for both producers and consumers in ensuring timely access to bottled water.
Impact and Current Market Scenario of Raw Material Shortage and Shipping Delays
Data Bridge Market Research offers a high-level analysis of the market and delivers information by keeping in account the impact and current market environment of raw material shortage and shipping delays. This translates into assessing strategic possibilities, creating effective action plans, and assisting businesses in making important decisions.
Apart from the standard report, we also offer in-depth analysis of the procurement level from forecasted shipping delays, distributor mapping by region, commodity analysis, production analysis, price mapping trends, sourcing, category performance analysis, supply chain risk management solutions, advanced benchmarking, and other services for procurement and strategic support.
Expected Impact of Economic Slowdown on the Pricing and Availability of Products
When economic activity slows, industries begin to suffer. The forecasted effects of the economic downturn on the pricing and accessibility of the products are taken into account in the market insight reports and intelligence services provided by DBMR. With this, our clients can typically keep one step ahead of their competitors, project their sales and revenue, and estimate their profit and loss expenditures.
U.S. and Brazil Bottled Water Market Scope
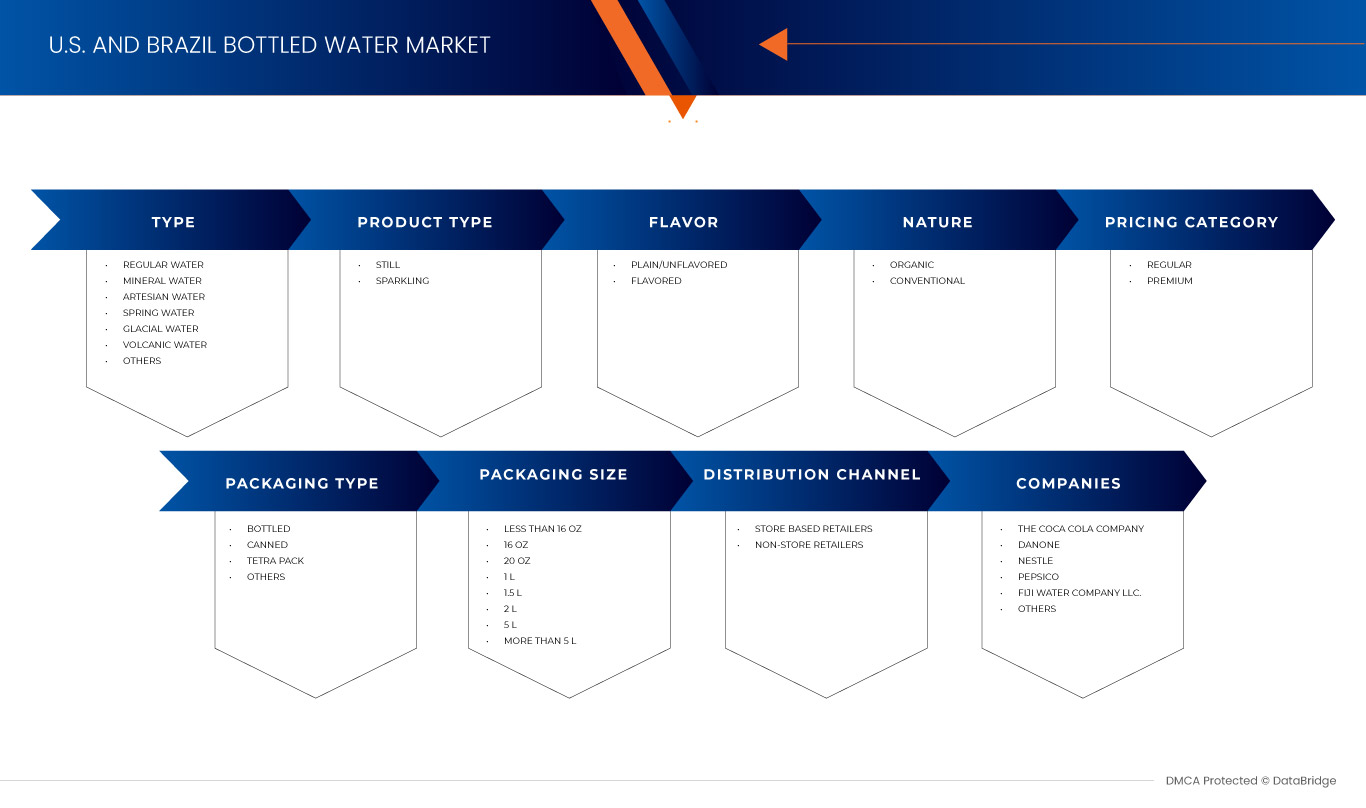
The market is segmented on the basis of type, product type, flavor, nature, pricing category, packaging type, packaging size, and distribution channel. The growth amongst these segments will help you analyze meagre growth segments in the industries and provide the users with a valuable market overview and market insights to help them make strategic decisions for identifying core market applications.
Type
- Regular Water
- Regular, By Flavor
- Plain/Unflavored
- Flavored
- Regular, By Flavor
- Mineral Water
- Mineral Water, By Flavor
- Plain/Unflavored
- Flavored
- Mineral Water, By Flavor
- Artesian Water
- Artesian Water, By Flavor
- Plain/Unflavored
- Flavored
- Artesian Water, By Flavor
- Spring Water
- Spring Water, By Flavor
- Plain/Unflavored
- Flavored
- Spring Water, By Flavor
- Glacial Water
- Glacial Water, By Flavor
- Plain/Unflavored
- Flavored
- Glacial Water, By Flavor
- Volcanic Water
- Volcanic Water, By Flavor
- Plain/Unflavored
- Flavored
- Volcanic Water, By Flavor
- Others
Product Type
- Still
- Still, By Flavor
- Plain/Unflavored
- Flavored
- Still, By Nature
- Organic
- Conventional
- Still, By Flavor
- Sparkling
- Sparkling, By Flavor
- Plain/Unflavored
- Flavored
- Sparkling, By Nature
- Organic
- Conventional
- Sparkling, By Flavor
Flavor
- Plain/Unflavored
- Flavored
- Flavored, By Flavor
- Orange
- Strawberry
- Watermelon
- Lime
- Raspberry
- Peach
- Blueberry
- Blackberry
- Apple
- Mango
- Kiwi
- Lychee
- Cucumber
- Vanilla
- Grapefruit
- Coconut
- Coffee
- Cherry
- Honey
- Chamomile
- Maple
- Mint
- Apricot
- Others
- Flavored, By Flavor
Nature
- Organic
- Conventional
Pricing Category
- Regular
- Premium
Packaging Type
- Bottled
- Bottled, By Packaging Type
- Regular Plastic
- Bio-Plastic and Bio-Degradable Plastic
- Bottled, By Packaging Type
- Canned
- Tetra Pack
- Others
Packaging Size
- Less than 16 Oz
- 16 Oz
- 20 Oz
- 1 L
- 1.5 L
- 2 L
- 5 L
- More than 5 L
Distribution Channel
- Store Based Retailers
- Store Based Retailers, By Distribution Channel
- Supermarkets/Hypermarkets
- Grocery Stores
- Convenience Stores
- Specialty Stores
- Others
- Store Based Retailers, By Distribution Channel
- Non-Store Retailers
- Non-Store Based Retailers, By Distribution Channel
- Vending Machines
- Online
- Online, By Distribution Channel
- Company Owned Websites
- Third Party Websites
- Online, By Distribution Channel
- Non-Store Based Retailers, By Distribution Channel
U.S. and Brazil Bottled Water Market Country Analysis
The market is analyzed and market size insights and trends are provided by type, product type, flavor, nature, pricing category, packaging type, packaging size, and distribution channel.
The countries covered in the market are U.S., and Brazil.
U.S. is expected to dominate the market due to sustainability initiatives driving eco-friendly packaging innovations.
Brazil is expected to witness the highest CAGR in the bottled water market. This growth is driven by growing demand for functional & premium water and rising interest in biodegradable and reusable packaging options.
The country section of the report also provides individual market impacting factors and changes in regulation in the market domestically that impacts the current and future trends of the market. Data points like down-stream and upstream value chain analysis, technical trends and porter's five forces analysis, case studies are some of the pointers used to forecast the market scenario for individual countries. Also, the presence and availability of country brands and their challenges faced due to large or scarce competition from local and domestic brands, impact of domestic tariffs and trade routes are considered while providing forecast analysis of the country data.
U.S. and Brazil Bottled Water Market Share
The market competitive landscape provides details by competitors. Details included are company overview, company financials, revenue generated, market potential, investment in research and development, new market initiatives, country presence, production sites and facilities, production capacities, company strengths and weaknesses, product launch, product width and breadth, application dominance. The above data points provided are only related to the companies' focus related to market.
U.S. and Brazil Bottled Water Market Leaders Operating in the Market Are:
- The Coca‑Cola Company (U.S.)
- Danone (France)
- Nestlé (Switzerland)
- Pepsico (U.S.)
- Fiji Water Company LLC. (U.S.)
- CG Roxane, LLC (U.S.)
- Mountain Valley Spring Water (U.S.)
- Tata Consumer Products Limited (India)
- VICHY CATALAN CORPORATION (Spain)
- Voss of Norway AS (U.S.)
Latest Developments in U.S. and Brazil Bottled Water Market
- In April 2024, The Coca‑Cola Company brand smartwater introduced 12-ounce aluminum cans for its original and alkaline with antioxidant varieties, offering a sleek, portable, and recyclable packaging option. This move aligns with the growing consumer preference for convenient and sustainable hydration solutions. The new cans are available as single units and in 8-packs across the United States
- In June 2024, Danone, Michelin, DMC Biotechnologies, and Crédit Agricole Centre France have partnered to create the Biotech Open Platform in Clermont-Ferrand. This initiative, with an initial Euro 16 million investment, aims to scale precision fermentation for bio-based materials. The platform will accelerate innovation in sustainable, scalable biotechnological solutions for industries like food and materials
- In January 2023, PepsiCo has completed the acquisition of Siete Foods for USD 1.2 billion, expanding its portfolio with nutritious, simple foods. Siete, known for its grain-free tortillas and other heritage-inspired products, aligns with PepsiCo's commitment to providing healthier, delicious choices. The acquisition aims to increase Siete's accessibility and growth.
- In December 2024, The PepsiCo Foundation has partnered with the National Restaurant Association Educational Foundation (NRAEF) in a USD 1 million initiative to expand workforce training in underserved communities. This collaboration will provide job-readiness training and career services, helping individuals gain essential skills for successful careers in the restaurant and hospitality industries
SKU-

- Interactive Data Analysis Dashboard
- Company Analysis Dashboard for high growth potential opportunities
- Research Analyst Access for customization & queries
- Competitor Analysis with Interactive dashboard
- Latest News, Updates & Trend analysis
- Harness the Power of Benchmark Analysis for Comprehensive Competitor Tracking
Table of Content
1 INTRODUCTION
1.1 OBJECTIVES OF THE STUDY
1.2 MARKET DEFINITION
1.3 OVERVIEW
1.4 LIMITATIONS
1.5 MARKETS COVERED
2 MARKET SEGMENTATION
2.1 MARKETS COVERED
2.2 GEOGRAPHICAL SCOPE
2.3 YEARS CONSIDERED FOR THE STUDY
2.4 CURRENCY AND PRICING
2.5 DBMR TRIPOD DATA VALIDATION MODEL
2.6 MULTIVARIATE MODELING
2.7 PRIMARY INTERVIEWS WITH KEY OPINION LEADERS
2.8 DBMR MARKET POSITION GRID
2.9 SECONDARY SOURCES
2.1 ASSUMPTIONS
3 EXECUTIVE SUMMARY
4 PREMIUM INSIGHTS
4.1 IMPORT EXPORT SCENARIO
4.2 PRICING ANALYSIS
4.3 VENDOR SELECTION CRITERIA
4.3.1 VENDOR SELECTION CRITERIA FOR THE U.S. BOTTLED WATER MARKET
4.3.2 VENDOR SELECTION CRITERIA FOR THE BRAZIL BOTTLED WATER MARKET
4.4 BRAND OUTLOOK
4.5 COMPETITION AND COMPANIES INVOLVED
4.5.1 THE COCA-COLA COMPANY
4.5.2 NESTLÉ WATER
4.5.3 PEPSICO INC.
4.5.4 DANONE GROUP
4.5.5 MOUNTAIN VALLEY SPRING COMPANY LLC
4.5.6 FIJI WATER COMPANY LLC
4.5.7 VOSS WATER
4.5.8 CG ROXANE, LLC (CRYSTAL GEYSER)
4.5.9 VICHY CATALAN CORPORATION
4.5.10 TATA CONSUMER PRODUCTS LIMITED
4.5.11 CONCLUSION
4.6 CONSUMER DISPOSABLE INCOME DYNAMICS AND SPENDING PATTERNS
4.6.1 U.S.
4.6.1.1 ECONOMIC OVERVIEW AND DISPOSABLE INCOME TRENDS
4.6.1.2 IMPACT ON THE BOTTLED WATER MARKET
4.6.1.3 CONSUMER BEHAVIOR SHIFTS
4.6.2 BRAZIL
4.6.2.1 ECONOMIC OVERVIEW AND DISPOSABLE INCOME TRENDS
4.6.2.2 IMPACT ON THE BOTTLED WATER MARKET
4.6.2.3 CONSUMER BEHAVIOR SHIFTS
4.6.2.4 COMPARATIVE ANALYSIS
4.6.3 CONCLUSION
4.7 CONSUMER LEVEL TRENDS
4.7.1 U.S.
4.7.2 BRAZIL
4.8 CURRENT TRENDS, ISSUES, AND CHALLENGES
4.8.1 U.S.
4.8.1.1 CURRENT TRENDS
4.8.1.2 ISSUES FACED BY THE U.S. BOTTLED WATER MARKET
4.8.2 BRAZIL
4.8.2.1 CURRENT TRENDS
4.8.2.2 ISSUES FACING THE BRAZIL BOTTLED WATER MARKET
4.8.3 CONCLUSION
4.9 FACTORS INFLUENCING PURCHASING DECISION
4.9.1 U.S.
4.9.1.1 HEALTH CONSCIOUSNESS
4.9.1.2 TASTE AND QUALITY
4.9.1.3 BRAND LOYALTY AND RECOGNITION
4.9.1.4 ENVIRONMENTAL SUSTAINABILITY
4.9.1.5 PRICE SENSITIVITY
4.9.1.6 CONVENIENCE AND ACCESSIBILITY
4.9.1.7 MARKETING AND ADVERTISING
4.9.1.8 INNOVATIVE PRODUCT OFFERINGS
4.9.2 BRAZIL
4.9.2.1 HEALTH AND WELLNESS TRENDS
4.9.2.2 WATER QUALITY CONCERNS
4.9.2.3 BRAND TRUST AND REPUTATION
4.9.2.4 PRICE AND AFFORDABILITY
4.9.2.5 PACKAGING AND PORTABILITY
4.9.2.6 ENVIRONMENTAL AWARENESS
4.9.2.7 RETAIL AVAILABILITY
4.9.2.8 CULTURAL AND LIFESTYLE FACTORS
4.9.3 COMMON FACTORS ACROSS BOTH MARKETS
4.9.3.1 HEALTH AND WELLNESS FOCUS
4.9.3.2 BRAND RECOGNITION AND TRUST
4.9.3.3 ENVIRONMENTAL SUSTAINABILITY
4.9.3.4 PRICE SENSITIVITY
4.9.3.5 CONVENIENCE AND ACCESSIBILITY
4.9.3.6 MARKETING AND ADVERTISING IMPACT
4.9.4 CONCLUSION
4.1 GROWTH STRATEGIES ADOPTED BY KEY PLAYERS
4.10.1 U.S.
4.10.1.1 PRODUCT DIVERSIFICATION AND INNOVATION
4.10.1.2 SUSTAINABLE PACKAGING INITIATIVES
4.10.1.3 STRATEGIC PARTNERSHIPS AND ACQUISITIONS
4.10.1.4 FOCUS ON PREMIUM OFFERINGS
4.10.2 BRAZIL
4.10.2.1 MARKET EXPANSION AND ACCESSIBILITY
4.10.2.2 INTRODUCTION OF PREMIUM PRODUCTS
4.10.2.3 SUSTAINABILITY INITIATIVES
4.10.2.4 STRATEGIC EXITS AND INVESTMENTS
4.10.3 COMPARATIVE ANALYSIS
4.10.4 CONCLUSION
4.11 IMPACT OF ECONOMIC SLOWDOWN
4.11.1 ECONOMIC SLOWDOWN IMPACT ON CONSUMER BEHAVIOR
4.11.2 REDUCED SPENDING ON PREMIUM AND SINGLE-SERVE BOTTLED WATER
4.11.3 IMPACT ON SUPPLY CHAIN AND PRODUCTION COSTS
4.11.4 STRATEGIC RESPONSE FROM COMPANIES
4.11.5 CONCLUSION
4.12 MEETING CONSUMER REQUIREMENT
4.12.1 U.S.
4.12.2 BRAZIL
4.13 NEW PRODUCT LAUNCH STRATEGY
4.13.1 U.S.
4.13.1.1 PRODUCT INNOVATION AND DIVERSIFICATION
4.13.1.2 SUSTAINABLE PACKAGING INITIATIVES
4.13.1.3 STRATEGIC MARKET ENTRY AND BRANDING
4.13.1.4 LEVERAGING HEALTH AND WELLNESS TRENDS
4.13.2 BRAZIL
4.13.2.1 HEALTH-FOCUSED PRODUCT DEVELOPMENT
4.13.2.2 INNOVATIVE PACKAGING SOLUTIONS
4.13.2.3 SUSTAINABILITY AND ENVIRONMENTAL RESPONSIBILITY
4.13.2.4 PREMIUM PRODUCT OFFERINGS
4.13.3 COMMON STRATEGIES ACROSS BOTH MARKETS
4.13.3.1 EMPHASIS ON HEALTH AND WELLNESS
4.13.3.2 BRAND DIFFERENTIATION AND MARKETING
4.13.3.3 ADAPTATION TO CONSUMER PREFERENCES
4.13.3.4 SUSTAINABILITY INITIATIVES
4.13.4 CHALLENGES AND CONSIDERATIONS
4.13.4.1 REGULATORY COMPLIANCE
4.13.4.2 COMPETITIVE LANDSCAPE
4.13.4.3 SUPPLY CHAIN AND DISTRIBUTION
4.13.4.4 CONSUMER EDUCATION
4.13.4.5 CONCLUSION
4.14 PRIVATE LABEL VS BRAND ANALYSIS
4.14.1 U.S. BOTTLED WATER MARKET
4.14.2 BRAZIL BOTTLED WATER MARKET
4.14.3 COMPARATIVE INSIGHTS
4.14.4 CONCLUSION
4.15 PROMOTIONAL ACTIVITIES
4.15.1 DIGITAL MARKETING & SOCIAL MEDIA ENGAGEMENT
4.15.1.1 INFLUENCER MARKETING & CONSUMER ENGAGEMENT
4.15.1.2 SEARCH ENGINE OPTIMIZATION (SEO), CONTENT MARKETING & PAID ADVERTISING
4.15.1.3 EMAIL MARKETING & CUSTOMER LOYALTY PROGRAMS
4.15.2 RETAIL PROMOTIONS & IN-STORE MARKETING
4.15.2.1 SUPERMARKET & CONVENIENCE STORE PARTNERSHIPS
4.15.2.2 SAMPLING CAMPAIGNS & PROMOTIONAL DISCOUNTS
4.15.3 EXPERIENTIAL MARKETING & SPONSORSHIPS
4.15.3.1 SPONSORSHIP OF SPORTS & FITNESS EVENTS
4.15.3.2 POP-UP HYDRATION STATIONS & OUTDOOR ACTIVATIONS
4.15.4 SUSTAINABILITY & CORPORATE SOCIAL RESPONSIBILITY INITIATIVES
4.15.4.1 ECO-FRIENDLY PACKAGING & RECYCLING PROGRAMS
4.15.4.2 COMMUNITY ENGAGEMENT & CLEAN WATER ACCESS PROGRAMS
4.15.5 CONCLUSION
4.16 SHOPPING BEHAVIOUR AND DYNAMICS
4.16.1 RECOMMENDATION FROM FAMILY & FRIENDS
4.16.2 RESEARCH
4.16.3 IMPULSIVE BUYING BEHAVIOR
4.16.4 ADVERTISEMENT
4.16.5 TELEVISION ADVERTISEMENT
4.16.6 ONLINE ADVERTISEMENT
4.16.7 IN-STORE ADVERTISEMENT
4.16.8 OUTDOOR ADVERTISEMENT
4.16.9 CONCLUSION
4.17 SUPPLY & DEMAND
4.17.1 U.S. BOTTLED WATER MARKET: SUPPLY AND DEMAND
4.17.2 DEMAND FACTORS
4.17.3 SUPPLY FACTORS
4.17.4 BRAZIL BOTTLED WATER MARKET: SUPPLY AND DEMAND
4.17.5 DEMAND FACTORS
4.17.6 SUPPLY FACTORS
4.18 TECHNOLOGICAL INNOVATION
4.18.1 U.S.
4.18.1.1 WATER PURIFICATION TECHNOLOGIES
4.18.1.2 SUSTAINABLE PACKAGING INNOVATIONS
4.18.1.3 SMART PACKAGING TECHNOLOGIES
4.18.1.4 AUTOMATION AND IOT IN PRODUCTION
4.18.1.5 E-COMMERCE AND DIGITAL MARKETING INNOVATIONS
4.18.2 BRAZIL
4.18.2.1 WATER QUALITY MONITORING TECHNOLOGIES
4.18.2.2 MINIMAL PROCESSING TECHNIQUES
4.18.2.3 SUSTAINABLE PACKAGING SOLUTIONS
4.18.2.4 DISTRIBUTION AND E-COMMERCE INNOVATIONS
4.18.2.5 CONSUMER ENGAGEMENT THROUGH TECHNOLOGY
4.18.3 CONCLUSION
4.19 VALUE CHAIN ANALYSIS
4.19.1 U.S.
4.19.1.1 SOURCING
4.19.1.2 PROCESSING
4.19.1.3 PACKAGING
4.19.1.4 DISTRIBUTION
4.19.1.5 MARKETING
4.19.2 BRAZIL
4.19.2.1 SOURCING
4.19.2.2 PROCESSING
4.19.2.3 PACKAGING
4.19.2.4 DISTRIBUTION
4.19.2.5 MARKETING
4.19.3 CONCLUSION
5 REGULATORY COVERAGE
6 MARKET OVERVIEW
6.1 DRIVERS
6.1.1 RISING CONCERNS OVER TAP WATER SAFETY AND INADEQUATE PUBLIC WATER SUPPLY
6.1.2 RISING URBANIZATION AND ON-THE-GO LIFESTYLES
6.1.3 SUSTAINABILITY INITIATIVES DRIVING ECO-FRIENDLY PACKAGING INNOVATIONS
6.2 RESTRAINTS
6.2.1 REGULATORY PRESSURE RELATED TO PLASTIC WASTE AND POLLUTION
6.2.2 HIGH PRODUCTION COSTS AND WATER SOURCE LIMITATIONS
6.3 OPPORTUNITIES
6.3.1 GROWING DEMAND FOR FUNCTIONAL AND PREMIUM WATER
6.3.2 RISING INTEREST IN BIODEGRADABLE AND REUSABLE PACKAGING OPTIONS
6.3.3 GROWTH IN E-COMMERCE AND DIRECT-TO-CONSUMER SALES
6.4 CHALLENGES
6.4.1 LOGISTICS AND DISTRIBUTION CHALLENGES
6.4.2 STRONG COMPETITION FROM ESTABLISHED INDUSTRY LEADERS
7 U.S. AND BRAZIL BOTTLED WATER MARKET, BY TYPE
7.1 OVERVIEW
7.2 REGULAR WATER
7.3 MINERAL WATER
7.4 ARTESIAN WATER
7.5 SPRING WATER
7.6 GLACIAL WATER
7.7 VOLCANIC WATER
7.8 OTHERS
8 U.S. AND BRAZIL BOTTLED WATER MARKET, BY PRODUCT TYPE
8.1 OVERVIEW
8.2 STILL
8.3 SPARKLING
9 U.S. AND BRAZIL BOTTLED WATER MARKET, BY FLAVOR
9.1 OVERVIEW
9.2 PLAIN/UNFLAVORED
9.3 FLAVORED
10 U.S. AND BRAZIL BOTTLED WATER MARKET, BY NATURE
10.1 OVERVIEW
10.2 ORGANIC
10.3 CONVENTIONAL
11 U.S. AND BRAZIL BOTTLED WATER MARKET, BY PRICING CATEGORY
11.1 OVERVIEW
11.2 REGULAR
11.3 PREMIUM
12 U.S. AND BRAZIL BOTTLED WATER MARKET, BY PACKAGING TYPE
12.1 OVERVIEW
12.2 BOTTLED
12.3 CANNED
12.4 TETRA PACK
12.5 OTHERS
13 U.S. AND BRAZIL BOTTLED WATER MARKET, BY PACKAGING SIZE
13.1 OVERVIEW
13.2 LESS THAN 16 OZ
13.3 16 OZ
13.4 20 OZ
13.5 1 L
13.6 1.5 L
13.7 2 L
13.8 5 L
13.9 MORE THAN 5 L
14 U.S. AND BRAZIL BOTTLED WATER MARKET, BY DISTRIBUTION CHANNEL
14.1 OVERVIEW
14.2 STORE BASED RETAILERS
14.3 NON-STORE RETAILERS
15 U.S. AND BRAZIL BOTTLED WATER MARKET: COMPANY LANDSCAPE
15.1 COMPANY SHARE ANALYSIS: U.S. AND BRAZIL
16 SWOT ANALYSIS
17 COMPANY PROFILES
17.1 THE COCA‑COLA COMPANY
17.1.1 COMPANY SNAPSHOT
17.1.2 REVENUE ANALYSIS
17.1.3 PRODUCT/BRAND PORTFOLIO
17.1.4 RECENT DEVELOPMENTS
17.2 DANONE
17.2.1 COMPANY SNAPSHOT
17.2.2 REVENUE ANALYSIS
17.2.3 PRODUCT PORTFOLIO
17.2.4 RECENT DEVELOPMENTS
17.3 NESTLÉ
17.3.1 COMPANY SNAPSHOT
17.3.2 REVENUE ANALYSIS
17.3.3 PRODUCT PORTFOLIO
17.3.4 RECENT DEVELOPMENTS
17.4 PEPSICO
17.4.1 COMPANY SNAPSHOT
17.4.2 REVENUE ANALYSIS
17.4.3 PRODUCT PORTFOLIO
17.4.4 RECENT DEVELOPMENTS
17.5 FIJI WATER COMPANY LLC.
17.5.1 COMPANY SNAPSHOT
17.5.2 PRODUCT PORTFOLIO
17.5.3 RECENT DEVELOPMENT
17.6 CG ROXANE, LLC
17.6.1 COMPANY SNAPSHOT
17.6.2 PRODUCT PORTFOLIO
17.6.3 RECENT DEVELOPMENT
17.7 MOUNTAIN VALLEY SPRING WATER
17.7.1 COMPANY SNAPSHOT
17.7.2 PRODUCT PORTFOLIO
17.7.3 RECENT DEVELOPMENT
17.8 TATA CONSUMER PRODUCTS LIMITED
17.8.1 COMPANY SNAPSHOT
17.8.2 REVENUE ANALYSIS
17.8.3 PRODUCT PORTFOLIO
17.8.4 RECENT DEVELOPMENT
17.9 VICHY CATALAN CORPORATION
17.9.1 COMPANY SNAPSHOT
17.9.2 PRODUCT PORTFOLIO
17.9.3 RECENT DEVELOPMENT
17.1 VOSS OF NORWAY AS
17.10.1 COMPANY SNAPSHOT
17.10.2 PRODUCT PORTFOLIO
17.10.3 RECENT DEVELOPMENT
18 QUESTIONNAIRE
19 RELATED REPORTS
List of Table
TABLE 1 COMPARATIVE BRAND ANALYSIS
TABLE 2 PRODUCT VS BRAND OVERVIEW
TABLE 3 REGULATORY COVERAGE
TABLE 4 U.S. BOTTLED WATER MARKET, BY TYPE, 2018-2032 (USD MILLION)
TABLE 5 U.S. BOTTLED WATER MARKET, BY TYPE, 2018-2032 (MILLION UNITS)
TABLE 6 BRAZIL BOTTLED WATER MARKET, BY TYPE, 2018-2032 (USD MILLION)
TABLE 7 BRAZIL BOTTLED WATER MARKET, BY TYPE, 2018-2032 (MILLION UNITS)
TABLE 8 U.S. REGULAR IN BOTTLED WATER MARKET, BY FLAVOR, 2018-2032 (USD MILLION)
TABLE 9 BRAZIL REGULAR IN BOTTLED WATER MARKET, BY FLAVOR, 2018-2032 (USD MILLION)
TABLE 10 U.S. MINERAL WATER IN BOTTLED WATER MARKET, BY FLAVOR, 2018-2032 (USD MILLION)
TABLE 11 BRAZIL MINERAL WATER IN BOTTLED WATER MARKET, BY FLAVOR, 2018-2032 (USD MILLION)
TABLE 12 U.S. ARTESIAN WATER IN BOTTLED WATER MARKET, BY FLAVOR, 2018-2032 (USD MILLION)
TABLE 13 BRAZIL ARTESIAN WATER IN BOTTLED WATER MARKET, BY FLAVOR, 2018-2032 (USD MILLION)
TABLE 14 U.S. SPRING WATER IN BOTTLED WATER MARKET, BY FLAVOR, 2018-2032 (USD MILLION)
TABLE 15 BRAZIL SPRING WATER IN BOTTLED WATER MARKET, BY FLAVOR, 2018-2032 (USD MILLION)
TABLE 16 U.S. GLACIAL WATER IN BOTTLED WATER MARKET, BY FLAVOR, 2018-2032 (USD MILLION)
TABLE 17 BRAZIL GLACIAL WATER IN BOTTLED WATER MARKET, BY FLAVOR, 2018-2032 (USD MILLION)
TABLE 18 U.S. VOLCANIC WATER IN BOTTLED WATER MARKET, BY FLAVOR, 2018-2032 (USD MILLION)
TABLE 19 BRAZIL. VOLCANIC WATER IN BOTTLED WATER MARKET, BY FLAVOR, 2018-2032 (USD MILLION)
TABLE 20 U.S. BOTTLED WATER MARKET, BY PRODUCT TYPE, 2018-2032 (USD MILLION)
TABLE 21 BRAZIL BOTTLED WATER MARKET, BY PRODUCT TYPE, 2018-2032 (USD MILLION)
TABLE 22 U.S. STILL IN BOTTLED WATER MARKET, BY FLAVOR, 2018-2032 (USD MILLION)
TABLE 23 BRAZIL STILL IN BOTTLED WATER MARKET, BY FLAVOR, 2018-2032 (USD MILLION)
TABLE 24 U.S. STILL IN BOTTLED WATER MARKET, BY NATURE, 2018-2032 (USD MILLION)
TABLE 25 BRAZIL STILL IN BOTTLED WATER MARKET, BY NATURE, 2018-2032 (USD MILLION)
TABLE 26 U.S. SPARKLING IN BOTTLED WATER MARKET, BY FLAVOR, 2018-2032 (USD MILLION)
TABLE 27 BRAZIL SPARKLING IN BOTTLED WATER MARKET, BY FLAVOR, 2018-2032 (USD MILLION)
TABLE 28 U.S. SPARKLING IN BOTTLED WATER MARKET, BY NATURE, 2018-2032 (USD MILLION)
TABLE 29 BRAZIL SPARKLING IN BOTTLED WATER MARKET, BY NATURE, 2018-2032 (USD MILLION)
TABLE 30 U.S. BOTTLED WATER MARKET, BY FLAVOR, 2018-2032 (USD MILLION)
TABLE 31 BRAZIL BOTTLED WATER MARKET, BY FLAVOR, 2018-2032 (USD MILLION)
TABLE 32 U.S. FLAVORED IN BOTTLED WATER MARKET, BY FLAVOR, 2018-2032 (USD MILLION)
TABLE 33 BRAZIL FLAVORED IN BOTTLED WATER MARKET, BY FLAVOR, 2018-2032 (USD MILLION)
TABLE 34 U.S. BOTTLED WATER MARKET, BY NATURE, 2018-2032 (USD MILLION)
TABLE 35 BRAZIL BOTTLED WATER MARKET, BY NATURE, 2018-2032 (USD MILLION)
TABLE 36 U.S. BOTTLED WATER MARKET, BY PRICING CATEGORY, 2018-2032 (USD MILLION)
TABLE 37 BRAZIL BOTTLED WATER MARKET, BY PRICING CATEGORY, 2018-2032 (USD MILLION)
TABLE 38 U.S. BOTTLED WATER MARKET, BY PACKAGING TYPE, 2018-2032 (USD MILLION)
TABLE 39 BRAZIL BOTTLED WATER MARKET, BY PACKAGING TYPE, 2018-2032 (USD MILLION)
TABLE 40 U.S. BOTTLED IN BOTTLED WATER MARKET, BY PACKAGING TYPE, 2018-2032 (USD MILLION)
TABLE 41 BRAZIL BOTTLED IN BOTTLED WATER MARKET, BY PACKAGING TYPE, 2018-2032 (USD MILLION)
TABLE 42 U.S. BOTTLED WATER MARKET, BY PACKAGING SIZE, 2018-2032 (USD MILLION)
TABLE 43 BRAZIL BOTTLED WATER MARKET, BY PACKAGING SIZE, 2018-2032 (USD MILLION)
TABLE 44 U.S. BOTTLED WATER MARKET, BY DISTRIBUTION CHANNEL, 2018-2032 (USD MILLION)
TABLE 45 BRAZIL BOTTLED WATER MARKET, BY DISTRIBUTION CHANNEL, 2018-2032 (USD MILLION)
TABLE 46 U.S. STORE BASED RETAILERS IN BOTTLED WATER MARKET, BY DISTRIBUTION CHANNEL, 2018-2032 (USD MILLION)
TABLE 47 BRAZIL STORE BASED RETAILERS IN BOTTLED WATER MARKET, BY DISTRIBUTION CHANNEL, 2018-2032 (USD MILLION)
TABLE 48 U.S. NON-STORE BASED RETAILERS IN BOTTLED WATER MARKET, BY DISTRIBUTION CHANNEL, 2018-2032 (USD MILLION)
TABLE 49 BRAZIL NON-STORE BASED RETAILERS IN BOTTLED WATER MARKET, BY DISTRIBUTION CHANNEL, 2018-2032 (USD MILLION)
TABLE 50 U.S. ONLINE IN BOTTLED WATER MARKET, BY DISTRIBUTION CHANNEL, 2018-2032 (USD MILLION)
TABLE 51 BRAZIL ONLINE IN BOTTLED WATER MARKET, BY DISTRIBUTION CHANNEL, 2018-2032 (USD MILLION)
List of Figure
FIGURE 1 U.S. AND BRAZIL BOTTLED WATER MARKET
FIGURE 2 U.S. AND BRAZIL BOTTLED WATER MARKET: DATA TRIANGULATION
FIGURE 3 U.S. AND BRAZIL BOTTLED WATER: DROC ANALYSIS
FIGURE 4 U.S. BOTTLED WATER: REGIONAL MARKET ANALYSIS
FIGURE 5 U.S. BOTTLED WATER: COMPANY RESEARCH ANALYSIS
FIGURE 6 BRAZIL BOTTLED WATER: REGIONAL MARKET ANALYSIS
FIGURE 7 BRAZIL BOTTLED WATER: COMPANY RESEARCH ANALYSIS
FIGURE 8 U.S. AND BRAZIL BOTTLED WATER: MULTIVARIATE MODELLING
FIGURE 9 U.S. AND BRAZIL BOTTLED WATER: INTERVIEW DEMOGRAPHICS
FIGURE 10 U.S. AND BRAZIL BOTTLED WATER MARKET: DBMR MARKET POSITION GRID
FIGURE 11 U.S. AND BRAZIL BOTTLED WATER MARKET: SEGMENTATION
FIGURE 12 SEVEN SEGMENTS COMPRISE THE U.S. BOTTLED WATER MARKET, BY TYPE (2024)
FIGURE 13 SEVEN SEGMENTS COMPRISE THE BRAZIL BOTTLED WATER MARKET, BY TYPE (2024)
FIGURE 14 U.S. AND BRAZIL BOTTLED WATER MARKET EXECUTIVE SUMMARY
FIGURE 15 STRATEGIC DECISIONS
FIGURE 16 RISING CONCERNS OVER TAP WATER SAFETY AND INADEQUATE PUBLIC WATER SUPPLY ARE EXPECTED TO DRIVE THE U.S. BOTTLED WATER MARKET IN THE FORECAST PERIOD (2025-2032)
FIGURE 17 RISING CONCERNS OVER TAP WATER SAFETY AND INADEQUATE PUBLIC WATER SUPPLY ARE EXPECTED TO DRIVE THE BRAZIL BOTTLED WATER MARKET IN THE FORECAST PERIOD (2025-2032)
FIGURE 18 THE REGULAR WATER SEGMENT IS EXPECTED TO ACCOUNT FOR THE LARGEST SHARE OF THE U.S. BOTTLED WATER MARKET IN 2025 AND 2032
FIGURE 19 THE MINERAL WATER SEGMENT IS EXPECTED TO ACCOUNT FOR THE LARGEST SHARE OF THE BRAZIL BOTTLED WATER MARKET IN 2025 AND 2032
FIGURE 20 IMPORT EXPORT SCENARIO (USD THOUSAND): U.S.
FIGURE 21 IMPORT EXPORT SCENARIO (USD THOUSAND): BRAZIL
FIGURE 22 U.S. AND BRAZIL BOTTLED WATER MARKET, 2024-2032, AVERAGE SELLING PRICE (USD/ UNIT)
FIGURE 23 VENDOR SELECTION CRITERIA
FIGURE 24 DRIVERS, RESTRAINTS, OPPORTUNITIES, AND CHALLENGES FOR U.S AND BRAZIL BOTTLED WATER MARKET
FIGURE 25 U.S. BOTTLED WATER MARKET: BY TYPE, 2024
FIGURE 26 BRAZIL BOTTLED WATER MARKET: BY TYPE, 2024
FIGURE 27 U.S. BOTTLED WATER MARKET: BY PRODUCT TYPE, 2024
FIGURE 28 BRAZIL BOTTLED WATER MARKET: BY PRODUCT TYPE, 2024
FIGURE 29 U.S. BOTTLED WATER MARKET: BY FLAVOR, 2024
FIGURE 30 BRAZIL BOTTLED WATER MARKET: BY FLAVOR, 2024
FIGURE 31 U.S. BOTTLED WATER MARKET, BY NATURE, 2024
FIGURE 32 BRAZIL BOTTLED WATER MARKET, BY NATURE, 2024
FIGURE 33 U.S. BOTTLED WATER MARKET, BY PRICING CATEGORY, 2024
FIGURE 34 BRAZIL BOTTLED WATER MARKET, BY PRICING CATEGORY, 2024
FIGURE 35 U.S. BOTTLED WATER MARKET: BY PACKAGING TYPE, 2024
FIGURE 36 BRAZIL BOTTLED WATER MARKET: BY PACKAGING TYPE, 2024
FIGURE 37 U.S. BOTTLED WATER MARKET, BY PACKAGING SIZE, 2024
FIGURE 38 BRAZIL BOTTLED WATER MARKET, BY PACKAGING SIZE, 2024
FIGURE 39 U.S. BOTTLED WATER MARKET: BY DISTRIBUTION CHANNEL, 2024
FIGURE 40 BRAZIL BOTTLED WATER MARKET: BY DISTRIBUTION CHANNEL, 2024
FIGURE 41 U.S. AND BRAZIL BOTTLED WATER MARKET: COMPANY SHARE 2024 (%)
Us And Brazil Bottled Water Market, Supply Chain Analysis and Ecosystem Framework
To support market growth and help clients navigate the impact of geopolitical shifts, DBMR has integrated in-depth supply chain analysis into its Us And Brazil Bottled Water Market research reports. This addition empowers clients to respond effectively to global changes affecting their industries. The supply chain analysis section includes detailed insights such as Us And Brazil Bottled Water Market consumption and production by country, price trend analysis, the impact of tariffs and geopolitical developments, and import and export trends by country and HSN code. It also highlights major suppliers with data on production capacity and company profiles, as well as key importers and exporters. In addition to research, DBMR offers specialized supply chain consulting services backed by over a decade of experience, providing solutions like supplier discovery, supplier risk assessment, price trend analysis, impact evaluation of inflation and trade route changes, and comprehensive market trend analysis.
Data collection and base year analysis are done using data collection modules with large sample sizes. The stage includes obtaining market information or related data through various sources and strategies. It includes examining and planning all the data acquired from the past in advance. It likewise envelops the examination of information inconsistencies seen across different information sources. The market data is analysed and estimated using market statistical and coherent models. Also, market share analysis and key trend analysis are the major success factors in the market report. To know more, please request an analyst call or drop down your inquiry.
The key research methodology used by DBMR research team is data triangulation which involves data mining, analysis of the impact of data variables on the market and primary (industry expert) validation. Data models include Vendor Positioning Grid, Market Time Line Analysis, Market Overview and Guide, Company Positioning Grid, Patent Analysis, Pricing Analysis, Company Market Share Analysis, Standards of Measurement, Global versus Regional and Vendor Share Analysis. To know more about the research methodology, drop in an inquiry to speak to our industry experts.
Data Bridge Market Research is a leader in advanced formative research. We take pride in servicing our existing and new customers with data and analysis that match and suits their goal. The report can be customized to include price trend analysis of target brands understanding the market for additional countries (ask for the list of countries), clinical trial results data, literature review, refurbished market and product base analysis. Market analysis of target competitors can be analyzed from technology-based analysis to market portfolio strategies. We can add as many competitors that you require data about in the format and data style you are looking for. Our team of analysts can also provide you data in crude raw excel files pivot tables (Fact book) or can assist you in creating presentations from the data sets available in the report.


